Estimated zip code population in 2022: 1,985 Zip code population in 2010: 1,377 Zip code population in 2000: 1,171
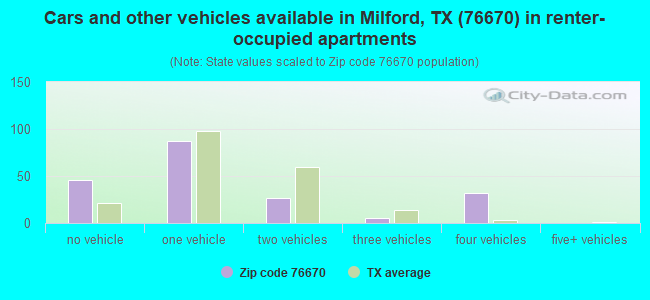
Houses and condos: 735 Renter-occupied apartments: 195
% of renters here:
29%
State:
38%
March 2022 cost of living index in zip code 76670: 84.6 (less than average, U.S. average is 100)
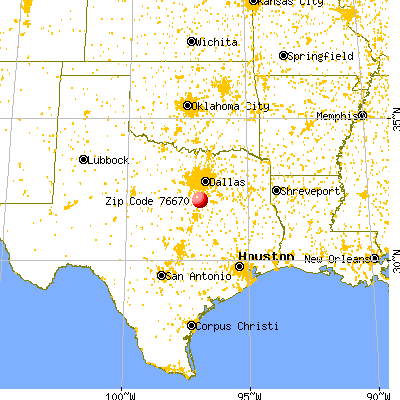
Land area: 70.1 sq. mi. Water area: 0.7 sq. mi.
Population density: 28 people per square mile
(very low).
OSM Map
General Map
Google Map
MSN Map
OSM Map
General Map
Google Map
MSN Map
OSM Map
General Map
Google Map
MSN Map
OSM Map
General Map
Google Map
MSN Map
Please wait while loading the map...
Real estate property taxes paid for housing units in 2022:
This zip code:
1.1% ($1,999)
Texas:
1.5% ($4,050)
Median real estate property taxes paid for housing units with mortgages in 2022: $1,923 (1.1%) Median real estate property taxes paid for housing units with no mortgage in 2022: $2,185 (1.2%)
Business Search- 14 Million verified businesses
Males: 1,085
(54.7%)
Females: 900
(45.3%)
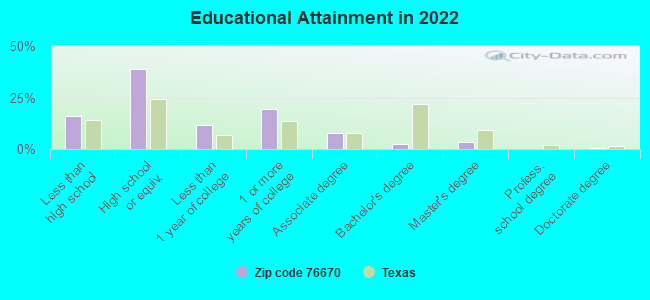
For population 25 years and over in 76670:
High school or higher: 81.7%
Bachelor's degree or higher: 6.4%
Graduate or professional degree: 3.8%
Unemployed: 7.9%
Mean travel time to work (commute): 39.1 minutes
For population 15 years and over in 76670:
Never married: 27.5%
Now married: 57.6%
Separated: 1.4%
Widowed: 5.6%
Divorced: 8.0%
Zip code 76670 compared to state average:
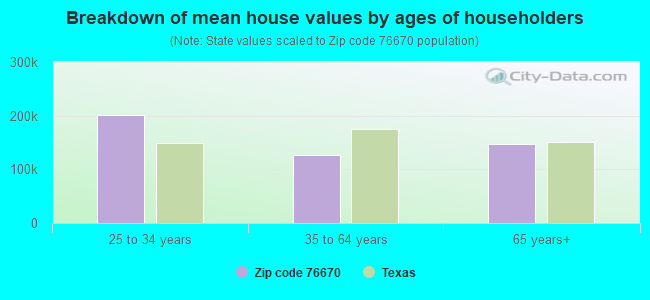
Median house value below state average.
Unemployed percentage above state average.
Median age above state average.
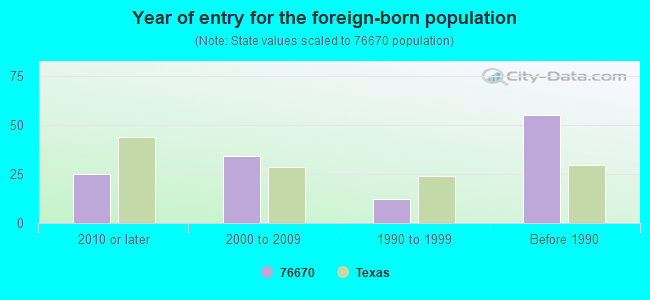
Foreign-born population percentage significantly below state average.
House age above state average.
Number of college students below state average.
Percentage of population with a bachelor's degree or higher significantly below state average.
Averages for the 2020 tax year for zip code 76670, filed in 2021:
Average Adjusted Gross Income (AGI) in 2020: $50,175 (Individual Income Tax Returns)
Here:
$50,175
State:
$77,054
Salary/wage: $51,467 (reported on 82.1% of returns)
Here:
$51,467
State:
$62,766
(% of AGI for various income ranges: 1215.3% for AGIs below $25k, 3575.3% for AGIs $25k-50k, 6172.9% for AGIs $50k-75k, 8470.0% for AGIs $75k-100k, 20351.7% for AGIs $100k-200k)
Taxable interest for individuals: $520 (reported on 14.9% of returns)
This zip code:
$520
Texas:
$2,665
(% of AGI for various income ranges: 5.8% for AGIs below $25k, 7.1% for AGIs $50k-75k, 60.0% for AGIs $100k-200k)
Ordinary dividends: $1,400 (reported on 6.0% of returns)
Here:
$1,400
State:
$10,044
(% of AGI for various income ranges: 5.3% for AGIs below $25k, 76.7% for AGIs $100k-200k)
Net capital gain/loss in AGI: +$7,960 (reported on 7.5% of returns)
Here:
+$7,960
State:
+$39,590
(% of AGI for various income ranges: 5.3% for AGIs below $25k, 646.7% for AGIs $100k-200k)
Profit/loss from business: +$5,869 (reported on 23.9% of returns)
Here:
+$5,869
State:
+$10,888
(% of AGI for various income ranges: 221.1% for AGIs below $25k, 57.6% for AGIs $25k-50k, 510.0% for AGIs $50k-75k, 106.7% for AGIs $100k-200k)
Taxable individual retirement arrangement distribution: $15,100 (reported on 4.5% of returns)
76670:
$15,100
Texas:
$24,740
(% of AGI for various income ranges: 266.5% for AGIs $25k-50k)
Total itemized deductions: $39,933 (reported on 4.5% of returns)
Here:
$39,933
State:
$40,428
(% of AGI for various income ranges: 1711.4% for AGIs $50k-75k)
Charity contributions: $14,550 (reported on 3.0% of returns)
Here:
$14,550
State:
$18,201
(% of AGI for various income ranges: 171.2% for AGIs $25k-50k)
Taxes paid: $5,200 (reported on 4.5% of returns)
76670:
$5,200
State:
$7,821
(% of AGI for various income ranges: 222.9% for AGIs $50k-75k)
Earned income credit: $2,694 (reported on 25.4% of returns)
Here:
$2,694
State:
$2,584
(% of AGI for various income ranges: 146.3% for AGIs below $25k, 105.9% for AGIs $25k-50k)
Percentage of individuals using paid preparers for their 2020 taxes: 91.0%
Here:
91%
State:
92%
(% for various income ranges: 87.5% for AGIs below $25k, 95.0% for AGIs $25k-50k, 88.9% for AGIs $50k-75k, 100.0% for AGIs $75k-100k, 88.9% for AGIs $100k-200k)
Averages for the 2012 tax year for zip code 76670, filed in 2013:
Average Adjusted Gross Income (AGI) in 2012: $44,783 (Individual Income Tax Returns)
Here:
$44,783
State:
$65,384
Salary/wage: $39,088 (reported on 88.9% of returns)
Here:
$39,088
State:
$52,524
(% of AGI for various income ranges: 78.5% for AGIs below $25k, 91.3% for AGIs $25k-50k, 80.8% for AGIs $50k-75k, 87.9% for AGIs $75k-100k, 61.2% for AGIs $100k-200k)
Taxable interest for individuals: $445 (reported on 20.4% of returns)
This zip code:
$445
Texas:
$2,372
(% of AGI for various income ranges: 0.5% for AGIs below $25k, 0.3% for AGIs $25k-50k, 0.2% for AGIs $50k-75k, 0.2% for AGIs $100k-200k)
Ordinary dividends: $950 (reported on 7.4% of returns)
Here:
$950
State:
$9,721
Net capital gain/loss in AGI: +$1,100 (reported on 5.6% of returns)
Here:
+$1,100
State:
+$35,319
Profit/loss from business: +$3,711 (reported on 16.7% of returns)
Here:
+$3,711
State:
+$13,732
(% of AGI for various income ranges: 5.5% for AGIs below $25k, 0.4% for AGIs $25k-50k, 3.2% for AGIs $50k-75k)
Taxable individual retirement arrangement distribution: $14,633 (reported on 5.6% of returns)
76670:
$14,633
Texas:
$19,511
Total itemized deductions: $17,778 (20% of AGI, reported on 16.7% of returns)
Here:
$17,778
State:
$24,724
Here:
20.4% of AGI
State:
15.9% of AGI
(% of AGI for various income ranges: 10.6% for AGIs $25k-50k, 9.4% for AGIs $50k-75k, 7.8% for AGIs $100k-200k)
Charity contributions: $7,020 (reported on 9.3% of returns)
Here:
$7,020
State:
$6,808
Taxes paid: $3,962 (reported on 14.8% of returns)
76670:
$3,962
State:
$6,921
(% of AGI for various income ranges: 1.3% for AGIs $25k-50k, 1.8% for AGIs $50k-75k, 2.1% for AGIs $100k-200k)
Earned income credit: $2,531 (reported on 29.6% of returns)
Here:
$2,531
State:
$2,570
(% of AGI for various income ranges: 10.0% for AGIs below $25k, 1.7% for AGIs $25k-50k)
Percentage of individuals using paid preparers for their 2012 taxes: 48.1%
Here:
48%
State:
51%
(% for various income ranges: 45.8% for AGIs below $25k, 53.3% for AGIs $25k-50k, 42.9% for AGIs $50k-75k, 50.0% for AGIs $75k-100k, 50.0% for AGIs $100k-200k)
Averages for the 2004 tax year for zip code 76670, filed in 2005:
Average Adjusted Gross Income (AGI) in 2004: $35,412 (Individual Income Tax Returns)
Here:
$35,412
State:
$47,881
Salary/wage: $33,798 (reported on 85.7% of returns)
Here:
$33,798
State:
$41,947
(% of AGI for various income ranges: 218.2% for AGIs below $10k, 78.4% for AGIs $10k-25k, 91.1% for AGIs $25k-50k, 82.1% for AGIs $50k-75k, 79.0% for AGIs $75k-100k, 62.8% for AGIs over 100k)
Taxable interest for individuals: $688 (reported on 23.5% of returns)
This zip code:
$688
Texas:
$2,255
(% of AGI for various income ranges: 0.9% for AGIs below $10k, 0.6% for AGIs $10k-25k, 0.4% for AGIs $25k-50k, 0.2% for AGIs $50k-75k, 0.8% for AGIs over 100k)
Taxable dividends: $523 (reported on 8.3% of returns)
Here:
$523
State:
$4,261
Net capital gain/loss: +$4,000 (reported on 8.5% of returns)
Here:
+$4,000
State:
+$16,110
(% of AGI for various income ranges: -0.9% for AGIs below $10k, -0.2% for AGIs $25k-50k, 0.7% for AGIs $50k-75k, 3.7% for AGIs over 100k)
Profit/loss from business: +$9,556 (reported on 15.3% of returns)
Here:
+$9,556
State:
+$11,013
(% of AGI for various income ranges: 37.8% for AGIs below $10k, 10.2% for AGIs $10k-25k, 2.1% for AGIs $25k-50k, 6.1% for AGIs $50k-75k)
Total itemized deductions: $17,100 (23% of AGI, reported on 13.2% of returns)
Here:
$17,100
State:
$19,631
Here:
23.2% of AGI
State:
18.9% of AGI
Charity contributions deductions: $3,739 (5% of AGI, reported on 8.7% of returns)
Here:
$3,739
State:
$4,753
Here:
5.3% of AGI
State:
4.2% of AGI
Total tax: $4,587 (reported on 66.1% of returns)
76670:
$4,587
State:
$9,058
(% of AGI for various income ranges: 2.6% for AGIs below $10k, 4.1% for AGIs $10k-25k, 5.9% for AGIs $25k-50k, 9.1% for AGIs $50k-75k, 11.4% for AGIs $75k-100k, 13.6% for AGIs over 100k)
Earned income credit: $1,973 (reported on 27.7% of returns)
Here:
$1,973
State:
$2,024
Percentage of individuals using paid preparers for their 2004 taxes: 54.8%
Here:
55%
State:
57%
(% for various income ranges: 50.5% for AGIs below $10k, 59.7% for AGIs $10k-25k, 48.7% for AGIs $25k-50k, 56.1% for AGIs $50k-75k, 82.4% for AGIs $75k-100k, 59.1% for AGIs over 100k)
Household received Food Stamps/SNAP in the past 12 months: 163 Household did not receive Food Stamps/SNAP in the past 12 months: 502
Women who had a birth in the past 12 months: 5 (5 now married, 0 unmarried) Women who did not have a birth in the past 12 months: 351 (192 now married, 157 unmarried)
Housing units in zip code 76670 with a mortgage: 156 Median monthly owner costs for units with a mortgage: $1,247 Median monthly owner costs for units without a mortgage: $637
Residents with income below the poverty level in 2022:
This zip code:
14.1%
Whole state:
14.0%
Residents with income below 50% of the poverty level in 2022:
This zip code:
6.9%
Whole state:
7.4%
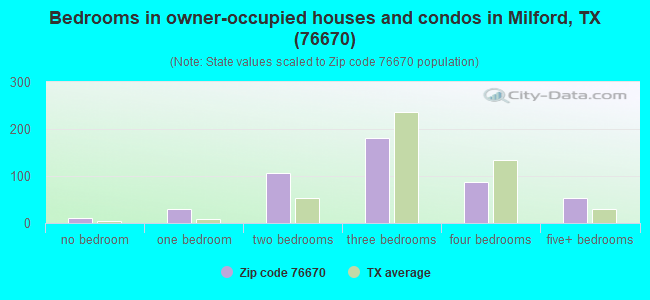
Median number of rooms in houses and condos:
Here:
6.1
State:
6.3
Median number of rooms in apartments:
Here:
4.3
State:
4.0
Notable locations in this zip code not listed on our city pages
Reservoirs: Soil Conservation Service Site 97 Reservoir (A), Soil Conservation Service Site 98 Reservoir (B), Soil Conservation Service Site 98a Reservoir (C), Soil Conservation Service Site 44 Reservoir (D), Soil Conservation Service Site 38 Reservoir (E), Soil Conservation Service Site 37 Reservoir (F), Soil Conservation Service Site 39 Reservoir (G), Soil Conservation Service Site 40 Reservoir (H). Display/hide their locations on the map
Size of family households: 187 2-persons, 112 3-persons, 81 4-persons, 47 5-persons, 60 6-persons, 4 7-or-more-persons
Size of nonfamily households: 152 1-person, 7 2-persons, 3 3-persons
318 married couples with children.
58 single-parent households (28 men, 30 women).
81.3% of residents of 76670 zip code speak English at home.
18.6% of residents speak Spanish at home (75% very well, 10% well, 11% not well, 4% not at all).
Foreign born population: 123 (6.2%) (53.5% of them are naturalized citizens)
This zip code:
6.2%
Whole state:
17.2%
95%Honduras
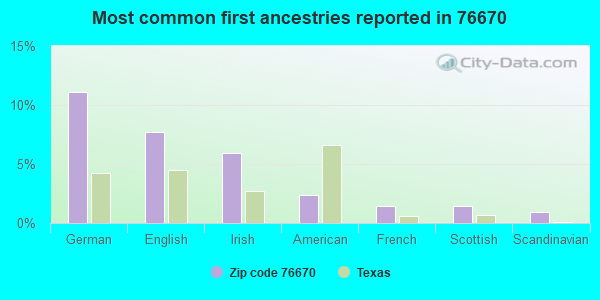
11%German
8%English
6%Irish
2%American
1%French
1%Scottish
1%Scandinavian
Year of entry for the foreign-born population
252010 or later
342000 to 2009
121990 to 1999
55Before 1990
Housing units lacking complete plumbing facilities: 7.2% Housing units lacking complete kitchen facilities: 4.0%
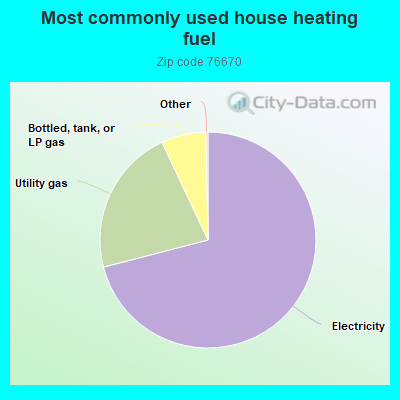
71.1%Electricity
22.1%Utility gas
6.7%Bottled, tank, or LP gas
Population in 1990: 1,259.
Place of birth for U.S.-born residents:
This state: 1,550
Midwest: 111
South: 116
West: 59
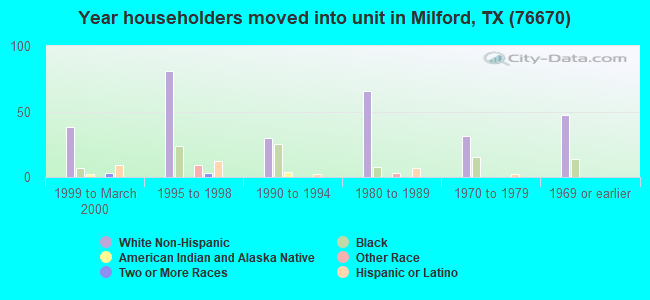
56% of the 76670 zip code residents lived in the same house 5 years ago. Out of people who lived in different houses, 56% lived in this county. Out of people who lived in different counties, 50% lived in Texas.
95% of the 76670 zip code residents lived in the same house 1 year ago. Out of people who lived in different houses, 31% moved from this county. Out of people who lived in different houses, 68% moved from different county within same state. Out of people who lived in different houses, 4% moved from abroad.
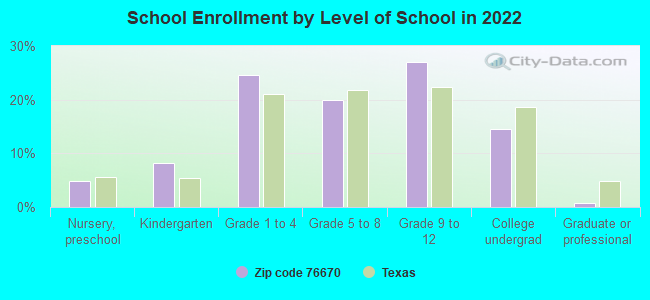
Private vs. public school enrollment:
Students in private schools in grades 1 to 8 (elementary and middle school):
Here:
0.0%
Texas:
8.8%
Students in private schools in grades 9 to 12 (high school):
Here:
0.0%
Texas:
8.0%
Students in private undergraduate colleges: 17
Here:
30.5%
Texas:
16.2%
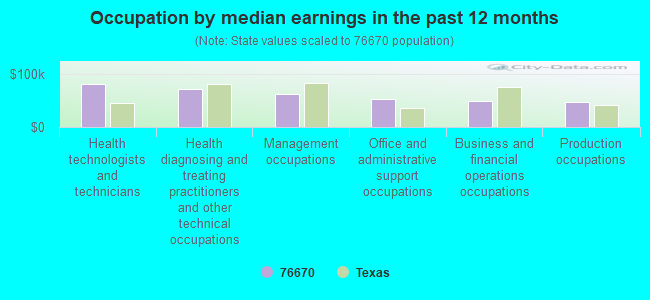
Occupation by median earnings in the past 12 months ($)
80,483Health technologists and technicians
71,911Health diagnosing and treating practitioners and other technical occupations
61,651Management occupations
53,597Office and administrative support occupations
48,649Business and financial operations occupations
46,567Production occupations
Top industries in this zip code by the number of employees in 2005:
Construction: Commercial and Institutional Building Construction (20-49 employees: 1 establishment)
Other Services (except Public Administration): Religious Organizations (5-9: 1)
Professional, Scientific, and Technical Services: Drafting Services (5-9: 1)
Professional, Scientific, and Technical Services: Other Scientific and Technical Consulting Services (1-4: 1)
Other Services (except Public Administration): Cemeteries and Crematories (1-4: 1)
Arts, Entertainment, and Recreation: Independent Artists, Writers, and Performers (1-4: 1)
Real Estate and Rental and Leasing: Other Activities Related to Real Estate (1-4: 1)
Fatal accident statistics in 2014:
Fatal accident count: 3
Vehicles involved in fatal accidents: 6
Fatal accidents caused by drunken drivers: 0
Fatalities: 4
Persons involved in fatal accidents: 6
Pedestrians involved in fatal accidents: 1
Fatal accident statistics in 2010:
Fatal accident count: 2
Vehicles involved in fatal accidents: 2
Fatal accidents caused by drunken drivers: 1
Fatalities: 2
Persons involved in fatal accidents: 20
Pedestrians involved in fatal accidents: 0
Home Mortgage Disclosure Act Aggregated Statistics For Year 2009 (Based on 2 partial tracts)
A) FHA, FSA/RHS & VA Home Purchase Loans
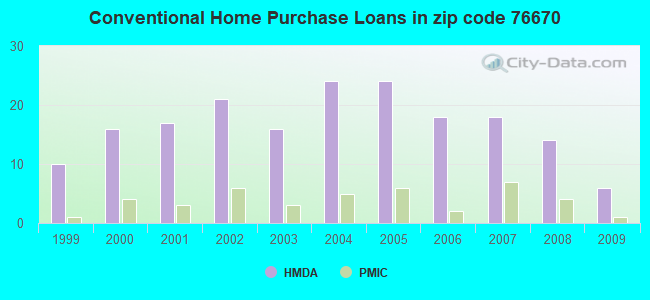
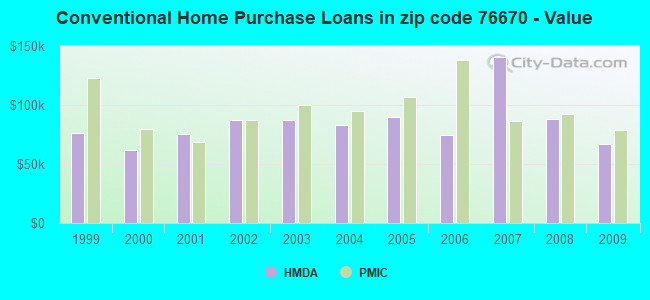
B) Conventional Home Purchase Loans
C) Refinancings
D) Home Improvement Loans
F) Non-occupant Loans on < 5 Family Dwellings (A B C & D)
G) Loans On Manufactured Home Dwelling (A B C & D)
Number
Average Value
Number
Average Value
Number
Average Value
Number
Average Value
Number
Average Value
Number
Average Value
LOANS ORIGINATED
4
$103,055
6
$67,260
15
$122,655
2
$50,745
4
$46,418
1
$101,970
APPLICATIONS APPROVED, NOT ACCEPTED
0
$0
0
$0
2
$85,380
0
$0
0
$0
0
$0
APPLICATIONS DENIED
5
$75,902
4
$71,910
14
$97,265
4
$25,732
0
$0
3
$37,037
APPLICATIONS WITHDRAWN
1
$216,930
2
$71,190
3
$151,033
1
$60,130
1
$60,130
0
$0
FILES CLOSED FOR INCOMPLETENESS
0
$0
0
$0
0
$0
0
$0
0
$0
0
$0
Aggregated Statistics For Year 2008 (Based on 2 partial tracts)
A) FHA, FSA/RHS & VA Home Purchase Loans
B) Conventional Home Purchase Loans
C) Refinancings
D) Home Improvement Loans
F) Non-occupant Loans on < 5 Family Dwellings (A B C & D)
G) Loans On Manufactured Home Dwelling (A B C & D)
Number
Average Value
Number
Average Value
Number
Average Value
Number
Average Value
Number
Average Value
Number
Average Value
LOANS ORIGINATED
4
$101,612
14
$88,332
11
$102,585
4
$22,488
7
$59,781
3
$66,057
APPLICATIONS APPROVED, NOT ACCEPTED
1
$76,480
2
$182,300
3
$69,103
2
$19,960
0
$0
2
$84,895
APPLICATIONS DENIED
2
$107,025
4
$67,220
17
$108,904
9
$28,967
2
$187,590
4
$43,290
APPLICATIONS WITHDRAWN
0
$0
2
$117,125
8
$135,582
0
$0
1
$38,960
0
$0
FILES CLOSED FOR INCOMPLETENESS
1
$94,760
0
$0
0
$0
0
$0
0
$0
0
$0
Aggregated Statistics For Year 2007 (Based on 2 partial tracts)
A) FHA, FSA/RHS & VA Home Purchase Loans
B) Conventional Home Purchase Loans
C) Refinancings
D) Home Improvement Loans
F) Non-occupant Loans on < 5 Family Dwellings (A B C & D)
G) Loans On Manufactured Home Dwelling (A B C & D)
Number
Average Value
Number
Average Value
Number
Average Value
Number
Average Value
Number
Average Value
Number
Average Value
LOANS ORIGINATED
7
$85,411
18
$140,693
17
$113,884
6
$50,185
6
$140,612
4
$78,402
APPLICATIONS APPROVED, NOT ACCEPTED
0
$0
6
$59,403
1
$114,960
2
$49,305
0
$0
2
$64,215
APPLICATIONS DENIED
1
$56,280
17
$72,886
18
$89,092
13
$38,073
2
$41,125
6
$48,662
APPLICATIONS WITHDRAWN
0
$0
3
$72,953
13
$107,078
0
$0
0
$0
0
$0
FILES CLOSED FOR INCOMPLETENESS
0
$0
1
$177,970
5
$153,728
1
$56,280
0
$0
0
$0
Aggregated Statistics For Year 2006 (Based on 2 partial tracts)
A) FHA, FSA/RHS & VA Home Purchase Loans
B) Conventional Home Purchase Loans
C) Refinancings
D) Home Improvement Loans
F) Non-occupant Loans on < 5 Family Dwellings (A B C & D)
G) Loans On Manufactured Home Dwelling (A B C & D)
Number
Average Value
Number
Average Value
Number
Average Value
Number
Average Value
Number
Average Value
Number
Average Value
LOANS ORIGINATED
3
$91,550
18
$74,528
12
$131,994
4
$36,555
9
$93,634
3
$66,377
APPLICATIONS APPROVED, NOT ACCEPTED
0
$0
5
$63,108
3
$221,260
0
$0
1
$181,340
1
$67,340
APPLICATIONS DENIED
0
$0
10
$77,970
24
$84,856
8
$23,028
3
$92,993
5
$35,306
APPLICATIONS WITHDRAWN
0
$0
3
$129,390
13
$111,037
0
$0
1
$130,350
0
$0
FILES CLOSED FOR INCOMPLETENESS
0
$0
0
$0
6
$144,380
0
$0
0
$0
0
$0
Aggregated Statistics For Year 2005 (Based on 2 partial tracts)
A) FHA, FSA/RHS & VA Home Purchase Loans
B) Conventional Home Purchase Loans
C) Refinancings
D) Home Improvement Loans
F) Non-occupant Loans on < 5 Family Dwellings (A B C & D)
G) Loans On Manufactured Home Dwelling (A B C & D)
Number
Average Value
Number
Average Value
Number
Average Value
Number
Average Value
Number
Average Value
Number
Average Value
LOANS ORIGINATED
5
$80,134
24
$90,107
19
$92,428
3
$46,337
4
$81,770
1
$149,110
APPLICATIONS APPROVED, NOT ACCEPTED
0
$0
8
$83,394
5
$80,520
1
$10,580
2
$102,455
1
$80,810
APPLICATIONS DENIED
1
$90,910
12
$57,921
19
$94,782
3
$36,237
3
$53,873
6
$65,657
APPLICATIONS WITHDRAWN
0
$0
10
$74,555
12
$71,589
2
$68,785
6
$88,263
1
$94,280
FILES CLOSED FOR INCOMPLETENESS
0
$0
1
$132,760
6
$94,998
0
$0
0
$0
0
$0
Aggregated Statistics For Year 2004 (Based on 2 partial tracts)
A) FHA, FSA/RHS & VA Home Purchase Loans
B) Conventional Home Purchase Loans
C) Refinancings
D) Home Improvement Loans
F) Non-occupant Loans on < 5 Family Dwellings (A B C & D)
G) Loans On Manufactured Home Dwelling (A B C & D)
Number
Average Value
Number
Average Value
Number
Average Value
Number
Average Value
Number
Average Value
Number
Average Value
LOANS ORIGINATED
5
$89,466
24
$83,433
30
$92,480
2
$51,225
4
$34,872
3
$47,620
APPLICATIONS APPROVED, NOT ACCEPTED
1
$69,260
2
$80,085
5
$84,656
0
$0
0
$0
0
$0
APPLICATIONS DENIED
2
$87,300
9
$69,746
25
$79,057
10
$31,746
2
$43,050
3
$41,367
APPLICATIONS WITHDRAWN
0
$0
4
$145,382
10
$80,616
0
$0
1
$64,940
0
$0
FILES CLOSED FOR INCOMPLETENESS
0
$0
0
$0
3
$106,783
0
$0
0
$0
0
$0
Aggregated Statistics For Year 2003 (Based on 2 partial tracts)
A) FHA, FSA/RHS & VA Home Purchase Loans
B) Conventional Home Purchase Loans
C) Refinancings
D) Home Improvement Loans
F) Non-occupant Loans on < 5 Family Dwellings (A B C & D)
Number
Average Value
Number
Average Value
Number
Average Value
Number
Average Value
Number
Average Value
LOANS ORIGINATED
5
$93,410
16
$87,061
42
$95,100
2
$32,710
6
$70,547
APPLICATIONS APPROVED, NOT ACCEPTED
0
$0
1
$76,000
8
$79,004
1
$39,440
1
$72,150
APPLICATIONS DENIED
2
$98,365
8
$72,631
23
$91,202
7
$35,389
0
$0
APPLICATIONS WITHDRAWN
1
$92,350
3
$120,730
15
$84,463
0
$0
1
$46,660
FILES CLOSED FOR INCOMPLETENESS
0
$0
0
$0
1
$105,820
0
$0
0
$0
Aggregated Statistics For Year 2002 (Based on 2 partial tracts)
A) FHA, FSA/RHS & VA Home Purchase Loans
B) Conventional Home Purchase Loans
C) Refinancings
D) Home Improvement Loans
F) Non-occupant Loans on < 5 Family Dwellings (A B C & D)
Number
Average Value
Number
Average Value
Number
Average Value
Number
Average Value
Number
Average Value
LOANS ORIGINATED
2
$98,845
21
$87,267
22
$75,189
1
$33,670
2
$41,845
APPLICATIONS APPROVED, NOT ACCEPTED
1
$84,660
4
$80,328
4
$92,352
1
$5,770
0
$0
APPLICATIONS DENIED
0
$0
13
$131,424
12
$70,908
4
$12,988
0
$0
APPLICATIONS WITHDRAWN
0
$0
0
$0
7
$80,396
1
$16,840
0
$0
FILES CLOSED FOR INCOMPLETENESS
0
$0
4
$83,332
1
$120,730
0
$0
0
$0
Aggregated Statistics For Year 2001 (Based on 2 partial tracts)
A) FHA, FSA/RHS & VA Home Purchase Loans
B) Conventional Home Purchase Loans
C) Refinancings
D) Home Improvement Loans
F) Non-occupant Loans on < 5 Family Dwellings (A B C & D)
Number
Average Value
Number
Average Value
Number
Average Value
Number
Average Value
Number
Average Value
LOANS ORIGINATED
4
$76,720
17
$75,658
20
$84,632
1
$33,190
3
$36,557
APPLICATIONS APPROVED, NOT ACCEPTED
0
$0
4
$78,765
3
$80,167
1
$25,490
0
$0
APPLICATIONS DENIED
0
$0
23
$43,792
10
$83,886
3
$24,530
0
$0
APPLICATIONS WITHDRAWN
0
$0
3
$59,963
8
$64,755
0
$0
0
$0
FILES CLOSED FOR INCOMPLETENESS
0
$0
1
$113,520
2
$95,240
0
$0
0
$0
Aggregated Statistics For Year 2000 (Based on 2 partial tracts)
A) FHA, FSA/RHS & VA Home Purchase Loans
B) Conventional Home Purchase Loans
C) Refinancings
D) Home Improvement Loans
F) Non-occupant Loans on < 5 Family Dwellings (A B C & D)
Number
Average Value
Number
Average Value
Number
Average Value
Number
Average Value
Number
Average Value
LOANS ORIGINATED
5
$68,110
16
$62,169
5
$64,838
3
$31,103
3
$45,697
APPLICATIONS APPROVED, NOT ACCEPTED
1
$81,770
2
$79,125
2
$86,580
2
$27,660
0
$0
APPLICATIONS DENIED
0
$0
13
$49,654
6
$145,182
5
$42,424
1
$28,860
APPLICATIONS WITHDRAWN
0
$0
2
$33,430
3
$64,613
0
$0
0
$0
FILES CLOSED FOR INCOMPLETENESS
0
$0
1
$67,340
3
$64,293
0
$0
1
$43,770
Aggregated Statistics For Year 1999 (Based on 1 partial tract)
A) FHA, FSA/RHS & VA Home Purchase Loans
B) Conventional Home Purchase Loans
C) Refinancings
D) Home Improvement Loans
F) Non-occupant Loans on < 5 Family Dwellings (A B C & D)
Detailed PMIC statistics for the following Tracts:0610.00
2002 - 2018 National Fire Incident Reporting System (NFIRS) incidents
Based on the data from the years 2002 - 2018 the average number of fire incidents per year is 23. The highest number of reported fire incidents - 44 took place in 2003, and the least - 5 in 2016. The data has a declining trend.
When looking into fire subcategories, the most incidents belonged to: Outside Fires (54.6%), and Mobile Property/Vehicle Fires (23.3%).
Fire incident types reported to NFIRS in Zip Code 76670


 Nearest zip codes: 76628, 76666, 76651, 76631, 76055, 76064.
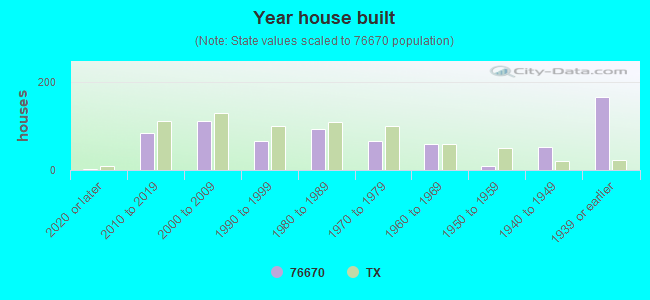


 Based on the data from the years 2002 - 2018 the average number of fire incidents per year is 23. The highest number of reported fire incidents - 44 took place in 2003, and the least - 5 in 2016. The data has a declining trend.
 When looking into fire subcategories, the most incidents belonged to: Outside Fires (54.6%), and Mobile Property/Vehicle Fires (23.3%).