Estimated zip code population in 2022: 1,683 Zip code population in 2010: 1,622 Zip code population in 2000: 1,527
Houses and condos: 862 Renter-occupied apartments: 127
% of renters here:
22%
State:
38%
March 2022 cost of living index in zip code 76853: 80.0 (low, U.S. average is 100)
Land area: 256.8 sq. mi. Water area: 0.6 sq. mi.
Population density: 7 people per square mile
(very low).
OSM Map
General Map
Google Map
MSN Map
OSM Map
General Map
Google Map
MSN Map
OSM Map
General Map
Google Map
MSN Map
OSM Map
General Map
Google Map
MSN Map
Please wait while loading the map...
Real estate property taxes paid for housing units in 2022:
This zip code:
0.8% ($2,014)
Texas:
1.5% ($4,050)
Median real estate property taxes paid for housing units with mortgages in 2022: $1,946 (0.7%) Median real estate property taxes paid for housing units with no mortgage in 2022: $2,155 (1.1%)
Business Search- 14 Million verified businesses
Males: 908
(54.0%)
Females: 774
(46.0%)
For population 25 years and over in 76853:
High school or higher: 84.8%
Bachelor's degree or higher: 27.8%
Graduate or professional degree: 7.7%
Unemployed: 5.8%
Mean travel time to work (commute): 30.5 minutes
For population 15 years and over in 76853:
Never married: 21.7%
Now married: 53.9%
Separated: 6.0%
Widowed: 7.8%
Divorced: 10.7%
Zip code 76853 compared to state average:
Black race population percentage significantly below state average.
Hispanic race population percentage below state average.
Median age significantly above state average.
Foreign-born population percentage significantly below state average.
Renting percentage below state average.
Length of stay since moving in significantly above state average.
Averages for the 2020 tax year for zip code 76853, filed in 2021:
Average Adjusted Gross Income (AGI) in 2020: $58,368 (Individual Income Tax Returns)
Here:
$58,368
State:
$77,054
Salary/wage: $47,875 (reported on 75.0% of returns)
Here:
$47,875
State:
$62,766
(% of AGI for various income ranges: 1328.1% for AGIs below $25k, 3461.4% for AGIs $25k-50k, 7311.4% for AGIs $50k-75k, 8155.0% for AGIs $75k-100k, 22662.5% for AGIs $100k-200k)
Taxable interest for individuals: $1,195 (reported on 29.4% of returns)
This zip code:
$1,195
Texas:
$2,665
(% of AGI for various income ranges: 9.4% for AGIs below $25k, 37.1% for AGIs $25k-50k, 70.0% for AGIs $50k-75k, 70.0% for AGIs $75k-100k, 237.5% for AGIs $100k-200k)
Ordinary dividends: $2,117 (reported on 17.6% of returns)
Here:
$2,117
State:
$10,044
(% of AGI for various income ranges: 5.6% for AGIs below $25k, 70.0% for AGIs $25k-50k, 75.0% for AGIs $75k-100k, 292.5% for AGIs $100k-200k)
Net capital gain/loss in AGI: +$13,008 (reported on 17.6% of returns)
Here:
+$13,008
State:
+$39,590
(% of AGI for various income ranges: 7.5% for AGIs below $25k, 235.0% for AGIs $25k-50k, 515.0% for AGIs $75k-100k, 2535.0% for AGIs $100k-200k)
Profit/loss from business: +$15,929 (reported on 20.6% of returns)
Here:
+$15,929
State:
+$10,888
(% of AGI for various income ranges: 271.2% for AGIs below $25k, 277.1% for AGIs $25k-50k, 512.9% for AGIs $50k-75k, 2622.5% for AGIs $100k-200k)
Taxable individual retirement arrangement distribution: $19,517 (reported on 8.8% of returns)
76853:
$19,517
Texas:
$24,740
(% of AGI for various income ranges: 204.3% for AGIs $25k-50k, 2212.5% for AGIs $75k-100k)
Total itemized deductions: $28,300 (reported on 5.9% of returns)
Here:
$28,300
State:
$40,428
(% of AGI for various income ranges: 2830.0% for AGIs $75k-100k)
Charity contributions: $10,000 (reported on 4.4% of returns)
Here:
$10,000
State:
$18,201
(% of AGI for various income ranges: 428.6% for AGIs $50k-75k)
Taxes paid: $6,467 (reported on 4.4% of returns)
76853:
$6,467
State:
$7,821
(% of AGI for various income ranges: 485.0% for AGIs $75k-100k)
Earned income credit: $2,815 (reported on 19.1% of returns)
Here:
$2,815
State:
$2,584
(% of AGI for various income ranges: 158.8% for AGIs below $25k, 80.0% for AGIs $25k-50k)
Percentage of individuals using paid preparers for their 2020 taxes: 92.6%
Here:
93%
State:
92%
(% for various income ranges: 91.3% for AGIs below $25k, 94.7% for AGIs $25k-50k, 90.9% for AGIs $50k-75k, 100.0% for AGIs $75k-100k, 114.3% for AGIs $100k-200k, 0.0% for AGIs over 200k)
Averages for the 2012 tax year for zip code 76853, filed in 2013:
Average Adjusted Gross Income (AGI) in 2012: $41,020 (Individual Income Tax Returns)
Here:
$41,020
State:
$65,384
Salary/wage: $33,739 (reported on 75.4% of returns)
Here:
$33,739
State:
$52,524
(% of AGI for various income ranges: 71.0% for AGIs below $25k, 73.9% for AGIs $25k-50k, 69.7% for AGIs $50k-75k, 80.2% for AGIs $75k-100k, 42.6% for AGIs $100k-200k)
Taxable interest for individuals: $1,306 (reported on 26.2% of returns)
This zip code:
$1,306
Texas:
$2,372
(% of AGI for various income ranges: 1.0% for AGIs below $25k, 0.7% for AGIs $25k-50k, 1.1% for AGIs $50k-75k, 1.0% for AGIs $100k-200k)
Ordinary dividends: $2,857 (reported on 11.5% of returns)
Here:
$2,857
State:
$9,721
(% of AGI for various income ranges: 0.4% for AGIs below $25k, 2.2% for AGIs $25k-50k, 1.0% for AGIs $100k-200k)
Net capital gain/loss in AGI: +$13,083 (reported on 9.8% of returns)
Here:
+$13,083
State:
+$35,319
(% of AGI for various income ranges: 2.1% for AGIs below $25k, 0.8% for AGIs $50k-75k, 7.3% for AGIs $100k-200k)
Profit/loss from business: +$6,821 (reported on 23.0% of returns)
Here:
+$6,821
State:
+$13,732
(% of AGI for various income ranges: 12.7% for AGIs below $25k, 6.6% for AGIs $25k-50k, 5.4% for AGIs $75k-100k)
Taxable individual retirement arrangement distribution: $17,840 (reported on 8.2% of returns)
76853:
$17,840
Texas:
$19,511
Total itemized deductions: $16,933 (23% of AGI, reported on 14.8% of returns)
Here:
$16,933
State:
$24,724
Here:
22.8% of AGI
State:
15.9% of AGI
(% of AGI for various income ranges: 11.5% for AGIs below $25k, 12.6% for AGIs $50k-75k, 5.6% for AGIs $100k-200k)
Charity contributions: $4,983 (reported on 9.8% of returns)
Here:
$4,983
State:
$6,808
Taxes paid: $3,722 (reported on 14.8% of returns)
76853:
$3,722
State:
$6,921
(% of AGI for various income ranges: 1.9% for AGIs below $25k, 2.2% for AGIs $50k-75k, 1.8% for AGIs $100k-200k)
Earned income credit: $2,439 (reported on 29.5% of returns)
Here:
$2,439
State:
$2,570
(% of AGI for various income ranges: 9.0% for AGIs below $25k, 2.0% for AGIs $25k-50k)
Percentage of individuals using paid preparers for their 2012 taxes: 63.9%
Here:
64%
State:
51%
(% for various income ranges: 59.4% for AGIs below $25k, 66.7% for AGIs $25k-50k, 71.4% for AGIs $50k-75k, 50.0% for AGIs $75k-100k, 83.3% for AGIs $100k-200k)
Averages for the 2004 tax year for zip code 76853, filed in 2005:
Average Adjusted Gross Income (AGI) in 2004: $35,461 (Individual Income Tax Returns)
Here:
$35,461
State:
$47,881
Salary/wage: $28,147 (reported on 76.6% of returns)
Here:
$28,147
State:
$41,947
(% of AGI for various income ranges: 83.0% for AGIs $10k-25k, 78.3% for AGIs $25k-50k, 57.4% for AGIs $50k-75k, 41.4% for AGIs $75k-100k, 36.1% for AGIs over 100k)
Taxable interest for individuals: $2,613 (reported on 39.9% of returns)
This zip code:
$2,613
Texas:
$2,255
(% of AGI for various income ranges: 2.7% for AGIs $10k-25k, 2.4% for AGIs $25k-50k, 1.4% for AGIs $50k-75k, 2.8% for AGIs $75k-100k, 3.1% for AGIs over 100k)
Taxable dividends: $1,433 (reported on 15.6% of returns)
Here:
$1,433
State:
$4,261
(% of AGI for various income ranges: 0.8% for AGIs $10k-25k, 0.3% for AGIs $25k-50k, 1.1% for AGIs $50k-75k, 0.6% for AGIs $75k-100k, 0.3% for AGIs over 100k)
Net capital gain/loss: +$21,767 (reported on 17.9% of returns)
Here:
+$21,767
State:
+$16,110
(% of AGI for various income ranges: 0.4% for AGIs $10k-25k, 3.3% for AGIs $25k-50k, 5.7% for AGIs $50k-75k, 6.7% for AGIs $75k-100k, 22.7% for AGIs over 100k)
Profit/loss from business: +$3,543 (reported on 20.1% of returns)
Here:
+$3,543
State:
+$11,013
(% of AGI for various income ranges: 6.3% for AGIs $10k-25k, 5.5% for AGIs $25k-50k, 1.4% for AGIs $50k-75k, -7.5% for AGIs $75k-100k)
Total itemized deductions: $19,127 (17% of AGI, reported on 12.3% of returns)
Here:
$19,127
State:
$19,631
Here:
17.4% of AGI
State:
18.9% of AGI
Charity contributions deductions: $6,211 (5% of AGI, reported on 9.9% of returns)
Here:
$6,211
State:
$4,753
Here:
5.0% of AGI
State:
4.2% of AGI
Total tax: $6,879 (reported on 60.1% of returns)
76853:
$6,879
State:
$9,058
(% of AGI for various income ranges: 3.2% for AGIs $10k-25k, 6.0% for AGIs $25k-50k, 8.1% for AGIs $50k-75k, 12.8% for AGIs $75k-100k, 18.9% for AGIs over 100k)
Earned income credit: $2,120 (reported on 28.8% of returns)
Here:
$2,120
State:
$2,024
Percentage of individuals using paid preparers for their 2004 taxes: 66.0%
Here:
66%
State:
57%
(% for various income ranges: 61.0% for AGIs below $10k, 67.6% for AGIs $10k-25k, 68.3% for AGIs $25k-50k, 67.3% for AGIs $50k-75k, 65.4% for AGIs $75k-100k, 72.0% for AGIs over 100k)
Household received Food Stamps/SNAP in the past 12 months: 48 Household did not receive Food Stamps/SNAP in the past 12 months: 532
Women who had a birth in the past 12 months: 6 (4 now married, 1 unmarried) Women who did not have a birth in the past 12 months: 300 (140 now married, 159 unmarried)
Housing units in zip code 76853 with a mortgage: 158 (3 second mortgage, 4 both second mortgage and home equity loan) Median monthly owner costs for units with a mortgage: $1,460 Median monthly owner costs for units without a mortgage: $556
Residents with income below the poverty level in 2022:
This zip code:
12.6%
Whole state:
14.0%
Residents with income below 50% of the poverty level in 2022:
This zip code:
3.3%
Whole state:
7.4%
Median number of rooms in houses and condos:
Here:
6.0
State:
6.3
Median number of rooms in apartments:
Here:
4.7
State:
4.0
Notable locations in this zip code not listed on our city pages
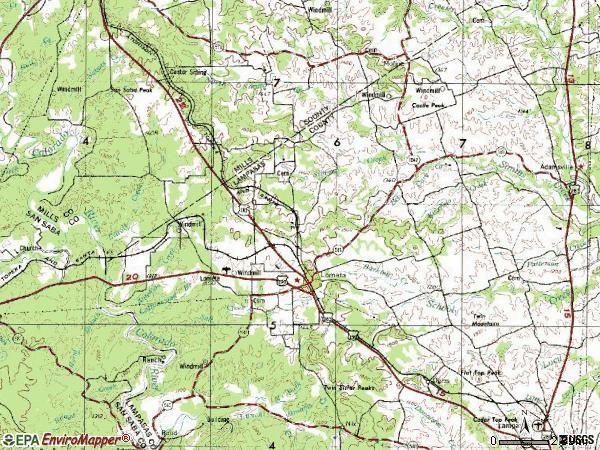
Notable locations in zip code 76853: Long Cove (A), Star Camp (B), Antelope Gap (C), Lometa Volunteer Fire and Rescue Department (D). Display/hide their locations on the map
Lakes and reservoirs: Indian Water Hole (A), Glory Hole (B), Lometa Reservoir (C), Santa Fe Lake (D), Sand Tank (E). Display/hide their locations on the map
Streams, rivers, and creeks: Boggy Creek (A), Bee Cave Creek (B), Antelope Creek (C), South Turkey Creek (D), Russell Branch (E), Payne Branch (F), North Turkey Creek (G), North Simms Creek (H), McAnelly Creek (I). Display/hide their locations on the map
In group quarters: 35 (-1 institutionalized population)
Size of family households: 166 2-persons, 118 3-persons, 100 4-persons, 11 5-persons, 21 6-persons
Size of nonfamily households: 135 1-person, 29 2-persons
185 married couples with children.
61 single-parent households (34 men, 27 women).
88.6% of residents of 76853 zip code speak English at home.
7.6% of residents speak Spanish at home (63% very well, 19% well, 15% not well, 2% not at all).
1.5% of residents speak other Indo-European language at home (100% very well).
2.7% of residents speak Asian or Pacific Island language at home (100% very well).
Foreign born population: 75 (4.5%) (68.5% of them are naturalized citizens)
This zip code:
4.5%
Whole state:
17.2%
45%Burma (Myanmar)
36%Honduras
14%France
8%Belgium
1%El Salvador
21%English
11%American
9%German
6%Irish
2%Swiss
2%Italian
2%French
Year of entry for the foreign-born population
12010 or later
02000 to 2009
21990 to 1999
80Before 1990
Housing units lacking complete plumbing facilities: 11.6% Housing units lacking complete kitchen facilities: 9.7%
63.2%Electricity
17.7%Utility gas
16.4%Bottled, tank, or LP gas
3.1%Wood
Population in 1990: 1,215. Population change in the 1990s: +312 (+25.7%).
Place of birth for U.S.-born residents:
This state: 1,362
Northeast: 15
Midwest: 60
South: 74
West: 62
57% of the 76853 zip code residents lived in the same house 5 years ago. Out of people who lived in different houses, 53% lived in this county. Out of people who lived in different counties, 50% lived in Texas.
86% of the 76853 zip code residents lived in the same house 1 year ago. Out of people who lived in different houses, 17% moved from this county. Out of people who lived in different houses, 76% moved from different county within same state. Out of people who lived in different houses, 10% moved from different state.
Private vs. public school enrollment:
Students in private schools in grades 1 to 8 (elementary and middle school): 39
Here:
35.8%
Texas:
8.8%
Students in private schools in grades 9 to 12 (high school): 13
Here:
10.7%
Texas:
8.0%
Students in private undergraduate colleges: 18
Here:
23.8%
Texas:
16.2%
Occupation by median earnings in the past 12 months ($)
125,662Business and financial operations occupations
86,903Community and social service occupations
48,435Management occupations
46,626Education, training, and library occupations
37,721Construction and extraction occupations
34,842Production occupations
Companies with federal contracts located in this zip code:
STALEY, LETICIA GAY (400 W MAIN ST in LOMETA, TX; small business)
$46,155 with Department of Defense for Live Animals, Not Raised for Food. Signed on 2005-08-02. Completion date: 2005-08-23.
Top industries in this zip code by the number of employees in 2005:
Educational Services: Elementary and Secondary Schools (50-99 employees: 1 establishment)
Health Care and Social Assistance: Other Residential Care Facilities (20-49: 1)
Mining: Dimension Stone Mining and Quarrying (20-49: 1)
Educational Services: Educational Support Services (10-19: 1)
Finance and Insurance: Commercial Banking (5-9: 1, 1-4: 1)
Other Services (except Public Administration): Religious Organizations (5-9: 1, 1-4: 1)
People in group quarters in 2010:
28 people in residential treatment centers for juveniles (non-correctional)
People in group quarters in 2000:
25 people in homes for abused, dependent, and neglected children
25 people in other noninstitutional group quarters
Fatal accident statistics in 2012:
Fatal accident count: 1
Vehicles involved in fatal accidents: 1
Fatal accidents caused by drunken drivers: 0
Fatalities: 1
Persons involved in fatal accidents: 1
Pedestrians involved in fatal accidents: 0
Fatal accident statistics in 2011:
Fatal accident count: 1
Vehicles involved in fatal accidents: 1
Fatal accidents caused by drunken drivers: 0
Fatalities: 1
Persons involved in fatal accidents: 1
Pedestrians involved in fatal accidents: 0
2002 - 2018 National Fire Incident Reporting System (NFIRS) incidents
Based on the data from the years 2002 - 2018 the average number of fire incidents per year is 9. The highest number of fire incidents - 48 took place in 2018, and the least - 1 in 2013. The data has an increasing trend.
When looking into fire subcategories, the most reports belonged to: Outside Fires (64.1%), and Structure Fires (26.3%).
Fire incident types reported to NFIRS in Zip Code 76853

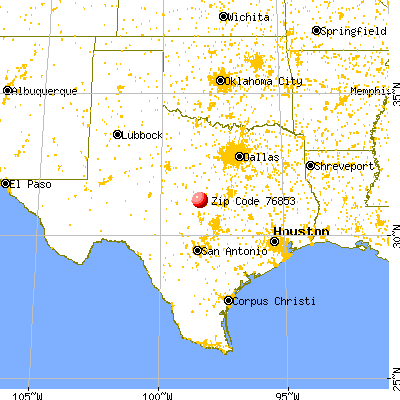


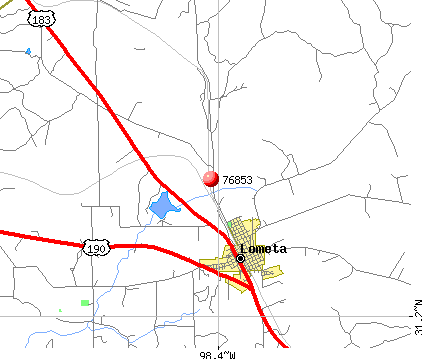 Nearest zip codes: 76550, 76844, 76525, 76824, 76565, 76870.


 Based on the data from the years 2002 - 2018 the average number of fire incidents per year is 9. The highest number of fire incidents - 48 took place in 2018, and the least - 1 in 2013. The data has an increasing trend.
 When looking into fire subcategories, the most reports belonged to: Outside Fires (64.1%), and Structure Fires (26.3%).