Estimated zip code population in 2022: 3,600 Zip code population in 2010: 3,582 Zip code population in 2000: 3,433
Houses and condos: 1,942 Renter-occupied apartments: 276
% of renters here:
20%
State:
38%
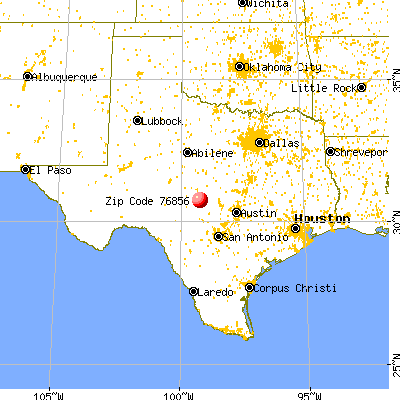
March 2022 cost of living index in zip code 76856: 79.6 (low, U.S. average is 100)
Land area: 711.2 sq. mi. Water area: 2.9 sq. mi.
Population density: 5 people per square mile
(very low).
OSM Map
General Map
Google Map
MSN Map
OSM Map
General Map
Google Map
MSN Map
OSM Map
General Map
Google Map
MSN Map
OSM Map
General Map
Google Map
MSN Map
Please wait while loading the map...
Real estate property taxes paid for housing units in 2022:
This zip code:
0.7% ($2,028)
Texas:
1.5% ($4,050)
Median real estate property taxes paid for housing units with mortgages in 2022: $3,289 (1.1%) Median real estate property taxes paid for housing units with no mortgage in 2022: $1,749 (0.7%)
Business Search- 14 Million verified businesses
Males: 1,783
(49.5%)
Females: 1,817
(50.5%)
For population 25 years and over in 76856:
High school or higher: 84.9%
Bachelor's degree or higher: 40.4%
Graduate or professional degree: 11.8%
Unemployed: 2.4%
Mean travel time to work (commute): 26.7 minutes
For population 15 years and over in 76856:
Never married: 21.1%
Now married: 65.3%
Separated: 0.5%
Widowed: 6.0%
Divorced: 7.2%
Zip code 76856 compared to state average:
Unemployed percentage below state average.
Black race population percentage significantly below state average.
Hispanic race population percentage below state average.
Median age significantly above state average.
Foreign-born population percentage significantly below state average.
Renting percentage below state average.
Length of stay since moving in significantly above state average.
Estimated median house/condo value in 2022: $277,251
76856:
$277,251
Texas:
$275,400
According to our research of Texas and other state lists, there were 7 registered sex offenders living in 76856 zip code as of May 28, 2024. The ratio of all residents to sex offenders in zip code 76856 is 523 to 1. The ratio of registered sex offenders to all residents in this zip code is near the state average.
Median resident age:
This zip code:
44.0 years
Texas median age:
35.6 years
Average household size:
This zip code:
2.7 people
Texas:
2.6 people
Averages for the 2020 tax year for zip code 76856, filed in 2021:
Average Adjusted Gross Income (AGI) in 2020: $66,263 (Individual Income Tax Returns)
Here:
$66,263
State:
$77,054
Salary/wage: $48,494 (reported on 66.1% of returns)
Here:
$48,494
State:
$62,766
(% of AGI for various income ranges: 1353.9% for AGIs below $25k, 3925.6% for AGIs $25k-50k, 6621.3% for AGIs $50k-75k, 10828.6% for AGIs $75k-100k, 13220.0% for AGIs $100k-200k)
Taxable interest for individuals: $2,304 (reported on 37.7% of returns)
This zip code:
$2,304
Texas:
$2,665
(% of AGI for various income ranges: 31.9% for AGIs below $25k, 59.2% for AGIs $25k-50k, 136.0% for AGIs $50k-75k, 174.3% for AGIs $75k-100k, 244.6% for AGIs $100k-200k)
Ordinary dividends: $8,492 (reported on 20.2% of returns)
Here:
$8,492
State:
$10,044
(% of AGI for various income ranges: 47.8% for AGIs below $25k, 85.6% for AGIs $25k-50k, 125.3% for AGIs $50k-75k, 410.0% for AGIs $75k-100k, 896.2% for AGIs $100k-200k)
Net capital gain/loss in AGI: +$38,583 (reported on 22.4% of returns)
Here:
+$38,583
State:
+$39,590
(% of AGI for various income ranges: 56.9% for AGIs below $25k, 54.0% for AGIs $25k-50k, 353.3% for AGIs $50k-75k, 472.9% for AGIs $75k-100k, 1968.5% for AGIs $100k-200k)
Profit/loss from business: +$12,304 (reported on 30.1% of returns)
Here:
+$12,304
State:
+$10,888
(% of AGI for various income ranges: 365.6% for AGIs below $25k, 577.2% for AGIs $25k-50k, 320.0% for AGIs $50k-75k, 882.9% for AGIs $75k-100k, 1219.2% for AGIs $100k-200k)
Taxable individual retirement arrangement distribution: $20,382 (reported on 9.3% of returns)
76856:
$20,382
Texas:
$24,740
(% of AGI for various income ranges: 57.5% for AGIs below $25k, 128.8% for AGIs $25k-50k, 532.7% for AGIs $50k-75k, 1643.8% for AGIs $100k-200k)
Total itemized deductions: $40,055 (reported on 6.0% of returns)
Here:
$40,055
State:
$40,428
(% of AGI for various income ranges: 1003.3% for AGIs $50k-75k, 988.5% for AGIs $100k-200k)
Charity contributions: $20,450 (reported on 4.4% of returns)
Here:
$20,450
State:
$18,201
(% of AGI for various income ranges: 209.3% for AGIs $50k-75k, 303.1% for AGIs $100k-200k)
Taxes paid: $5,955 (reported on 6.0% of returns)
76856:
$5,955
State:
$7,821
(% of AGI for various income ranges: 129.3% for AGIs $50k-75k, 194.6% for AGIs $100k-200k)
Earned income credit: $2,268 (reported on 16.9% of returns)
Here:
$2,268
State:
$2,584
(% of AGI for various income ranges: 132.2% for AGIs below $25k, 90.8% for AGIs $25k-50k)
Percentage of individuals using paid preparers for their 2020 taxes: 85.8%
Here:
86%
State:
92%
(% for various income ranges: 87.3% for AGIs below $25k, 87.5% for AGIs $25k-50k, 84.0% for AGIs $50k-75k, 85.7% for AGIs $75k-100k, 83.3% for AGIs $100k-200k, 77.8% for AGIs over 200k)
Averages for the 2012 tax year for zip code 76856, filed in 2013:
Average Adjusted Gross Income (AGI) in 2012: $50,883 (Individual Income Tax Returns)
Here:
$50,883
State:
$65,384
Salary/wage: $34,916 (reported on 71.6% of returns)
Here:
$34,916
State:
$52,524
(% of AGI for various income ranges: 66.5% for AGIs below $25k, 66.5% for AGIs $25k-50k, 70.3% for AGIs $50k-75k, 59.1% for AGIs $75k-100k, 46.2% for AGIs $100k-200k, 14.1% for AGIs over 200k)
Taxable interest for individuals: $2,946 (reported on 33.3% of returns)
This zip code:
$2,946
Texas:
$2,372
(% of AGI for various income ranges: 2.3% for AGIs below $25k, 1.3% for AGIs $25k-50k, 1.0% for AGIs $50k-75k, 2.3% for AGIs $75k-100k, 2.6% for AGIs $100k-200k, 2.1% for AGIs over 200k)
Ordinary dividends: $5,327 (reported on 18.5% of returns)
Here:
$5,327
State:
$9,721
(% of AGI for various income ranges: 2.3% for AGIs below $25k, 1.3% for AGIs $25k-50k, 1.1% for AGIs $50k-75k, 1.3% for AGIs $75k-100k, 3.4% for AGIs $100k-200k, 2.0% for AGIs over 200k)
Net capital gain/loss in AGI: +$24,273 (reported on 22.8% of returns)
Here:
+$24,273
State:
+$35,319
(% of AGI for various income ranges: 2.0% for AGIs below $25k, 1.1% for AGIs $25k-50k, 3.1% for AGIs $50k-75k, 5.2% for AGIs $75k-100k, 10.4% for AGIs $100k-200k, 29.5% for AGIs over 200k)
Profit/loss from business: +$14,133 (reported on 29.6% of returns)
Here:
+$14,133
State:
+$13,732
(% of AGI for various income ranges: 16.1% for AGIs below $25k, 6.7% for AGIs $25k-50k, 5.0% for AGIs $50k-75k, 6.3% for AGIs $75k-100k, 5.3% for AGIs $100k-200k, 11.5% for AGIs over 200k)
Taxable individual retirement arrangement distribution: $19,518 (reported on 10.5% of returns)
76856:
$19,518
Texas:
$19,511
(% of AGI for various income ranges: 2.4% for AGIs below $25k, 3.0% for AGIs $25k-50k, 2.0% for AGIs $50k-75k, 4.8% for AGIs $75k-100k, 12.0% for AGIs $100k-200k)
Total itemized deductions: $24,359 (22% of AGI, reported on 19.8% of returns)
Here:
$24,359
State:
$24,724
Here:
21.7% of AGI
State:
15.9% of AGI
(% of AGI for various income ranges: 9.1% for AGIs below $25k, 8.3% for AGIs $25k-50k, 8.5% for AGIs $50k-75k, 9.0% for AGIs $75k-100k, 11.8% for AGIs $100k-200k, 9.5% for AGIs over 200k)
Charity contributions: $9,236 (reported on 15.4% of returns)
Here:
$9,236
State:
$6,808
(% of AGI for various income ranges: 1.0% for AGIs below $25k, 1.7% for AGIs $25k-50k, 1.6% for AGIs $50k-75k, 1.8% for AGIs $75k-100k, 2.9% for AGIs $100k-200k, 5.5% for AGIs over 200k)
Taxes paid: $5,952 (reported on 19.1% of returns)
76856:
$5,952
State:
$6,921
(% of AGI for various income ranges: 1.6% for AGIs below $25k, 1.5% for AGIs $25k-50k, 1.8% for AGIs $50k-75k, 1.9% for AGIs $75k-100k, 3.4% for AGIs $100k-200k, 2.5% for AGIs over 200k)
Earned income credit: $2,219 (reported on 22.2% of returns)
Here:
$2,219
State:
$2,570
(% of AGI for various income ranges: 7.3% for AGIs below $25k, 1.4% for AGIs $25k-50k)
Percentage of individuals using paid preparers for their 2012 taxes: 69.8%
Here:
70%
State:
51%
(% for various income ranges: 63.0% for AGIs below $25k, 71.1% for AGIs $25k-50k, 76.2% for AGIs $50k-75k, 76.9% for AGIs $75k-100k, 83.3% for AGIs $100k-200k, 80.0% for AGIs over 200k)
Averages for the 2004 tax year for zip code 76856, filed in 2005:
Average Adjusted Gross Income (AGI) in 2004: $33,826 (Individual Income Tax Returns)
Here:
$33,826
State:
$47,881
Salary/wage: $25,520 (reported on 69.9% of returns)
Here:
$25,520
State:
$41,947
(% of AGI for various income ranges: 66.5% for AGIs $10k-25k, 73.5% for AGIs $25k-50k, 60.8% for AGIs $50k-75k, 49.2% for AGIs $75k-100k, 15.6% for AGIs over 100k)
Taxable interest for individuals: $2,825 (reported on 48.9% of returns)
This zip code:
$2,825
Texas:
$2,255
(% of AGI for various income ranges: 4.5% for AGIs $10k-25k, 3.0% for AGIs $25k-50k, 3.1% for AGIs $50k-75k, 4.4% for AGIs $75k-100k, 3.6% for AGIs over 100k)
Taxable dividends: $2,507 (reported on 22.6% of returns)
Here:
$2,507
State:
$4,261
(% of AGI for various income ranges: 1.3% for AGIs $10k-25k, 1.0% for AGIs $25k-50k, 1.4% for AGIs $50k-75k, 3.4% for AGIs $75k-100k, 1.5% for AGIs over 100k)
Net capital gain/loss: +$25,860 (reported on 26.8% of returns)
Here:
+$25,860
State:
+$16,110
(% of AGI for various income ranges: 2.4% for AGIs $10k-25k, 2.2% for AGIs $25k-50k, 8.0% for AGIs $50k-75k, 8.1% for AGIs $75k-100k, 52.2% for AGIs over 100k)
Profit/loss from business: +$9,171 (reported on 31.5% of returns)
Here:
+$9,171
State:
+$11,013
(% of AGI for various income ranges: 15.4% for AGIs $10k-25k, 5.5% for AGIs $25k-50k, 6.8% for AGIs $50k-75k, 7.9% for AGIs $75k-100k, 8.5% for AGIs over 100k)
IRA payment deduction: $3,214 (reported on 1.8% of returns)
76856:
$3,214
Texas:
$3,120
Total itemized deductions: $17,228 (27% of AGI, reported on 16.7% of returns)
Here:
$17,228
State:
$19,631
Here:
26.5% of AGI
State:
18.9% of AGI
(% of AGI for various income ranges: 9.7% for AGIs $10k-25k, 8.5% for AGIs $25k-50k, 9.0% for AGIs $50k-75k, 9.3% for AGIs $75k-100k, 4.9% for AGIs over 100k)
Charity contributions deductions: $4,304 (6% of AGI, reported on 14.1% of returns)
Here:
$4,304
State:
$4,753
Here:
6.2% of AGI
State:
4.2% of AGI
(% of AGI for various income ranges: 1.3% for AGIs $10k-25k, 1.2% for AGIs $25k-50k, 2.0% for AGIs $50k-75k, 3.1% for AGIs $75k-100k, 1.5% for AGIs over 100k)
Total tax: $5,245 (reported on 69.2% of returns)
76856:
$5,245
State:
$9,058
(% of AGI for various income ranges: 4.6% for AGIs $10k-25k, 6.1% for AGIs $25k-50k, 9.3% for AGIs $50k-75k, 11.3% for AGIs $75k-100k, 16.3% for AGIs over 100k)
Earned income credit: $1,796 (reported on 20.9% of returns)
Here:
$1,796
State:
$2,024
Percentage of individuals using paid preparers for their 2004 taxes: 74.4%
Here:
74%
State:
57%
(% for various income ranges: 72.7% for AGIs below $10k, 74.4% for AGIs $10k-25k, 71.4% for AGIs $25k-50k, 78.5% for AGIs $50k-75k, 73.6% for AGIs $75k-100k, 90.8% for AGIs over 100k)
Likely homosexual households (counted as self-reported same-sex unmarried-partner households)
Lesbian couples: 0.0% of all households
Gay men: 0.6% of all households
Household received Food Stamps/SNAP in the past 12 months: 107 Household did not receive Food Stamps/SNAP in the past 12 months: 1,241
Women who did not have a birth in the past 12 months: 697 (363 now married, 332 unmarried)
Housing units in zip code 76856 with a mortgage: 384 (41 second mortgage) Median monthly owner costs for units with a mortgage: $1,530 Median monthly owner costs for units without a mortgage: $598
Residents with income below the poverty level in 2022:
This zip code:
3.7%
Whole state:
14.0%
Residents with income below 50% of the poverty level in 2022:
This zip code:
2.9%
Whole state:
7.4%
Median number of rooms in houses and condos:
Here:
5.8
State:
6.3
Median number of rooms in apartments:
Here:
4.4
State:
4.0
Notable locations in this zip code not listed on our city pages
Notable locations in zip code 76856: Long Mountain Community Center (A), Ranch Branch (B), Mason Historic District (C), Block House Ranch (D), Blue Mountain Community Hall (E), Camp Air (F), Heinrich and Fredericka Hasse House (G), Mason Volunteer Fire Department (H), Mason County Museum (I), Mason Ambulance Service (J), Reynolds-Seaquist House (K). Display/hide their locations on the map
Cemeteries: Polk Cemetery (1), Behrens Cemetery (2), Martin Cemetery (3), West Art Cemetery (4), Crosby Cemetery (5), Lower Willow Cemetery (6), Ellison Cemetery (7). Display/hide their locations on the map
Streams, rivers, and creeks: Brockman Creek (A), Birdsong Creek (B), Big Bluff Creek (C), Beaver Creek (D), Bast Creek (E), Bader Creek (F), Turtle Creek (G), Twelvemile Creek (H), West Ranch Branch (I). Display/hide their locations on the map
In group quarters: 9 (-1 institutionalized population)
Size of family households: 509 2-persons, 156 3-persons, 179 4-persons, 125 5-persons, 30 6-persons
Size of nonfamily households: 345 1-person
795 married couples with children.
53 single-parent households (53 women).
83.8% of residents of 76856 zip code speak English at home.
15.3% of residents speak Spanish at home (52% very well, 25% well, 22% not well, 1% not at all).
1.6% of residents speak other Indo-European language at home (54% very well, 35% well, 12% not well).
Foreign born population: 72 (2.0%) (42.6% of them are naturalized citizens)
This zip code:
2.0%
Whole state:
17.2%
82%Honduras
10%India
1%Guatemala
38%German
14%English
11%American
9%Irish
4%Scottish
1%European
1%Iranian
Year of entry for the foreign-born population
62010 or later
562000 to 2009
61990 to 1999
11Before 1990
Housing units lacking complete plumbing facilities: 5.3% Housing units lacking complete kitchen facilities: 6.6%
62.5%Electricity
31.3%Bottled, tank, or LP gas
4.2%Utility gas
1.7%Wood
Population in 1990: 3,182. Population change in the 1990s: +251 (+7.9%).
Place of birth for U.S.-born residents:
This state: 2,892
Northeast: 41
Midwest: 181
South: 103
West: 276
64% of the 76856 zip code residents lived in the same house 5 years ago. Out of people who lived in different houses, 38% lived in this county. Out of people who lived in different counties, 50% lived in Texas.
91% of the 76856 zip code residents lived in the same house 1 year ago. Out of people who lived in different houses, 14% moved from this county. Out of people who lived in different houses, 78% moved from different county within same state. Out of people who lived in different houses, 12% moved from different state. Out of people who lived in different houses, 0% moved from abroad.
Private vs. public school enrollment:
Students in private schools in grades 1 to 8 (elementary and middle school): 15
Here:
4.4%
Texas:
8.8%
Students in private schools in grades 9 to 12 (high school):
Here:
0.0%
Texas:
8.0%
Students in private undergraduate colleges:
Here:
0.0%
Texas:
16.2%
Occupation by median earnings in the past 12 months ($)
86,873Business and financial operations occupations
80,654Management occupations
53,669Education, training, and library occupations
50,070Health diagnosing and treating practitioners and other technical occupations
39,073Construction and extraction occupations
36,948Office and administrative support occupations
Top industries in this zip code by the number of employees in 2005:
Health Care and Social Assistance: Home Health Care Services (50-99 employees: 1 establishment, 5-9 employees: 1 establishment)


 Nearest zip codes: 76820, 78618, 76854, 76842, 76848, 76887.