Estimated zip code population in 2022: 12,883 Zip code population in 2010: 10,258 Zip code population in 2000: 10,984
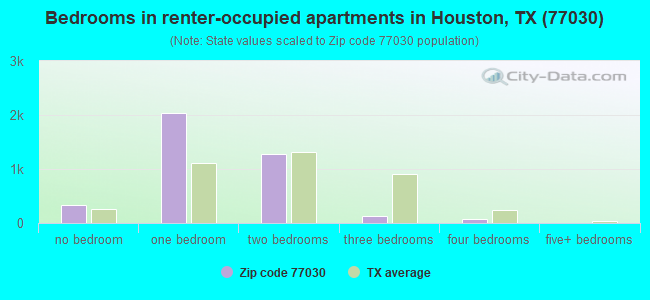
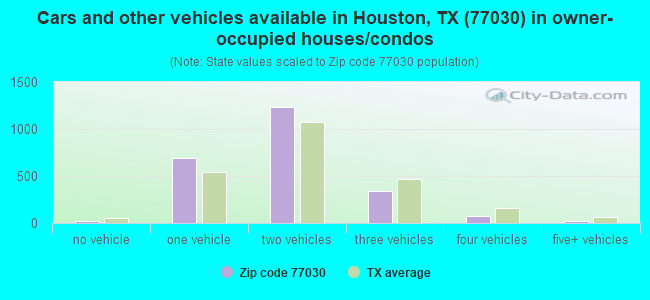
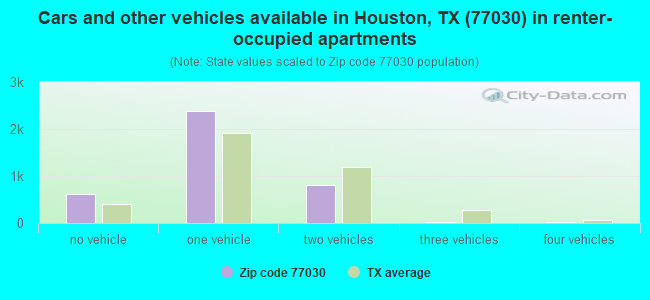
Houses and condos: 7,589 Renter-occupied apartments: 3,841
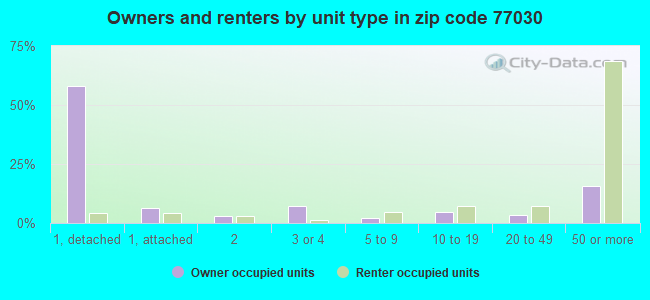
% of renters here:
62%
State:
38%
March 2022 cost of living index in zip code 77030: 104.2 (near average, U.S. average is 100)
Land area: 2.5 sq. mi. Water area: 0.0 sq. mi.
Population density: 5,106 people per square mile
(average).
OSM Map
General Map
Google Map
MSN Map
OSM Map
General Map
Google Map
MSN Map
OSM Map
General Map
Google Map
MSN Map
OSM Map
General Map
Google Map
MSN Map
Please wait while loading the map...
Real estate property taxes paid for housing units in 2022:
This zip code:
1.2% ($10,460)
Texas:
1.5% ($4,050)
Median real estate property taxes paid for housing units with mortgages in 2022: $10,505 (1.1%) Median real estate property taxes paid for housing units with no mortgage in 2022: $9,953 (1.4%)
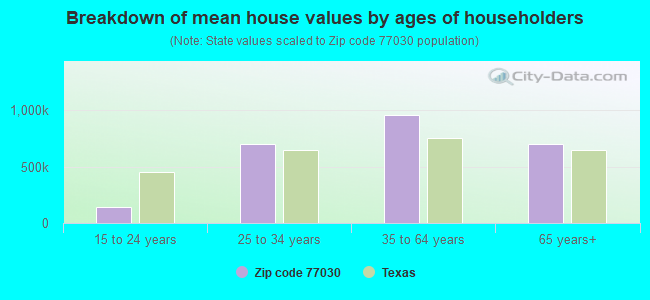
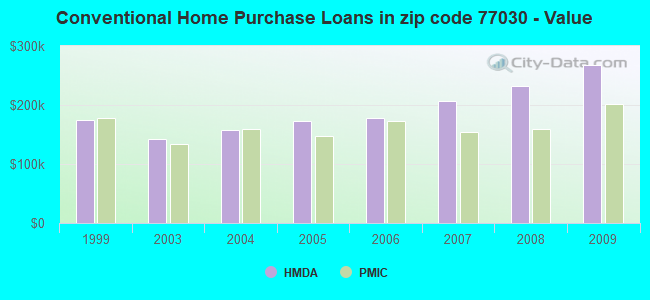
Estimated median house/condo value in 2022: $856,980
77030:
$856,980
Texas:
$275,400
According to our research of Texas and other state lists, there were 9 registered sex offenders living in 77030 zip code as of May 17, 2024. The ratio of all residents to sex offenders in zip code 77030 is 1,210 to 1. The ratio of registered sex offenders to all residents in this zip code is much lower than the state average.
Median resident age:
This zip code:
33.4 years
Texas median age:
35.6 years
Average household size:
This zip code:
2.0 people
Texas:
2.6 people
Averages for the 2020 tax year for zip code 77030, filed in 2021:
Average Adjusted Gross Income (AGI) in 2020: $181,200 (Individual Income Tax Returns)
Here:
$181,200
State:
$77,054
Salary/wage: $133,275 (reported on 85.9% of returns)
Here:
$133,275
State:
$62,766
(% of AGI for various income ranges: 1160.0% for AGIs below $25k, 3748.3% for AGIs $25k-50k, 6717.3% for AGIs $50k-75k, 10557.6% for AGIs $75k-100k, 18738.8% for AGIs $100k-200k, 101399.8% for AGIs over 200k)
Taxable interest for individuals: $4,219 (reported on 43.8% of returns)
This zip code:
$4,219
Texas:
$2,665
(% of AGI for various income ranges: 32.2% for AGIs below $25k, 26.9% for AGIs $25k-50k, 31.7% for AGIs $50k-75k, 117.6% for AGIs $75k-100k, 202.5% for AGIs $100k-200k, 1985.9% for AGIs over 200k)
Ordinary dividends: $17,613 (reported on 39.3% of returns)
Here:
$17,613
State:
$10,044
(% of AGI for various income ranges: 55.3% for AGIs below $25k, 77.6% for AGIs $25k-50k, 129.2% for AGIs $50k-75k, 303.3% for AGIs $75k-100k, 813.5% for AGIs $100k-200k, 7626.8% for AGIs over 200k)
Net capital gain/loss in AGI: +$57,874 (reported on 36.6% of returns)
Here:
+$57,874
State:
+$39,590
(% of AGI for various income ranges: 33.9% for AGIs below $25k, 45.6% for AGIs $25k-50k, 89.3% for AGIs $50k-75k, 346.1% for AGIs $75k-100k, 976.9% for AGIs $100k-200k, 26771.2% for AGIs over 200k)
Profit/loss from business: +$22,582 (reported on 19.9% of returns)
Here:
+$22,582
State:
+$10,888
(% of AGI for various income ranges: 73.4% for AGIs below $25k, 65.6% for AGIs $25k-50k, 94.1% for AGIs $50k-75k, 151.8% for AGIs $75k-100k, 1000.0% for AGIs $100k-200k, 4323.4% for AGIs over 200k)
Taxable individual retirement arrangement distribution: $40,167 (reported on 8.3% of returns)
77030:
$40,167
Texas:
$24,740
(% of AGI for various income ranges: 32.4% for AGIs below $25k, 82.7% for AGIs $25k-50k, 170.5% for AGIs $50k-75k, 343.6% for AGIs $75k-100k, 1004.2% for AGIs $100k-200k, 2510.5% for AGIs over 200k)
Self-employed (Keogh) retirement plans: $36,062 (reported on 2.4% of returns)
77030:
$36,062
Texas:
$29,298
(% of AGI for various income ranges: 1143.4% for AGIs over 200k)
Total itemized deductions: $44,505 (reported on 16.5% of returns)
Here:
$44,505
State:
$40,428
(% of AGI for various income ranges: 126.9% for AGIs below $25k, 94.0% for AGIs $25k-50k, 243.9% for AGIs $50k-75k, 442.1% for AGIs $75k-100k, 1284.6% for AGIs $100k-200k, 7146.1% for AGIs over 200k)
Charity contributions: $17,995 (reported on 14.3% of returns)
Here:
$17,995
State:
$18,201
(% of AGI for various income ranges: 24.8% for AGIs $25k-50k, 71.9% for AGIs $50k-75k, 73.0% for AGIs $75k-100k, 410.8% for AGIs $100k-200k, 2744.1% for AGIs over 200k)
Taxes paid: $8,825 (reported on 16.5% of returns)
77030:
$8,825
State:
$7,821
(% of AGI for various income ranges: 16.2% for AGIs below $25k, 20.5% for AGIs $25k-50k, 51.5% for AGIs $50k-75k, 81.8% for AGIs $75k-100k, 297.3% for AGIs $100k-200k, 1378.5% for AGIs over 200k)
Earned income credit: $1,462 (reported on 5.3% of returns)
Here:
$1,462
State:
$2,584
(% of AGI for various income ranges: 40.9% for AGIs below $25k, 14.1% for AGIs $25k-50k)
Percentage of individuals using paid preparers for their 2020 taxes: 91.3%
Here:
91%
State:
92%
(% for various income ranges: 90.5% for AGIs below $25k, 91.3% for AGIs $25k-50k, 93.6% for AGIs $50k-75k, 89.6% for AGIs $75k-100k, 88.5% for AGIs $100k-200k, 93.0% for AGIs over 200k)
Averages for the 2012 tax year for zip code 77030, filed in 2013:
Average Adjusted Gross Income (AGI) in 2012: $151,811 (Individual Income Tax Returns)
Here:
$151,811
State:
$65,384
Salary/wage: $120,991 (reported on 86.3% of returns)
Here:
$120,991
State:
$52,524
(% of AGI for various income ranges: 84.8% for AGIs below $25k, 88.3% for AGIs $25k-50k, 84.6% for AGIs $50k-75k, 82.5% for AGIs $75k-100k, 76.1% for AGIs $100k-200k, 62.9% for AGIs over 200k)
Taxable interest for individuals: $2,701 (reported on 49.2% of returns)
This zip code:
$2,701
Texas:
$2,372
(% of AGI for various income ranges: 2.0% for AGIs below $25k, 0.7% for AGIs $25k-50k, 0.7% for AGIs $50k-75k, 0.5% for AGIs $75k-100k, 1.0% for AGIs $100k-200k, 0.9% for AGIs over 200k)
Ordinary dividends: $12,491 (reported on 38.6% of returns)
Here:
$12,491
State:
$9,721
(% of AGI for various income ranges: 5.7% for AGIs below $25k, 2.0% for AGIs $25k-50k, 1.7% for AGIs $50k-75k, 2.2% for AGIs $75k-100k, 3.3% for AGIs $100k-200k, 3.4% for AGIs over 200k)
Net capital gain/loss in AGI: +$25,456 (reported on 33.9% of returns)
Here:
+$25,456
State:
+$35,319
(% of AGI for various income ranges: 0.2% for AGIs below $25k, 0.5% for AGIs $25k-50k, 0.3% for AGIs $50k-75k, 0.4% for AGIs $75k-100k, 1.5% for AGIs $100k-200k, 8.0% for AGIs over 200k)
Profit/loss from business: +$37,120 (reported on 19.4% of returns)
Here:
+$37,120
State:
+$13,732
(% of AGI for various income ranges: 6.7% for AGIs below $25k, 3.2% for AGIs $25k-50k, 3.4% for AGIs $50k-75k, 3.9% for AGIs $75k-100k, 5.3% for AGIs $100k-200k, 4.9% for AGIs over 200k)
Taxable individual retirement arrangement distribution: $28,252 (reported on 9.8% of returns)
77030:
$28,252
Texas:
$19,511
(% of AGI for various income ranges: 1.5% for AGIs below $25k, 1.3% for AGIs $25k-50k, 1.8% for AGIs $50k-75k, 2.2% for AGIs $75k-100k, 3.9% for AGIs $100k-200k, 1.4% for AGIs over 200k)
Self-employment retirement plans: $29,407 (reported on 2.7% of returns)
77030:
$29,407
Texas:
$23,938
Total itemized deductions: $33,461 (11% of AGI, reported on 37.5% of returns)
Here:
$33,461
State:
$24,724
Here:
11.0% of AGI
State:
15.9% of AGI
(% of AGI for various income ranges: 14.1% for AGIs below $25k, 5.9% for AGIs $25k-50k, 7.5% for AGIs $50k-75k, 8.7% for AGIs $75k-100k, 11.0% for AGIs $100k-200k, 7.7% for AGIs over 200k)
Charity contributions: $8,737 (reported on 31.4% of returns)
Here:
$8,737
State:
$6,808
(% of AGI for various income ranges: 0.9% for AGIs below $25k, 0.5% for AGIs $25k-50k, 1.2% for AGIs $50k-75k, 1.1% for AGIs $75k-100k, 1.7% for AGIs $100k-200k, 2.0% for AGIs over 200k)
Taxes paid: $12,329 (reported on 36.7% of returns)
77030:
$12,329
State:
$6,921
(% of AGI for various income ranges: 3.5% for AGIs below $25k, 1.6% for AGIs $25k-50k, 2.0% for AGIs $50k-75k, 3.1% for AGIs $75k-100k, 4.3% for AGIs $100k-200k, 2.8% for AGIs over 200k)
Earned income credit: $1,182 (reported on 5.5% of returns)
Here:
$1,182
State:
$2,570
(% of AGI for various income ranges: 1.9% for AGIs below $25k, 0.2% for AGIs $25k-50k)
Percentage of individuals using paid preparers for their 2012 taxes: 44.3%
Here:
44%
State:
51%
(% for various income ranges: 38.5% for AGIs below $25k, 31.8% for AGIs $25k-50k, 38.0% for AGIs $50k-75k, 40.0% for AGIs $75k-100k, 48.8% for AGIs $100k-200k, 67.7% for AGIs over 200k)
Averages for the 2004 tax year for zip code 77030, filed in 2005:
Average Adjusted Gross Income (AGI) in 2004: $95,934 (Individual Income Tax Returns)
Here:
$95,934
State:
$47,881
Salary/wage: $82,739 (reported on 83.9% of returns)
Here:
$82,739
State:
$41,947
(% of AGI for various income ranges: 236.1% for AGIs below $10k, 85.2% for AGIs $10k-25k, 90.7% for AGIs $25k-50k, 84.4% for AGIs $50k-75k, 79.5% for AGIs $75k-100k, 67.1% for AGIs over 100k)
Taxable interest for individuals: $2,272 (reported on 54.8% of returns)
This zip code:
$2,272
Texas:
$2,255
(% of AGI for various income ranges: 14.7% for AGIs below $10k, 3.1% for AGIs $10k-25k, 1.1% for AGIs $25k-50k, 1.1% for AGIs $50k-75k, 2.0% for AGIs $75k-100k, 1.2% for AGIs over 100k)
Taxable dividends: $5,920 (reported on 38.1% of returns)
Here:
$5,920
State:
$4,261
(% of AGI for various income ranges: 20.1% for AGIs below $10k, 2.1% for AGIs $10k-25k, 1.3% for AGIs $25k-50k, 1.3% for AGIs $50k-75k, 2.9% for AGIs $75k-100k, 2.5% for AGIs over 100k)
Net capital gain/loss: +$17,544 (reported on 33.5% of returns)
Here:
+$17,544
State:
+$16,110
(% of AGI for various income ranges: -13.0% for AGIs below $10k, 0.4% for AGIs $10k-25k, 0.2% for AGIs $25k-50k, 1.0% for AGIs $50k-75k, 1.4% for AGIs $75k-100k, 8.1% for AGIs over 100k)
Profit/loss from business: +$26,831 (reported on 19.2% of returns)
Here:
+$26,831
State:
+$11,013
(% of AGI for various income ranges: -8.7% for AGIs below $10k, 3.9% for AGIs $10k-25k, 1.8% for AGIs $25k-50k, 4.7% for AGIs $50k-75k, 4.4% for AGIs $75k-100k, 6.1% for AGIs over 100k)
IRA payment deduction: $3,147 (reported on 2.9% of returns)
77030:
$3,147
Texas:
$3,120
(% of AGI for various income ranges: 0.4% for AGIs $10k-25k, 0.2% for AGIs $25k-50k, 0.2% for AGIs $50k-75k, 0.2% for AGIs $75k-100k, 0.0% for AGIs over 100k)
Self-employed pension: $21,126 (reported on 2.9% of returns)
Here:
$21,126
Texas:
$16,401
Total itemized deductions: $24,316 (13% of AGI, reported on 34.7% of returns)
Here:
$24,316
State:
$19,631
Here:
13.2% of AGI
State:
18.9% of AGI
(% of AGI for various income ranges: 22.1% for AGIs below $10k, 9.8% for AGIs $10k-25k, 6.9% for AGIs $25k-50k, 9.4% for AGIs $50k-75k, 12.3% for AGIs $75k-100k, 8.5% for AGIs over 100k)
Charity contributions deductions: $5,316 (3% of AGI, reported on 29.7% of returns)
Here:
$5,316
State:
$4,753
Here:
2.7% of AGI
State:
4.2% of AGI
(% of AGI for various income ranges: 0.8% for AGIs below $10k, 0.7% for AGIs $10k-25k, 1.1% for AGIs $25k-50k, 1.4% for AGIs $50k-75k, 1.9% for AGIs $75k-100k, 1.8% for AGIs over 100k)
Total tax: $23,805 (reported on 82.8% of returns)
77030:
$23,805
State:
$9,058
(% of AGI for various income ranges: 9.3% for AGIs below $10k, 5.3% for AGIs $10k-25k, 9.2% for AGIs $25k-50k, 12.6% for AGIs $50k-75k, 13.6% for AGIs $75k-100k, 24.0% for AGIs over 100k)
Earned income credit: $1,129 (reported on 4.4% of returns)
Here:
$1,129
State:
$2,024
Percentage of individuals using paid preparers for their 2004 taxes: 42.0%
Here:
42%
State:
57%
(% for various income ranges: 34.8% for AGIs below $10k, 32.7% for AGIs $10k-25k, 34.8% for AGIs $25k-50k, 39.7% for AGIs $50k-75k, 46.8% for AGIs $75k-100k, 59.8% for AGIs over 100k)
Likely homosexual households (counted as self-reported same-sex unmarried-partner households)
Lesbian couples: 0.0% of all households
Gay men: 0.7% of all households
Household received Food Stamps/SNAP in the past 12 months: 16 Household did not receive Food Stamps/SNAP in the past 12 months: 6,152
Women who had a birth in the past 12 months: 168 (163 now married, 7 unmarried) Women who did not have a birth in the past 12 months: 3,872 (1,639 now married, 2,235 unmarried)
Housing units in zip code 77030 with a mortgage: 1,111 (48 second mortgage, 52 both second mortgage and home equity loan) Median monthly owner costs for units with a mortgage: $3,721 Median monthly owner costs for units without a mortgage: $1,424
Residents with income below the poverty level in 2022:
This zip code:
9.3%
Whole state:
14.0%
Residents with income below 50% of the poverty level in 2022:
This zip code:
1.8%
Whole state:
7.4%
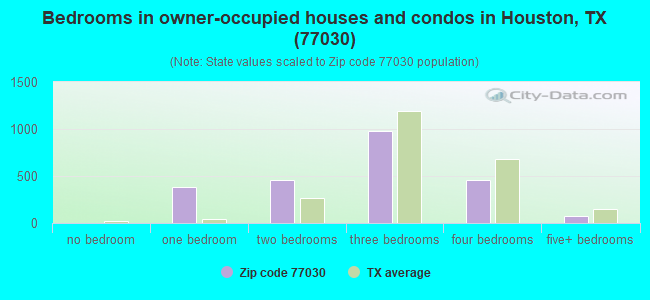
Median number of rooms in houses and condos:
Here:
6.4
State:
6.3
Median number of rooms in apartments:
Here:
3.1
State:
4.0
Notable locations in this zip code not listed on our city pages
Notable locations in zip code 77030: Houston Fire Department / Emergency Medical Services Station 33 (A), Autry House (B). Display/hide their locations on the map
Tourist attractions (not listed on the city page) : Discovery Shop At The Houston Museum Of Natural Science (Cultural Attractions- Events- & Facilities; One Hermann Circle Drive), Daughters of the Republic of Texas Log HSE MSM (Cultural Attractions- Events- & Facilities; 1510 North Macgregor Drive), Houston Zoo Inc (Recreation Areas; 1513 North Macgregor Drive), ABC Charter & Sightseeing (Tours & Charters; 1914 Brunson Street).
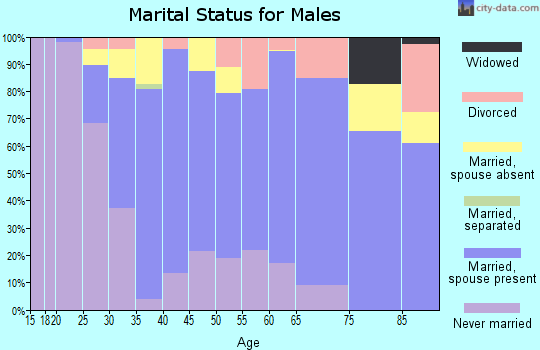
2,064 married couples with children.
179 single-parent households (61 men, 118 women).
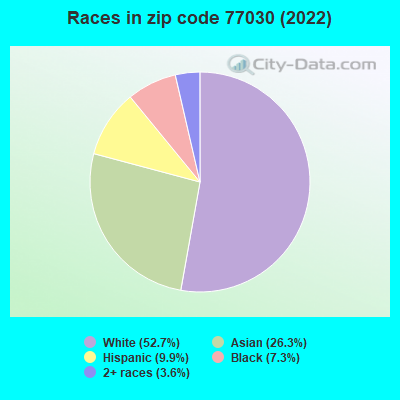
61.7% of residents of 77030 zip code speak English at home.
9.4% of residents speak Spanish at home (82% very well, 16% well, 2% not well).
10.7% of residents speak other Indo-European language at home (86% very well, 11% well, 3% not well).
18.8% of residents speak Asian or Pacific Island language at home (62% very well, 28% well, 10% not well).
0.8% of residents speak other language at home (100% very well).
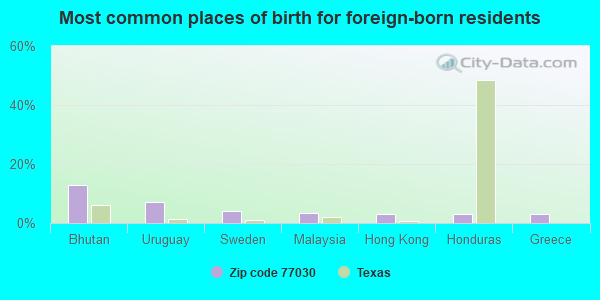
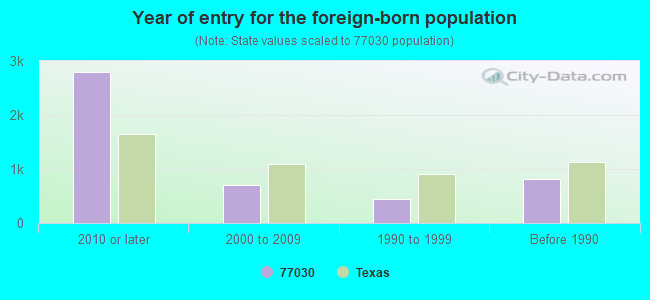
Foreign born population: 4,236 (32.9%) (41.7% of them are naturalized citizens)
Facilities with environmental interests located in this zip code:
AD ART PRINTERS (6636 MAIN in HOUSTON, TX)
(Resource Conservation and Recovery Act (tracking hazardous waste))
Housing units lacking complete kitchen facilities: 0.3%
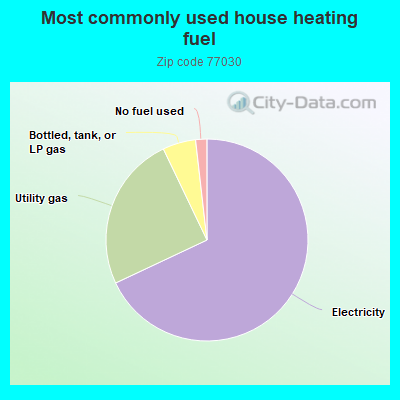
68.0%Electricity
24.9%Utility gas
5.3%Bottled, tank, or LP gas
1.8%No fuel used
Population in 1990: 10,462. Population change in the 1990s: +522 (+5.0%).
Place of birth for U.S.-born residents:
This state: 4,869
Northeast: 593
Midwest: 757
South: 1,533
West: 708
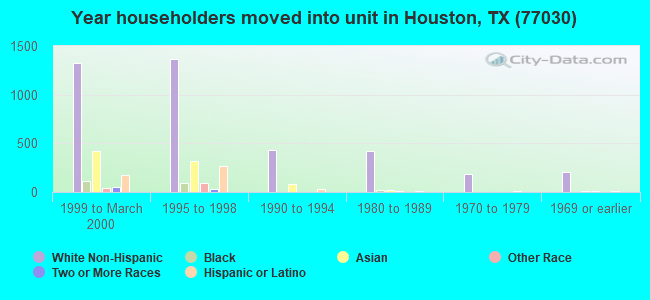
34% of the 77030 zip code residents lived in the same house 5 years ago. Out of people who lived in different houses, 55% lived in this county. Out of people who lived in different counties, 50% lived in Texas.
71% of the 77030 zip code residents lived in the same house 1 year ago. Out of people who lived in different houses, 41% moved from this county. Out of people who lived in different houses, 17% moved from different county within same state. Out of people who lived in different houses, 25% moved from different state. Out of people who lived in different houses, 18% moved from abroad.
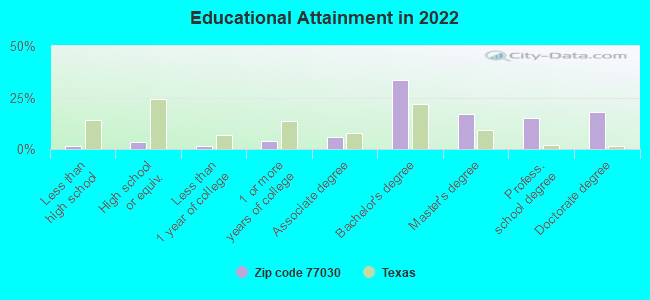
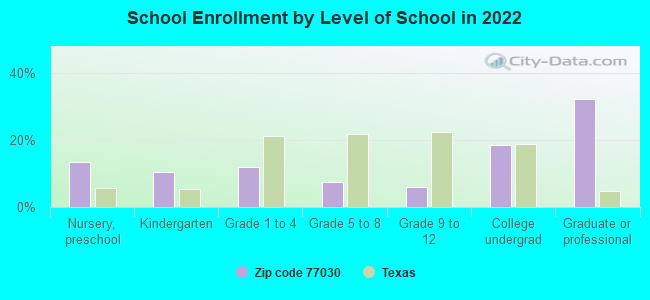
Private vs. public school enrollment:
Students in private schools in grades 1 to 8 (elementary and middle school): 214
Here:
30.0%
Texas:
8.8%
Students in private schools in grades 9 to 12 (high school): 126
Here:
58.4%
Texas:
8.0%
Students in private undergraduate colleges: 278
Here:
41.2%
Texas:
16.2%
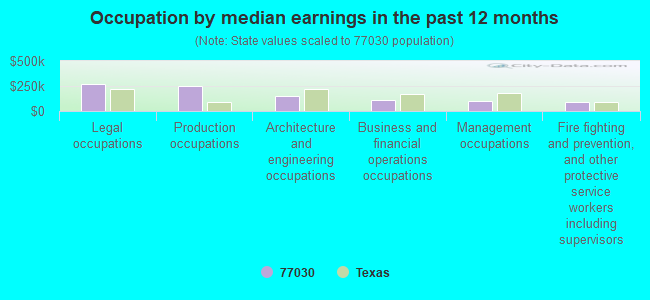
Occupation by median earnings in the past 12 months ($)
268,088Legal occupations
250,361Production occupations
151,722Architecture and engineering occupations
107,441Business and financial operations occupations
102,484Management occupations
91,456Fire fighting and prevention, and other protective service workers including supervisors
Companies with federal contracts located in this zip code (HOUSTON, TX):
UNIVERSITY OF TEXAS HEALTH SCI (7000 FANNIN ST) : $19,949,288 in 130 contractsfrom 1999 to 2006
Contracts for Space Science and Applications -- Basic Research (R&D), Biomedical -- Basic Research (R&D), Biomedical -- Applied Research and Exploratory Development (R&D), Veterinary/Animal Care Services, and moreby NASA, National Institutes of Health, Department of Veterans Affairs, Army, and others Signed by year:2000: $992,221; 2001: $764,960; 2002: $2,204,658; 2003: $3,645,844; 2004: $4,457,134; 2005: $3,550,674; 2006: $4,073,977.
Biggest contracts:
$3,695,926 with NASA for Space Science and Applications -- Basic Research (R&D). Signed on 2006-07-27. Completion date: 2009-08-31.
$3,346,000 with National Institutes of Health for Biomedical -- Basic Research (R&D). Signed on 2004-06-24. Completion date: 2008-03-31.
$1,984,000 with NASA for Space Science and Applications -- Basic Research (R&D). Signed on 2005-09-08. Effective on 2005-09-01. Completion date: 2006-08-31.
$988,000 with National Institutes of Health for Biomedical -- Applied Research and Exploratory Development (R&D). Signed on 2002-09-15. Completion date: 2005-09-15.
HARLEE MEDICAL TECH INC (2144 WATTS RD; small business) : $89,440 in 2 contractsfrom 2003 to 2005
$48,340 with Department of Veterans Affairs for Electrical and Electronic Properties Measuring and Testing Instruments. Signed on 2003-05-15. Completion date: 2003-05-15.
$41,100 with Army for Medical and Surgical Instruments, Equipment, and Supplies. Signed on 2005-09-18. Completion date: 2005-09-30.
BEST WESTERN PLAZA HOTEL & SUITES (6700 SOUTH MAIN STREET) : $61,000 in 2 contractsfrom 2005 to 2006
$35,000 with Department of Veterans Affairs for Lodging - Hotel/Motel. Signed on 2005-12-30. Completion date: 2006-01-09.
$26,000, same as above.Signed on 2006-01-24. Completion date: 2006-02-03.
REV BRUCE NOBLE (2330 DORRINGTON BLVD; small business) : $8,355 in 14 contractsfrom 2002 to 2006
Contracts for Chaplain Services by Army Signed by year:2000: $0; 2001: $0; 2002: $1,920; 2003: $2,720; 2004: $1,795; 2005: $480; 2006: $1,440.
Biggest contracts:
$1,920 with Army for Chaplain Services. Signed on 2004-10-20. Completion date: 2004-10-29.
$1,920, same as above.Signed on 2003-11-03. Completion date: 2004-09-30.
$1,920, same as above.Signed on 2002-10-30. Completion date: 2003-09-30.
$1,440, same as above.Signed on 2006-03-08. Completion date: 2006-11-03.
REVEREND DAVID NOBLE (2330 DORRINGTON BLVD; small business) : $7,360 in 17 contractsfrom 2002 to 2006
Contracts for Chaplain Services by Army Signed by year:2000: $0; 2001: $0; 2002: $1,920; 2003: $2,560; 2004: $1,120; 2005: $480; 2006: $1,280.
Biggest contracts:
$1,920 with Army for Chaplain Services. Signed on 2002-11-01. Completion date: 2003-09-30.
$1,760, same as above.Signed on 2004-10-21. Completion date: 2004-10-28.
$1,760, same as above.Signed on 2003-11-03. Completion date: 2004-09-30.
$1,440, same as above.Signed on 2003-02-28. Completion date: 2003-09-30.
BRE/ESA P OPERATING LESSEE INC (1301 SOUTH BRAESWOOD BLVD; small business)
$5,096 with Navy for Lodging - Hotel/Motel. Signed on 2005-08-09. Completion date: 2005-08-12.
Top industries in this zip code by the number of employees in 2005:
Health Care and Social Assistance: General Medical and Surgical Hospitals (over 1000 employees: 5 establishments, 500-999 employees: 1 establishment, 250-499 employees: 1 establishment, 1-4 employees: 1 establishment)
Health Care and Social Assistance: Offices of Physicians (except Mental Health Specialists) (100-249: 2, 50-99: 5, 20-49: 26, 10-19: 37, 5-9: 68, 1-4: 201)
Health Care and Social Assistance: Specialty (except Psychiatric and Substance Abuse) Hospitals (over 1000: 1, 250-499: 3, 100-249: 1)
Educational Services: Colleges, Universities, and Professional Schools (over 1000: 1, 500-999: 1)
Management of Companies and Enterprises: Corporate, Subsidiary, and Regional Managing Offices (500-999: 1, 100-249: 1, 50-99: 1, 10-19: 1)
Accommodation and Food Services: Hotels (except Casino Hotels) and Motels (100-249: 4, 50-99: 2, 20-49: 1, 10-19: 1, 1-4: 2)
Management of Companies and Enterprises: Offices of Other Holding Companies (500-999: 1, 50-99: 1)
Professional, Scientific, and Technical Services: Administrative Management and General Management Consulting Services (500-999: 1, 10-19: 1, 1-4: 2)
2008 - 2018 National Fire Incident Reporting System (NFIRS) incidents
According to the data from the years 2008 - 2018 the average number of fire incidents per year is 49. The highest number of reported fires - 94 took place in 2011, and the least - 7 in 2008. The data has a rising trend.
When looking into fire subcategories, the most incidents belonged to: Outside Fires (35.3%), and Mobile Property/Vehicle Fires (30.8%).
Fire incident types reported to NFIRS in Zip Code 77030

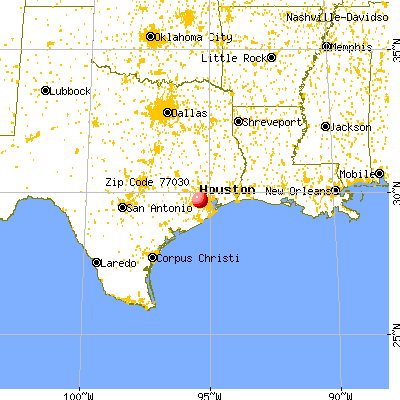


 Nearest zip codes: 77005, 77054, 77098, 77006, 77025, 77046.
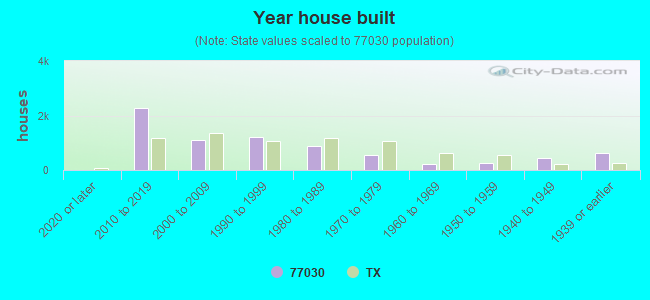


 According to the data from the years 2008 - 2018 the average number of fire incidents per year is 49. The highest number of reported fires - 94 took place in 2011, and the least - 7 in 2008. The data has a rising trend.
 When looking into fire subcategories, the most incidents belonged to: Outside Fires (35.3%), and Mobile Property/Vehicle Fires (30.8%).