Estimated zip code population in 2022: 16,885 Zip code population in 2010: 11,931 Zip code population in 2000: 8,283
Houses and condos: 5,689 Renter-occupied apartments: 789
% of renters here:
15%
State:
38%
March 2022 cost of living index in zip code 77306: 86.2 (less than average, U.S. average is 100)
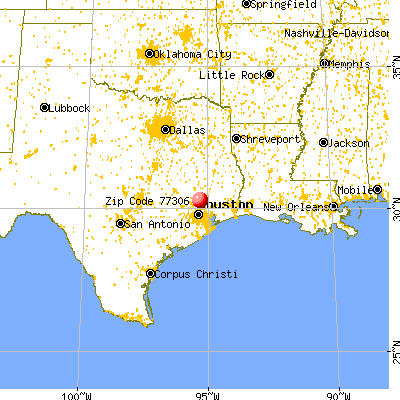
Land area: 41.1 sq. mi. Water area: 0.0 sq. mi.
Population density: 411 people per square mile
(low).
OSM Map
General Map
Google Map
MSN Map
OSM Map
General Map
Google Map
MSN Map
OSM Map
General Map
Google Map
MSN Map
OSM Map
General Map
Google Map
MSN Map
Please wait while loading the map...
Real estate property taxes paid for housing units in 2022:
This zip code:
0.5% ($895)
Texas:
1.5% ($4,050)
Median real estate property taxes paid for housing units with mortgages in 2022: $1,269 (0.5%) Median real estate property taxes paid for housing units with no mortgage in 2022: $845 (0.6%)
Averages for the 2020 tax year for zip code 77306, filed in 2021:
Average Adjusted Gross Income (AGI) in 2020: $39,481 (Individual Income Tax Returns)
Here:
$39,481
State:
$77,054
Salary/wage: $39,239 (reported on 80.3% of returns)
Here:
$39,239
State:
$62,766
(% of AGI for various income ranges: 1198.6% for AGIs below $25k, 3461.0% for AGIs $25k-50k, 6612.9% for AGIs $50k-75k, 9368.0% for AGIs $75k-100k, 15324.8% for AGIs $100k-200k)
Taxable interest for individuals: $515 (reported on 8.4% of returns)
This zip code:
$515
Texas:
$2,665
(% of AGI for various income ranges: 3.5% for AGIs below $25k, 4.5% for AGIs $25k-50k, 6.5% for AGIs $50k-75k, 3.7% for AGIs $75k-100k, 13.3% for AGIs $100k-200k)
Ordinary dividends: $1,596 (reported on 4.1% of returns)
Here:
$1,596
State:
$10,044
(% of AGI for various income ranges: 4.3% for AGIs below $25k, 2.9% for AGIs $25k-50k, 3.9% for AGIs $50k-75k, 21.7% for AGIs $75k-100k, 33.7% for AGIs $100k-200k)
Net capital gain/loss in AGI: +$4,468 (reported on 3.9% of returns)
Here:
+$4,468
State:
+$39,590
(% of AGI for various income ranges: 6.9% for AGIs below $25k, 6.3% for AGIs $25k-50k, 13.5% for AGIs $50k-75k, 37.7% for AGIs $75k-100k, 249.3% for AGIs $100k-200k)
Profit/loss from business: +$8,913 (reported on 27.8% of returns)
Here:
+$8,913
State:
+$10,888
(% of AGI for various income ranges: 358.0% for AGIs below $25k, 315.8% for AGIs $25k-50k, 250.0% for AGIs $50k-75k, 295.0% for AGIs $75k-100k, 296.3% for AGIs $100k-200k)
Taxable individual retirement arrangement distribution: $15,774 (reported on 3.0% of returns)
77306:
$15,774
Texas:
$24,740
(% of AGI for various income ranges: 13.3% for AGIs below $25k, 23.7% for AGIs $25k-50k, 42.3% for AGIs $50k-75k, 160.7% for AGIs $75k-100k, 588.5% for AGIs $100k-200k)
Total itemized deductions: $30,900 (reported on 2.7% of returns)
Here:
$30,900
State:
$40,428
(% of AGI for various income ranges: 82.5% for AGIs $25k-50k, 255.2% for AGIs $50k-75k, 861.9% for AGIs $100k-200k)
Charity contributions: $9,377 (reported on 2.0% of returns)
Here:
$9,377
State:
$18,201
(% of AGI for various income ranges: 11.0% for AGIs $25k-50k, 61.3% for AGIs $50k-75k, 244.4% for AGIs $100k-200k)
Taxes paid: $5,938 (reported on 2.5% of returns)
77306:
$5,938
State:
$7,821
(% of AGI for various income ranges: 15.5% for AGIs $25k-50k, 53.4% for AGIs $50k-75k, 135.9% for AGIs $100k-200k)
Earned income credit: $2,911 (reported on 28.5% of returns)
Here:
$2,911
State:
$2,584
(% of AGI for various income ranges: 168.5% for AGIs below $25k, 109.4% for AGIs $25k-50k, 3.5% for AGIs $50k-75k)
Percentage of individuals using paid preparers for their 2020 taxes: 88.3%
Here:
88%
State:
92%
(% for various income ranges: 86.1% for AGIs below $25k, 88.7% for AGIs $25k-50k, 89.9% for AGIs $50k-75k, 92.3% for AGIs $75k-100k, 94.6% for AGIs $100k-200k, 100.0% for AGIs over 200k)
Averages for the 2012 tax year for zip code 77306, filed in 2013:
Average Adjusted Gross Income (AGI) in 2012: $37,795 (Individual Income Tax Returns)
Here:
$37,795
State:
$65,384
Salary/wage: $36,079 (reported on 85.1% of returns)
Here:
$36,079
State:
$52,524
(% of AGI for various income ranges: 73.6% for AGIs below $25k, 87.3% for AGIs $25k-50k, 87.5% for AGIs $50k-75k, 86.8% for AGIs $75k-100k, 80.7% for AGIs $100k-200k, 54.2% for AGIs over 200k)
Taxable interest for individuals: $529 (reported on 11.1% of returns)
This zip code:
$529
Texas:
$2,372
(% of AGI for various income ranges: 0.1% for AGIs below $25k, 0.1% for AGIs $25k-50k, 0.1% for AGIs $50k-75k, 0.2% for AGIs $75k-100k, 0.3% for AGIs $100k-200k, 0.1% for AGIs over 200k)
Ordinary dividends: $3,438 (reported on 4.7% of returns)
Here:
$3,438
State:
$9,721
(% of AGI for various income ranges: 0.1% for AGIs below $25k, 0.6% for AGIs $50k-75k, 0.1% for AGIs $75k-100k, 1.5% for AGIs $100k-200k)
Net capital gain/loss in AGI: +$1,759 (reported on 3.8% of returns)
Here:
+$1,759
State:
+$35,319
(% of AGI for various income ranges: 0.4% for AGIs $50k-75k, 0.8% for AGIs $100k-200k)
Profit/loss from business: +$9,909 (reported on 23.5% of returns)
Here:
+$9,909
State:
+$13,732
(% of AGI for various income ranges: 21.1% for AGIs below $25k, 4.9% for AGIs $25k-50k, 3.0% for AGIs $50k-75k, 1.2% for AGIs $75k-100k, 3.5% for AGIs $100k-200k)
Taxable individual retirement arrangement distribution: $15,582 (reported on 3.8% of returns)
77306:
$15,582
Texas:
$19,511
(% of AGI for various income ranges: 0.9% for AGIs below $25k, 0.9% for AGIs $25k-50k, 0.9% for AGIs $50k-75k, 2.3% for AGIs $75k-100k, 4.0% for AGIs $100k-200k)
Total itemized deductions: $20,849 (24% of AGI, reported on 11.1% of returns)
Here:
$20,849
State:
$24,724
Here:
23.6% of AGI
State:
15.9% of AGI
(% of AGI for various income ranges: 2.4% for AGIs below $25k, 4.4% for AGIs $25k-50k, 6.6% for AGIs $50k-75k, 8.8% for AGIs $75k-100k, 9.2% for AGIs $100k-200k, 6.9% for AGIs over 200k)
Charity contributions: $4,667 (reported on 8.1% of returns)
Here:
$4,667
State:
$6,808
(% of AGI for various income ranges: 0.3% for AGIs below $25k, 0.6% for AGIs $25k-50k, 1.2% for AGIs $50k-75k, 1.2% for AGIs $75k-100k, 2.2% for AGIs $100k-200k, 0.3% for AGIs over 200k)
Taxes paid: $3,450 (reported on 10.8% of returns)
77306:
$3,450
State:
$6,921
(% of AGI for various income ranges: 0.3% for AGIs below $25k, 0.5% for AGIs $25k-50k, 1.0% for AGIs $50k-75k, 1.5% for AGIs $75k-100k, 1.7% for AGIs $100k-200k, 1.4% for AGIs over 200k)
Earned income credit: $2,821 (reported on 31.6% of returns)
Here:
$2,821
State:
$2,570
(% of AGI for various income ranges: 10.9% for AGIs below $25k, 2.0% for AGIs $25k-50k)
Percentage of individuals using paid preparers for their 2012 taxes: 54.0%
Here:
54%
State:
51%
(% for various income ranges: 55.0% for AGIs below $25k, 53.3% for AGIs $25k-50k, 51.9% for AGIs $50k-75k, 50.0% for AGIs $75k-100k, 52.2% for AGIs $100k-200k, 75.0% for AGIs over 200k)
Averages for the 2004 tax year for zip code 77306, filed in 2005:
Average Adjusted Gross Income (AGI) in 2004: $29,690 (Individual Income Tax Returns)
Here:
$29,690
State:
$47,881
Salary/wage: $30,320 (reported on 85.9% of returns)
Here:
$30,320
State:
$41,947
(% of AGI for various income ranges: 93.7% for AGIs below $10k, 81.3% for AGIs $10k-25k, 90.3% for AGIs $25k-50k, 91.5% for AGIs $50k-75k, 87.9% for AGIs $75k-100k, 81.6% for AGIs over 100k)
Taxable interest for individuals: $856 (reported on 17.2% of returns)
This zip code:
$856
Texas:
$2,255
(% of AGI for various income ranges: 2.4% for AGIs below $10k, 0.7% for AGIs $10k-25k, 0.3% for AGIs $25k-50k, 0.3% for AGIs $50k-75k, 0.5% for AGIs $75k-100k, 0.4% for AGIs over 100k)
Taxable dividends: $877 (reported on 6.2% of returns)
Here:
$877
State:
$4,261
(% of AGI for various income ranges: 1.4% for AGIs below $10k, 0.1% for AGIs $10k-25k, 0.1% for AGIs $25k-50k, 0.1% for AGIs $50k-75k, 0.1% for AGIs $75k-100k, 0.4% for AGIs over 100k)
Net capital gain/loss: +$1,478 (reported on 5.7% of returns)
Here:
+$1,478
State:
+$16,110
(% of AGI for various income ranges: -0.4% for AGIs below $10k, -0.1% for AGIs $10k-25k, 0.0% for AGIs $25k-50k, 0.1% for AGIs $50k-75k, -0.1% for AGIs $75k-100k, 2.8% for AGIs over 100k)
Profit/loss from business: +$7,094 (reported on 19.7% of returns)
Here:
+$7,094
State:
+$11,013
(% of AGI for various income ranges: 15.5% for AGIs below $10k, 12.7% for AGIs $10k-25k, 3.6% for AGIs $25k-50k, 0.8% for AGIs $50k-75k, 3.7% for AGIs $75k-100k, -0.4% for AGIs over 100k)
IRA payment deduction: $2,450 (reported on 0.6% of returns)
77306:
$2,450
Texas:
$3,120
Total itemized deductions: $14,841 (24% of AGI, reported on 11.0% of returns)
Here:
$14,841
State:
$19,631
Here:
24.4% of AGI
State:
18.9% of AGI
(% of AGI for various income ranges: 4.1% for AGIs below $10k, 3.4% for AGIs $10k-25k, 4.6% for AGIs $25k-50k, 5.6% for AGIs $50k-75k, 9.3% for AGIs $75k-100k, 7.9% for AGIs over 100k)
Charity contributions deductions: $3,175 (5% of AGI, reported on 7.7% of returns)
Here:
$3,175
State:
$4,753
Here:
5.0% of AGI
State:
4.2% of AGI
(% of AGI for various income ranges: 0.4% for AGIs $10k-25k, 0.7% for AGIs $25k-50k, 0.8% for AGIs $50k-75k, 1.4% for AGIs $75k-100k, 1.5% for AGIs over 100k)
Total tax: $3,525 (reported on 63.2% of returns)
77306:
$3,525
State:
$9,058
(% of AGI for various income ranges: 4.1% for AGIs below $10k, 3.9% for AGIs $10k-25k, 5.3% for AGIs $25k-50k, 8.0% for AGIs $50k-75k, 10.9% for AGIs $75k-100k, 16.7% for AGIs over 100k)
Earned income credit: $2,124 (reported on 31.7% of returns)
Here:
$2,124
State:
$2,024
Percentage of individuals using paid preparers for their 2004 taxes: 55.5%
Here:
56%
State:
57%
(% for various income ranges: 48.5% for AGIs below $10k, 62.3% for AGIs $10k-25k, 55.3% for AGIs $25k-50k, 50.8% for AGIs $50k-75k, 52.0% for AGIs $75k-100k, 56.6% for AGIs over 100k)
Household received Food Stamps/SNAP in the past 12 months: 817 Household did not receive Food Stamps/SNAP in the past 12 months: 4,493
Women who had a birth in the past 12 months: 139 (102 now married, 37 unmarried) Women who did not have a birth in the past 12 months: 5,407 (2,252 now married, 3,158 unmarried)
Housing units in zip code 77306 with a mortgage: 1,954 (21 second mortgage, 19 home equity loan) Median monthly owner costs for units with a mortgage: $1,017 Median monthly owner costs for units without a mortgage: $365
Residents with income below the poverty level in 2022:
This zip code:
13.8%
Whole state:
14.0%
Residents with income below 50% of the poverty level in 2022:
This zip code:
12.1%
Whole state:
7.4%
Median number of rooms in houses and condos:
Here:
5.1
State:
6.3
Median number of rooms in apartments:
Here:
4.0
State:
4.0
Notable locations in this zip code not listed on our city pages
Notable locations in zip code 77306: Black Diamond (A), Four Corners (B), Grangerland Volunteer Fire Department Station 41 (C), Cut N Shoot Volunteer Fire Department Station 21 (D). Display/hide their locations on the map
Lakes, reservoirs, and swamps: Crater Lake (A), Round Pond (B), Lake Wildwood (C), Grange Pond (D), Larson Pond (E), Cagle Pond (F), Pitts Pond (G), Clark Pond (H). Display/hide their locations on the map
In group quarters: 20 (-1 institutionalized population)
Size of family households: 1,201 2-persons, 496 3-persons, 1,035 4-persons, 919 5-persons, 190 6-persons, 229 7-or-more-persons
Size of nonfamily households: 768 1-person, 415 2-persons
3,767 married couples with children.
742 single-parent households (188 men, 554 women).
56.6% of residents of 77306 zip code speak English at home.
41.1% of residents speak Spanish at home (68% very well, 15% well, 12% not well, 4% not at all).
1.0% of residents speak other Indo-European language at home (100% very well).
0.4% of residents speak other language at home (100% very well).
Foreign born population: 3,165 (18.7%) (26.3% of them are naturalized citizens)
Facilities with environmental interests located in this zip code:
AUSTIN EL (14796 HWY 105 E in CONROE, TX)
(National Center for Education Statistics) - STATE ID-170902102 Organizations: CONROE ISD (SCHOOL DISTRICT)
Housing units lacking complete plumbing facilities: 2.6% Housing units lacking complete kitchen facilities: 1.0%
84.6%Electricity
7.5%Utility gas
4.5%Bottled, tank, or LP gas
2.4%Other fuel
0.8%Wood
Place of birth for U.S.-born residents:
This state: 10,567
Northeast: 380
Midwest: 688
South: 746
West: 941
57% of the 77306 zip code residents lived in the same house 5 years ago. Out of people who lived in different houses, 57% lived in this county. Out of people who lived in different counties, 50% lived in Texas.
98% of the 77306 zip code residents lived in the same house 1 year ago. Out of people who lived in different houses, 1% moved from this county. Out of people who lived in different houses, 110% moved from different county within same state. Out of people who lived in different houses, 3% moved from different state. Out of people who lived in different houses, 13% moved from abroad.
Private vs. public school enrollment:
Students in private schools in grades 1 to 8 (elementary and middle school): 425
Here:
17.6%
Texas:
8.8%
Students in private schools in grades 9 to 12 (high school): 35
Here:
2.1%
Texas:
8.0%
Students in private undergraduate colleges: 12
Here:
2.4%
Texas:
16.2%
Occupation by median earnings in the past 12 months ($)
117,489Management occupations
95,325Business and financial operations occupations
61,630Installation, maintenance, and repair occupations
61,501Education, training, and library occupations
56,846Law enforcement workers including supervisors
52,093Transportation occupations
Companies with federal contracts located in this zip code:
E L J CONTRACTORS (17235 HIGHWAY 105 E in CONROE, TX; small business) : $99,162 in 41 contractsfrom 2003 to 2006
Contracts for Landscaping/Groundskeeping Services, Custodial Janitorial Services by Army Signed by year:2000: $0; 2001: $0; 2002: $0; 2003: $21,087; 2004: $36,725; 2005: $22,815; 2006: $18,535.
Biggest contracts:
$8,640 with Army for Landscaping/Groundskeeping Services. Signed on 2004-10-01. Completion date: 2005-09-30.
$7,812, same as above.Signed on 2003-10-01. Completion date: 2004-09-30.
$7,200, same as above.Signed on 2005-04-07. Completion date: 2006-03-31.
$6,660, same as above.Signed on 2005-04-06. Completion date: 2006-04-30.
DURAQUEST, INC (3901 FM 1485 in CONROE, TX; small business)
$26,393 with Navy for Rubber Fabricated Materials. Signed on 2001-12-10. Completion date: 2002-01-30.
Top industries in this zip code by the number of employees in 2005:
Construction: Poured Concrete Foundation and Structure Contractors (50-99 employees: 1 establishment, 5-9 employees: 1 establishment)
Accommodation and Food Services: Limited-Service Restaurants (20-49: 1, 10-19: 1)
Construction: Commercial and Institutional Building Construction (20-49: 1, 5-9: 1, 1-4: 1)
Wholesale Trade: Industrial Machinery and Equipment Merchant Wholesalers (20-49: 1)
Construction: Plumbing, Heating, and Air-Conditioning Contractors (5-9: 2, 1-4: 1)
People in group quarters in 2010:
4 people in workers' group living quarters and job corps centers
People in group quarters in 2000:
26 people in nursing homes
Fatal accident statistics in 2014:
Fatal accident count: 3
Vehicles involved in fatal accidents: 3
Fatal accidents caused by drunken drivers: 1
Fatalities: 3
Persons involved in fatal accidents: 5
Pedestrians involved in fatal accidents: 1
Fatal accident statistics in 2013:
Fatal accident count: 1
Vehicles involved in fatal accidents: 2
Fatal accidents caused by drunken drivers: 1
Fatalities: 1
Persons involved in fatal accidents: 5
Pedestrians involved in fatal accidents: 0
Home Mortgage Disclosure Act Aggregated Statistics For Year 2009 (Based on 4 partial tracts)
A) FHA, FSA/RHS & VA Home Purchase Loans
B) Conventional Home Purchase Loans
C) Refinancings
D) Home Improvement Loans
F) Non-occupant Loans on < 5 Family Dwellings (A B C & D)
G) Loans On Manufactured Home Dwelling (A B C & D)
Number
Average Value
Number
Average Value
Number
Average Value
Number
Average Value
Number
Average Value
Number
Average Value
LOANS ORIGINATED
25
$107,396
25
$122,723
60
$166,081
15
$21,099
5
$80,810
13
$43,344
APPLICATIONS APPROVED, NOT ACCEPTED
5
$106,996
6
$71,987
10
$186,166
2
$41,885
1
$120,990
4
$40,652
APPLICATIONS DENIED
8
$116,671
18
$89,335
42
$132,689
25
$30,460
1
$56,390
23
$53,949
APPLICATIONS WITHDRAWN
2
$101,855
1
$390,370
28
$152,828
3
$24,340
1
$39,480
1
$115,060
FILES CLOSED FOR INCOMPLETENESS
1
$28,200
0
$0
9
$114,881
10
$62,487
0
$0
8
$56,070
Aggregated Statistics For Year 2008 (Based on 4 partial tracts)
A) FHA, FSA/RHS & VA Home Purchase Loans
B) Conventional Home Purchase Loans
C) Refinancings
D) Home Improvement Loans
F) Non-occupant Loans on < 5 Family Dwellings (A B C & D)
G) Loans On Manufactured Home Dwelling (A B C & D)
Number
Average Value
Number
Average Value
Number
Average Value
Number
Average Value
Number
Average Value
Number
Average Value
LOANS ORIGINATED
26
$115,666
48
$151,546
57
$161,682
25
$37,885
9
$88,306
13
$50,012
APPLICATIONS APPROVED, NOT ACCEPTED
2
$42,855
17
$94,758
10
$168,426
5
$20,196
2
$31,890
13
$56,608
APPLICATIONS DENIED
10
$133,554
56
$81,277
65
$134,491
68
$47,600
7
$76,907
41
$49,215
APPLICATIONS WITHDRAWN
5
$91,370
6
$95,130
15
$205,680
4
$81,472
2
$56,940
0
$0
FILES CLOSED FOR INCOMPLETENESS
2
$135,030
2
$153,615
6
$219,057
4
$36,510
1
$149,460
1
$13,050
Aggregated Statistics For Year 2007 (Based on 4 partial tracts)
A) FHA, FSA/RHS & VA Home Purchase Loans
B) Conventional Home Purchase Loans
C) Refinancings
D) Home Improvement Loans
F) Non-occupant Loans on < 5 Family Dwellings (A B C & D)
G) Loans On Manufactured Home Dwelling (A B C & D)
Number
Average Value
Number
Average Value
Number
Average Value
Number
Average Value
Number
Average Value
Number
Average Value
LOANS ORIGINATED
15
$93,727
117
$107,536
72
$111,280
31
$29,455
17
$70,873
32
$54,430
APPLICATIONS APPROVED, NOT ACCEPTED
7
$78,839
35
$71,178
22
$111,834
7
$46,040
2
$66,105
26
$50,664
APPLICATIONS DENIED
4
$70,875
70
$69,696
97
$117,484
62
$74,207
12
$48,392
59
$51,395
APPLICATIONS WITHDRAWN
3
$135,657
16
$97,460
52
$128,000
6
$53,098
2
$35,245
5
$77,092
FILES CLOSED FOR INCOMPLETENESS
0
$0
4
$133,285
10
$140,387
1
$68,930
0
$0
1
$68,930
Aggregated Statistics For Year 2006 (Based on 4 partial tracts)
A) FHA, FSA/RHS & VA Home Purchase Loans
B) Conventional Home Purchase Loans
C) Refinancings
D) Home Improvement Loans
F) Non-occupant Loans on < 5 Family Dwellings (A B C & D)
G) Loans On Manufactured Home Dwelling (A B C & D)
Number
Average Value
Number
Average Value
Number
Average Value
Number
Average Value
Number
Average Value
Number
Average Value
LOANS ORIGINATED
15
$93,290
166
$98,060
81
$129,064
15
$23,557
19
$97,457
34
$56,299
APPLICATIONS APPROVED, NOT ACCEPTED
6
$93,628
49
$73,078
19
$102,413
4
$36,485
3
$21,513
31
$49,755
APPLICATIONS DENIED
11
$89,323
102
$77,373
115
$94,677
48
$30,393
18
$90,516
76
$53,754
APPLICATIONS WITHDRAWN
1
$102,010
19
$97,623
55
$103,226
7
$57,299
4
$108,892
10
$58,199
FILES CLOSED FOR INCOMPLETENESS
2
$47,450
4
$131,590
23
$108,367
0
$0
0
$0
0
$0
Aggregated Statistics For Year 2005 (Based on 4 partial tracts)
A) FHA, FSA/RHS & VA Home Purchase Loans
B) Conventional Home Purchase Loans
C) Refinancings
D) Home Improvement Loans
F) Non-occupant Loans on < 5 Family Dwellings (A B C & D)
G) Loans On Manufactured Home Dwelling (A B C & D)
Number
Average Value
Number
Average Value
Number
Average Value
Number
Average Value
Number
Average Value
Number
Average Value
LOANS ORIGINATED
19
$81,806
139
$82,029
104
$112,774
35
$55,518
32
$44,266
58
$55,942
APPLICATIONS APPROVED, NOT ACCEPTED
6
$72,435
66
$62,941
34
$108,061
5
$59,736
8
$91,168
41
$47,721
APPLICATIONS DENIED
15
$85,137
88
$60,188
125
$86,641
50
$41,962
16
$38,749
79
$43,540
APPLICATIONS WITHDRAWN
4
$79,182
28
$82,352
59
$107,324
10
$88,404
4
$37,928
13
$56,858
FILES CLOSED FOR INCOMPLETENESS
2
$112,690
4
$74,715
36
$150,706
0
$0
1
$265,050
1
$143,530
Aggregated Statistics For Year 2004 (Based on 4 partial tracts)
A) FHA, FSA/RHS & VA Home Purchase Loans
B) Conventional Home Purchase Loans
C) Refinancings
D) Home Improvement Loans
E) Loans on Dwellings For 5+ Families
F) Non-occupant Loans on < 5 Family Dwellings (A B C & D)
G) Loans On Manufactured Home Dwelling (A B C & D)
Number
Average Value
Number
Average Value
Number
Average Value
Number
Average Value
Number
Average Value
Number
Average Value
Number
Average Value
LOANS ORIGINATED
65
$93,787
133
$84,197
110
$101,775
30
$43,932
1
$823,220
17
$56,146
87
$64,086
APPLICATIONS APPROVED, NOT ACCEPTED
18
$89,973
44
$70,390
33
$96,910
10
$55,678
0
$0
1
$94,900
45
$51,699
APPLICATIONS DENIED
116
$94,078
101
$56,592
118
$100,308
53
$23,211
0
$0
14
$48,971
92
$52,174
APPLICATIONS WITHDRAWN
18
$95,555
19
$79,477
52
$92,227
5
$50,674
0
$0
4
$57,702
18
$81,072
FILES CLOSED FOR INCOMPLETENESS
39
$95,474
11
$100,341
31
$143,128
2
$46,415
0
$0
2
$53,970
2
$55,265
Aggregated Statistics For Year 2003 (Based on 4 partial tracts)
A) FHA, FSA/RHS & VA Home Purchase Loans
B) Conventional Home Purchase Loans
C) Refinancings
D) Home Improvement Loans
F) Non-occupant Loans on < 5 Family Dwellings (A B C & D)
Number
Average Value
Number
Average Value
Number
Average Value
Number
Average Value
Number
Average Value
LOANS ORIGINATED
123
$94,509
146
$75,896
164
$107,764
26
$29,790
26
$45,137
APPLICATIONS APPROVED, NOT ACCEPTED
5
$56,700
50
$50,259
43
$99,185
10
$29,085
2
$69,995
APPLICATIONS DENIED
37
$87,291
120
$57,608
180
$82,123
38
$20,787
7
$54,090
APPLICATIONS WITHDRAWN
15
$96,849
16
$63,119
83
$83,544
3
$11,123
0
$0
FILES CLOSED FOR INCOMPLETENESS
7
$87,529
2
$114,495
10
$94,240
2
$52,195
0
$0
Aggregated Statistics For Year 1999 (Based on 2 partial tracts)
A) FHA, FSA/RHS & VA Home Purchase Loans
B) Conventional Home Purchase Loans
C) Refinancings
D) Home Improvement Loans
F) Non-occupant Loans on < 5 Family Dwellings (A B C & D)
Detailed PMIC statistics for the following Tracts:6927.00
, 6930.00
2003 - 2018 National Fire Incident Reporting System (NFIRS) incidents
Based on the data from the years 2003 - 2018 the average number of fires per year is 115. The highest number of reported fires - 191 took place in 2007, and the least - 65 in 2003. The data has an increasing trend.
When looking into fire subcategories, the most incidents belonged to: Outside Fires (51.4%), and Structure Fires (36.3%).
Fire incident types reported to NFIRS in Zip Code 77306


 Nearest zip codes: 77302, 77303, 77301, 77385, 77372, 77328.


 Based on the data from the years 2003 - 2018 the average number of fires per year is 115. The highest number of reported fires - 191 took place in 2007, and the least - 65 in 2003. The data has an increasing trend.
 When looking into fire subcategories, the most incidents belonged to: Outside Fires (51.4%), and Structure Fires (36.3%).