Estimated zip code population in 2022: 39,196 Zip code population in 2010: 33,678 Zip code population in 2000: 32,546
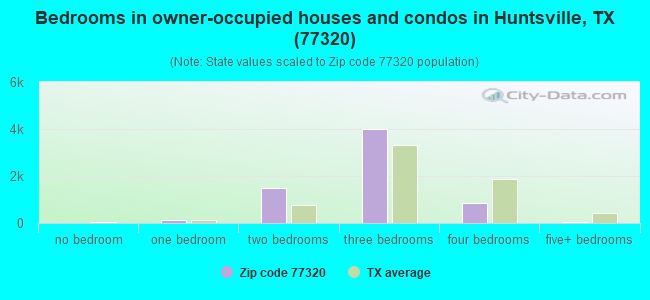
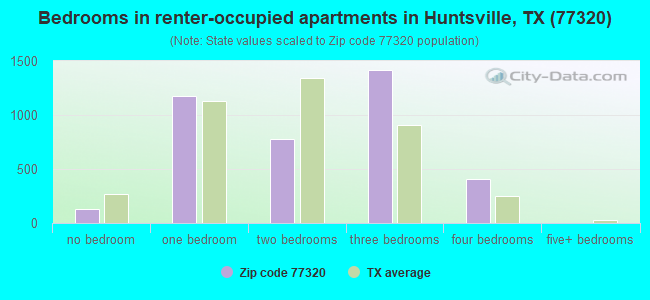
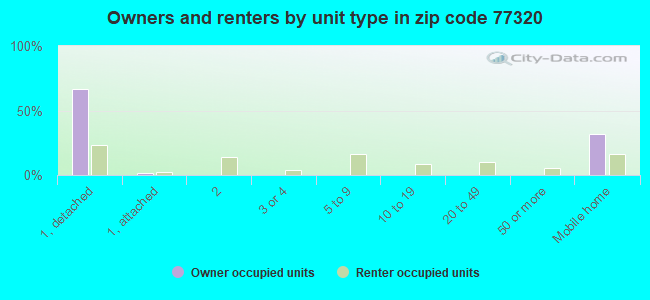
Houses and condos: 12,621 Renter-occupied apartments: 3,953
% of renters here:
37%
State:
38%
March 2022 cost of living index in zip code 77320: 80.8 (low, U.S. average is 100)
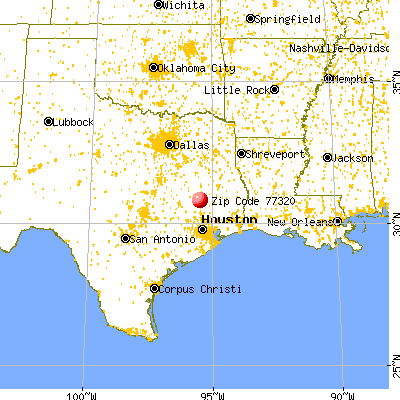
Land area: 318.0 sq. mi. Water area: 17.3 sq. mi.
Population density: 123 people per square mile
(very low).
OSM Map
General Map
Google Map
MSN Map
OSM Map
General Map
Google Map
MSN Map
OSM Map
General Map
Google Map
MSN Map
OSM Map
General Map
Google Map
MSN Map
Please wait while loading the map...
Real estate property taxes paid for housing units in 2022:
This zip code:
1.1% ($2,345)
Texas:
1.5% ($4,050)
Median real estate property taxes paid for housing units with mortgages in 2022: $2,867 (1.3%) Median real estate property taxes paid for housing units with no mortgage in 2022: $1,736 (1.0%)
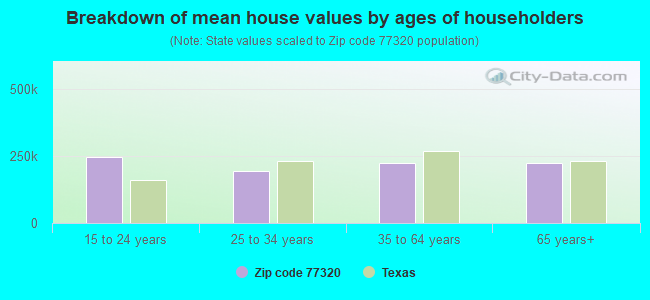
Estimated median house/condo value in 2022: $207,591
77320:
$207,591
Texas:
$275,400
According to our research of Texas and other state lists, there were 84 registered sex offenders living in 77320 zip code as of May 17, 2024. The ratio of all residents to sex offenders in zip code 77320 is 434 to 1. The ratio of registered sex offenders to all residents in this zip code is near the state average.
Median resident age:
This zip code:
39.1 years
Texas median age:
35.6 years
Average household size:
This zip code:
2.7 people
Texas:
2.6 people
Averages for the 2020 tax year for zip code 77320, filed in 2021:
Average Adjusted Gross Income (AGI) in 2020: $49,365 (Individual Income Tax Returns)
Here:
$49,365
State:
$77,054
Salary/wage: $43,384 (reported on 80.4% of returns)
Here:
$43,384
State:
$62,766
(% of AGI for various income ranges: 1288.6% for AGIs below $25k, 3508.7% for AGIs $25k-50k, 6152.5% for AGIs $50k-75k, 8937.2% for AGIs $75k-100k, 14863.8% for AGIs $100k-200k, 48781.2% for AGIs over 200k)
Taxable interest for individuals: $1,516 (reported on 22.0% of returns)
This zip code:
$1,516
Texas:
$2,665
(% of AGI for various income ranges: 10.3% for AGIs below $25k, 10.2% for AGIs $25k-50k, 38.9% for AGIs $50k-75k, 54.2% for AGIs $75k-100k, 141.9% for AGIs $100k-200k, 1817.5% for AGIs over 200k)
Ordinary dividends: $4,295 (reported on 10.7% of returns)
Here:
$4,295
State:
$10,044
(% of AGI for various income ranges: 12.0% for AGIs below $25k, 18.5% for AGIs $25k-50k, 47.3% for AGIs $50k-75k, 126.8% for AGIs $75k-100k, 247.9% for AGIs $100k-200k, 1750.0% for AGIs over 200k)
Net capital gain/loss in AGI: +$14,074 (reported on 10.1% of returns)
Here:
+$14,074
State:
+$39,590
(% of AGI for various income ranges: 5.3% for AGIs below $25k, 14.2% for AGIs $25k-50k, 91.5% for AGIs $50k-75k, 136.8% for AGIs $75k-100k, 482.9% for AGIs $100k-200k, 12918.8% for AGIs over 200k)
Profit/loss from business: +$3,311 (reported on 19.8% of returns)
Here:
+$3,311
State:
+$10,888
(% of AGI for various income ranges: 36.0% for AGIs below $25k, 8.0% for AGIs $25k-50k, 36.0% for AGIs $50k-75k, 208.3% for AGIs $75k-100k, 404.8% for AGIs $100k-200k, 2182.5% for AGIs over 200k)
Taxable individual retirement arrangement distribution: $22,148 (reported on 6.1% of returns)
77320:
$22,148
Texas:
$24,740
(% of AGI for various income ranges: 27.6% for AGIs below $25k, 64.2% for AGIs $25k-50k, 154.9% for AGIs $50k-75k, 263.0% for AGIs $75k-100k, 1021.0% for AGIs $100k-200k, 3606.2% for AGIs over 200k)
Total itemized deductions: $33,119 (reported on 4.4% of returns)
Here:
$33,119
State:
$40,428
(% of AGI for various income ranges: 32.8% for AGIs below $25k, 103.8% for AGIs $25k-50k, 241.9% for AGIs $50k-75k, 367.5% for AGIs $75k-100k, 666.4% for AGIs $100k-200k, 4326.2% for AGIs over 200k)
Charity contributions: $13,210 (reported on 3.7% of returns)
Here:
$13,210
State:
$18,201
(% of AGI for various income ranges: 6.0% for AGIs below $25k, 21.3% for AGIs $25k-50k, 74.1% for AGIs $50k-75k, 109.2% for AGIs $75k-100k, 198.3% for AGIs $100k-200k, 2417.5% for AGIs over 200k)
Taxes paid: $5,821 (reported on 4.3% of returns)
77320:
$5,821
State:
$7,821
(% of AGI for various income ranges: 4.4% for AGIs below $25k, 16.7% for AGIs $25k-50k, 43.2% for AGIs $50k-75k, 62.8% for AGIs $75k-100k, 126.2% for AGIs $100k-200k, 732.5% for AGIs over 200k)
Earned income credit: $2,568 (reported on 22.9% of returns)
Here:
$2,568
State:
$2,584
(% of AGI for various income ranges: 129.0% for AGIs below $25k, 81.2% for AGIs $25k-50k, 1.3% for AGIs $50k-75k)
Percentage of individuals using paid preparers for their 2020 taxes: 90.8%
Here:
91%
State:
92%
(% for various income ranges: 88.7% for AGIs below $25k, 92.9% for AGIs $25k-50k, 90.9% for AGIs $50k-75k, 93.2% for AGIs $75k-100k, 90.7% for AGIs $100k-200k, 91.7% for AGIs over 200k)
Averages for the 2012 tax year for zip code 77320, filed in 2013:
Average Adjusted Gross Income (AGI) in 2012: $43,839 (Individual Income Tax Returns)
Here:
$43,839
State:
$65,384
Salary/wage: $36,903 (reported on 85.1% of returns)
Here:
$36,903
State:
$52,524
(% of AGI for various income ranges: 84.7% for AGIs below $25k, 84.6% for AGIs $25k-50k, 76.3% for AGIs $50k-75k, 71.7% for AGIs $75k-100k, 66.2% for AGIs $100k-200k, 37.5% for AGIs over 200k)
Taxable interest for individuals: $1,145 (reported on 23.2% of returns)
This zip code:
$1,145
Texas:
$2,372
(% of AGI for various income ranges: 0.7% for AGIs below $25k, 0.5% for AGIs $25k-50k, 0.6% for AGIs $50k-75k, 0.5% for AGIs $75k-100k, 0.8% for AGIs $100k-200k, 0.6% for AGIs over 200k)
Ordinary dividends: $3,944 (reported on 10.7% of returns)
Here:
$3,944
State:
$9,721
(% of AGI for various income ranges: 1.0% for AGIs below $25k, 0.5% for AGIs $25k-50k, 0.6% for AGIs $50k-75k, 1.0% for AGIs $75k-100k, 1.4% for AGIs $100k-200k, 1.3% for AGIs over 200k)
Net capital gain/loss in AGI: +$6,977 (reported on 8.0% of returns)
Here:
+$6,977
State:
+$35,319
(% of AGI for various income ranges: 0.2% for AGIs $25k-50k, 0.2% for AGIs $50k-75k, 0.6% for AGIs $75k-100k, 0.9% for AGIs $100k-200k, 7.2% for AGIs over 200k)
Profit/loss from business: +$3,731 (reported on 18.8% of returns)
Here:
+$3,731
State:
+$13,732
(% of AGI for various income ranges: 1.8% for AGIs below $25k, 0.2% for AGIs $25k-50k, 0.4% for AGIs $50k-75k, 1.5% for AGIs $75k-100k, 2.7% for AGIs $100k-200k, 4.0% for AGIs over 200k)
Taxable individual retirement arrangement distribution: $15,747 (reported on 7.0% of returns)
77320:
$15,747
Texas:
$19,511
(% of AGI for various income ranges: 1.4% for AGIs below $25k, 1.5% for AGIs $25k-50k, 2.0% for AGIs $50k-75k, 3.0% for AGIs $75k-100k, 4.8% for AGIs $100k-200k, 2.2% for AGIs over 200k)
Self-employment retirement plans: $11,450 (reported on 0.2% of returns)
77320:
$11,450
Texas:
$23,938
Total itemized deductions: $20,957 (22% of AGI, reported on 16.6% of returns)
Here:
$20,957
State:
$24,724
Here:
21.9% of AGI
State:
15.9% of AGI
(% of AGI for various income ranges: 4.4% for AGIs below $25k, 7.0% for AGIs $25k-50k, 9.2% for AGIs $50k-75k, 8.0% for AGIs $75k-100k, 10.1% for AGIs $100k-200k, 8.3% for AGIs over 200k)
Charity contributions: $5,455 (reported on 12.4% of returns)
Here:
$5,455
State:
$6,808
(% of AGI for various income ranges: 0.6% for AGIs below $25k, 1.1% for AGIs $25k-50k, 1.6% for AGIs $50k-75k, 1.3% for AGIs $75k-100k, 2.5% for AGIs $100k-200k, 2.1% for AGIs over 200k)
Taxes paid: $4,538 (reported on 16.3% of returns)
77320:
$4,538
State:
$6,921
(% of AGI for various income ranges: 0.7% for AGIs below $25k, 1.1% for AGIs $25k-50k, 1.8% for AGIs $50k-75k, 2.0% for AGIs $75k-100k, 2.6% for AGIs $100k-200k, 1.8% for AGIs over 200k)
Earned income credit: $2,627 (reported on 27.2% of returns)
Here:
$2,627
State:
$2,570
(% of AGI for various income ranges: 9.7% for AGIs below $25k, 1.5% for AGIs $25k-50k)
Percentage of individuals using paid preparers for their 2012 taxes: 51.5%
Here:
52%
State:
51%
(% for various income ranges: 50.5% for AGIs below $25k, 50.8% for AGIs $25k-50k, 51.4% for AGIs $50k-75k, 49.2% for AGIs $75k-100k, 58.3% for AGIs $100k-200k, 81.8% for AGIs over 200k)
Averages for the 2004 tax year for zip code 77320, filed in 2005:
Average Adjusted Gross Income (AGI) in 2004: $32,440 (Individual Income Tax Returns)
Here:
$32,440
State:
$47,881
Salary/wage: $29,208 (reported on 86.6% of returns)
Here:
$29,208
State:
$41,947
(% of AGI for various income ranges: 112.1% for AGIs below $10k, 87.7% for AGIs $10k-25k, 86.5% for AGIs $25k-50k, 77.4% for AGIs $50k-75k, 74.8% for AGIs $75k-100k, 53.0% for AGIs over 100k)
Taxable interest for individuals: $1,560 (reported on 28.1% of returns)
This zip code:
$1,560
Texas:
$2,255
(% of AGI for various income ranges: 2.7% for AGIs below $10k, 1.1% for AGIs $10k-25k, 0.8% for AGIs $25k-50k, 1.1% for AGIs $50k-75k, 1.6% for AGIs $75k-100k, 2.5% for AGIs over 100k)
Taxable dividends: $2,262 (reported on 11.8% of returns)
Here:
$2,262
State:
$4,261
(% of AGI for various income ranges: 1.7% for AGIs below $10k, 0.5% for AGIs $10k-25k, 0.5% for AGIs $25k-50k, 0.6% for AGIs $50k-75k, 0.8% for AGIs $75k-100k, 1.8% for AGIs over 100k)
Net capital gain/loss: +$5,295 (reported on 10.3% of returns)
Here:
+$5,295
State:
+$16,110
(% of AGI for various income ranges: -0.2% for AGIs below $10k, -0.1% for AGIs $10k-25k, 0.1% for AGIs $25k-50k, 1.1% for AGIs $50k-75k, 1.0% for AGIs $75k-100k, 7.4% for AGIs over 100k)
Profit/loss from business: +$2,618 (reported on 15.9% of returns)
Here:
+$2,618
State:
+$11,013
(% of AGI for various income ranges: 1.8% for AGIs below $10k, 1.4% for AGIs $10k-25k, 0.7% for AGIs $25k-50k, 0.8% for AGIs $50k-75k, 1.5% for AGIs $75k-100k, 2.4% for AGIs over 100k)
IRA payment deduction: $2,401 (reported on 2.2% of returns)
77320:
$2,401
Texas:
$3,120
(% of AGI for various income ranges: 0.3% for AGIs $10k-25k, 0.2% for AGIs $25k-50k, 0.1% for AGIs $50k-75k, 0.1% for AGIs $75k-100k, 0.1% for AGIs over 100k)
Self-employed pension: $12,625 (reported on 0.2% of returns)
Here:
$12,625
Texas:
$16,401
Total itemized deductions: $16,283 (26% of AGI, reported on 15.6% of returns)
Here:
$16,283
State:
$19,631
Here:
25.7% of AGI
State:
18.9% of AGI
(% of AGI for various income ranges: 7.1% for AGIs below $10k, 5.0% for AGIs $10k-25k, 7.7% for AGIs $25k-50k, 8.5% for AGIs $50k-75k, 10.7% for AGIs $75k-100k, 8.1% for AGIs over 100k)
Charity contributions deductions: $4,278 (6% of AGI, reported on 12.5% of returns)
Here:
$4,278
State:
$4,753
Here:
6.3% of AGI
State:
4.2% of AGI
(% of AGI for various income ranges: 0.4% for AGIs below $10k, 0.6% for AGIs $10k-25k, 1.3% for AGIs $25k-50k, 1.8% for AGIs $50k-75k, 2.2% for AGIs $75k-100k, 2.9% for AGIs over 100k)
Total tax: $4,217 (reported on 64.7% of returns)
77320:
$4,217
State:
$9,058
(% of AGI for various income ranges: 2.5% for AGIs below $10k, 3.1% for AGIs $10k-25k, 5.5% for AGIs $25k-50k, 8.5% for AGIs $50k-75k, 10.7% for AGIs $75k-100k, 17.2% for AGIs over 100k)
Earned income credit: $1,978 (reported on 28.8% of returns)
Here:
$1,978
State:
$2,024
Percentage of individuals using paid preparers for their 2004 taxes: 56.8%
Here:
57%
State:
57%
(% for various income ranges: 52.4% for AGIs below $10k, 61.0% for AGIs $10k-25k, 55.4% for AGIs $25k-50k, 54.3% for AGIs $50k-75k, 55.9% for AGIs $75k-100k, 65.4% for AGIs over 100k)
Likely homosexual households (counted as self-reported same-sex unmarried-partner households)
Lesbian couples: 0.2% of all households
Gay men: 0.0% of all households
Household received Food Stamps/SNAP in the past 12 months: 1,587 Household did not receive Food Stamps/SNAP in the past 12 months: 8,974
Women who had a birth in the past 12 months: 412 (182 now married, 224 unmarried) Women who did not have a birth in the past 12 months: 6,380 (2,102 now married, 4,300 unmarried)
Housing units in zip code 77320 with a mortgage: 3,230 (3 second mortgage) Houses without a mortgage: 101
Median monthly owner costs for units with a mortgage: $1,363 Median monthly owner costs for units without a mortgage: $550
Residents with income below the poverty level in 2022:
This zip code:
16.1%
Whole state:
14.0%
Residents with income below 50% of the poverty level in 2022:
This zip code:
5.0%
Whole state:
7.4%
Median number of rooms in houses and condos:
Here:
5.6
State:
6.3
Median number of rooms in apartments:
Here:
4.3
State:
4.0
Notable locations in this zip code not listed on our city pages
2,745 married couples with children.
1,836 single-parent households (682 men, 1,154 women).
82.1% of residents of 77320 zip code speak English at home.
16.2% of residents speak Spanish at home (65% very well, 19% well, 11% not well, 4% not at all).
0.6% of residents speak other Indo-European language at home (100% very well).
0.5% of residents speak Asian or Pacific Island language at home (84% very well, 5% well, 11% not well).
0.5% of residents speak other language at home (67% very well, 33% not well).
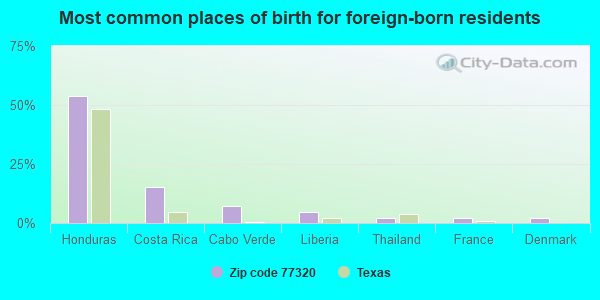
Foreign born population: 2,538 (6.5%) (34.5% of them are naturalized citizens)
This zip code:
6.5%
Whole state:
17.2%
54%Honduras
15%Costa Rica
7%Cabo Verde
5%Liberia
2%Thailand
2%France
2%Denmark
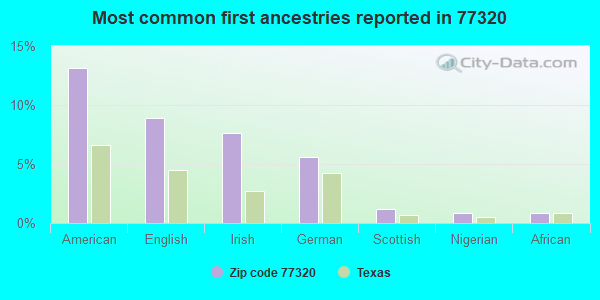
13%American
9%English
8%Irish
6%German
1%Scottish
1%Nigerian
1%African
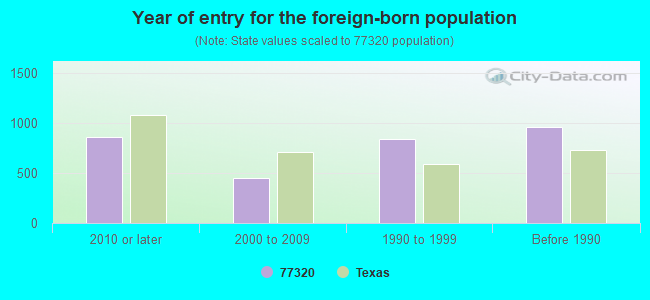
Year of entry for the foreign-born population
8642010 or later
4552000 to 2009
8451990 to 1999
958Before 1990
Housing units lacking complete plumbing facilities: 3.5% Housing units lacking complete kitchen facilities: 3.7%
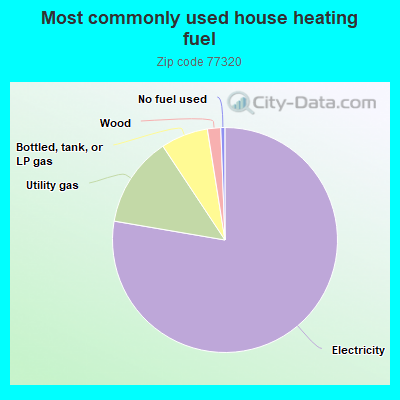
77.7%Electricity
13.0%Utility gas
6.8%Bottled, tank, or LP gas
1.9%Wood
0.6%No fuel used
Place of birth for U.S.-born residents:
This state: 29,251
Northeast: 496
Midwest: 1,523
South: 2,687
West: 1,848
47% of the 77320 zip code residents lived in the same house 5 years ago. Out of people who lived in different houses, 28% lived in this county. Out of people who lived in different counties, 50% lived in Texas.
85% of the 77320 zip code residents lived in the same house 1 year ago. Out of people who lived in different houses, 31% moved from this county. Out of people who lived in different houses, 59% moved from different county within same state. Out of people who lived in different houses, 11% moved from different state. Out of people who lived in different houses, 0% moved from abroad.
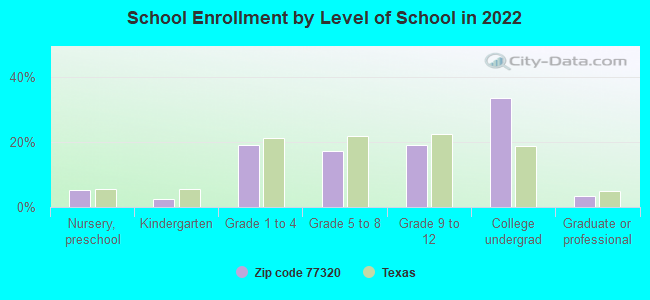
Private vs. public school enrollment:
Students in private schools in grades 1 to 8 (elementary and middle school): 246
Here:
10.6%
Texas:
8.8%
Students in private schools in grades 9 to 12 (high school): 69
Here:
5.7%
Texas:
8.0%
Students in private undergraduate colleges: 311
Here:
14.6%
Texas:
16.2%
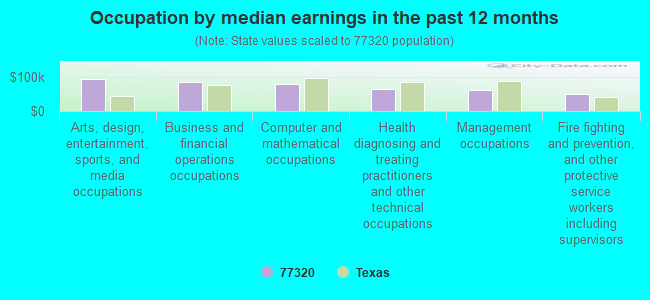
Occupation by median earnings in the past 12 months ($)
93,963Arts, design, entertainment, sports, and media occupations
83,149Business and financial operations occupations
77,897Computer and mathematical occupations
65,329Health diagnosing and treating practitioners and other technical occupations
60,184Management occupations
50,523Fire fighting and prevention, and other protective service workers including supervisors
Companies with federal contracts located in this zip code (HUNTSVILLE, TX):
TEXAS DEPARTMENT OF CRIMINAL J (HWY 75 N FM 2821) : $70,708 in 3 contractsfrom 2000 to 2003
$45,000 with Public Buildings Service for Maintenance, Repair or Alteration of Real Property -- Office Buildings. Signed on 2000-02-15. Completion date: 2000-12-15.
$25,707 with Air Force for Maintenance, Repair and Rebuilding of Equipment -- Vehicular Equipment Components. Signed on 2002-04-08. Completion date: 2002-05-08.
$1 with Public Buildings Service for Miscellaneous Furniture and Fixtures. Taking place in CA. Signed on 2003-04-15. Completion date: 2001-06-15.
NATIONAL LAB SPECIALISTS (103 ROUNDABOUT LN; small business)
$16,328 with Army for Hospital Furniture, Equipment, Utensils, and Supplies. Signed on 2004-10-29. Completion date: 2004-11-30.
RAVEN ENVIRONMENTAL SERVICES, (6 OAK BEND DRIVE; small business) : $15,808 in 2 contractsfrom 2005 to 2006
$7,927 with Army for Other Special Studies and Analyses. Signed on 2006-04-24. Completion date: 2006-06-16.
$7,881 with Army for Other Natural Resources and Conservation Services. Signed on 2005-12-12. Completion date: 2005-12-30.
MARTIN, W F (129 WATERWOOD; small business)
$6,825 with Army for Other Professional Services. Signed on 2006-03-16. Completion date: 2006-09-30.
Top industries in this zip code by the number of employees in 2005:
Other Services (except Public Administration): Religious Organizations (50-99 employees: 1 establishment, 10-19 employees: 1 establishment, 5-9 employees: 3 establishments, 1-4 employees: 1 establishment)
Accommodation and Food Services: Hotels (except Casino Hotels) and Motels (50-99: 1, 10-19: 1)
Real Estate and Rental and Leasing: Lessors of Residential Buildings and Dwellings (20-49: 1, 1-4: 1)
Construction: Plumbing, Heating, and Air-Conditioning Contractors (10-19: 2, 1-4: 2)
People in group quarters in 2010:
10,933 people in state prisons
112 people in local jails and other municipal confinement facilities
64 people in workers' group living quarters and job corps centers
49 people in residential treatment centers for juveniles (non-correctional)
45 people in emergency and transitional shelters (with sleeping facilities) for people experiencing homelessness
6 people in other noninstitutional facilities
People in group quarters in 2000:
11,148 people in state prisons
220 people in other noninstitutional group quarters
189 people in other types of correctional institutions
170 people in local jails and other confinement facilities (including police lockups)
24 people in homes for the mentally retarded
8 people in college dormitories (includes college quarters off campus)
2002 - 2018 National Fire Incident Reporting System (NFIRS) incidents
Based on the data from the years 2002 - 2018 the average number of fires per year is 107. The highest number of reported fires - 235 took place in 2011, and the least - 40 in 2013. The data has a decreasing trend.
When looking into fire subcategories, the most incidents belonged to: Outside Fires (60.4%), and Structure Fires (22.5%).
Fire incident types reported to NFIRS in Zip Code 77320


 Nearest zip codes: 77342, 77367, 77340, 77334, 75852, 77359.


 : $70,708 in 3 contracts from 2000 to 2003
 Based on the data from the years 2002 - 2018 the average number of fires per year is 107. The highest number of reported fires - 235 took place in 2011, and the least - 40 in 2013. The data has a decreasing trend.
 When looking into fire subcategories, the most incidents belonged to: Outside Fires (60.4%), and Structure Fires (22.5%).