Estimated zip code population in 2022: 30,308 Zip code population in 2010: 24,498 Zip code population in 2000: 14,470
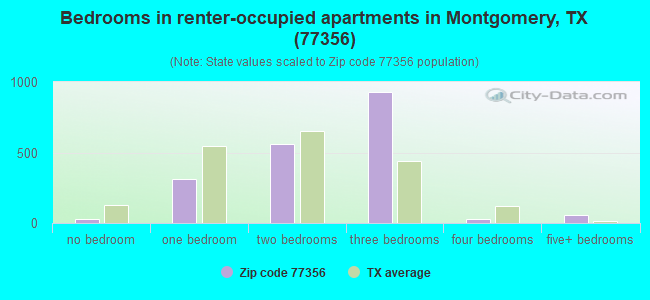
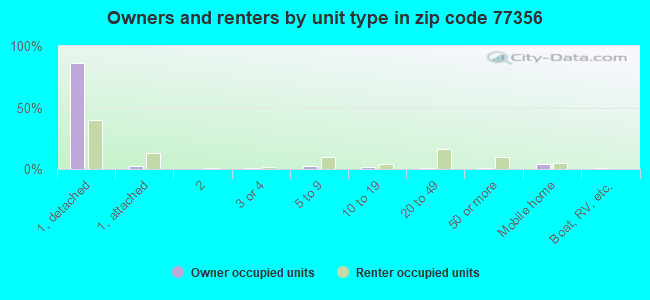
Houses and condos: 15,198 Renter-occupied apartments: 1,944
% of renters here:
15%
State:
38%
March 2022 cost of living index in zip code 77356: 97.3 (near average, U.S. average is 100)
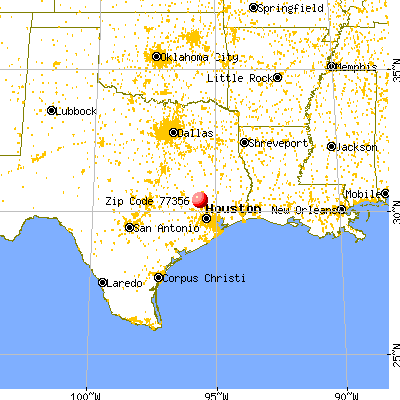
Land area: 130.1 sq. mi. Water area: 15.9 sq. mi.
Population density: 233 people per square mile
(very low).
OSM Map
General Map
Google Map
MSN Map
OSM Map
General Map
Google Map
MSN Map
OSM Map
General Map
Google Map
MSN Map
OSM Map
General Map
Google Map
MSN Map
Please wait while loading the map...
Real estate property taxes paid for housing units in 2022:
This zip code:
1.5% ($5,964)
Texas:
1.5% ($4,050)
Median real estate property taxes paid for housing units with mortgages in 2022: $6,475 (1.6%) Median real estate property taxes paid for housing units with no mortgage in 2022: $5,185 (1.4%)
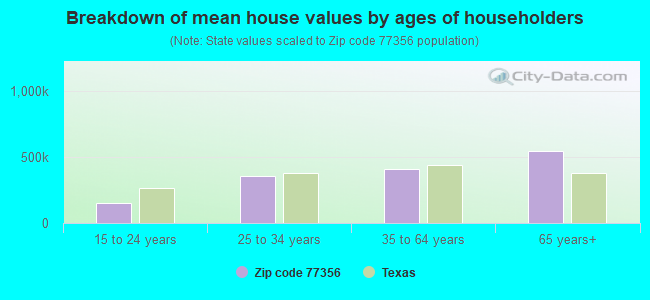
Estimated median house/condo value in 2022: $391,693
77356:
$391,693
Texas:
$275,400
According to our research of Texas and other state lists, there were 46 registered sex offenders living in 77356 zip code as of May 17, 2024. The ratio of all residents to sex offenders in zip code 77356 is 561 to 1. The ratio of registered sex offenders to all residents in this zip code is lower than the state average.
Median resident age:
This zip code:
49.1 years
Texas median age:
35.6 years
Average household size:
This zip code:
2.3 people
Texas:
2.6 people
Averages for the 2020 tax year for zip code 77356, filed in 2021:
Average Adjusted Gross Income (AGI) in 2020: $121,573 (Individual Income Tax Returns)
Here:
$121,573
State:
$77,054
Salary/wage: $90,609 (reported on 73.1% of returns)
Here:
$90,609
State:
$62,766
(% of AGI for various income ranges: 1123.6% for AGIs below $25k, 3193.4% for AGIs $25k-50k, 6022.6% for AGIs $50k-75k, 8702.6% for AGIs $75k-100k, 16100.1% for AGIs $100k-200k, 77526.7% for AGIs over 200k)
Taxable interest for individuals: $3,618 (reported on 37.5% of returns)
This zip code:
$3,618
Texas:
$2,665
(% of AGI for various income ranges: 31.5% for AGIs below $25k, 39.8% for AGIs $25k-50k, 74.3% for AGIs $50k-75k, 147.6% for AGIs $75k-100k, 215.4% for AGIs $100k-200k, 2095.8% for AGIs over 200k)
Ordinary dividends: $16,038 (reported on 30.1% of returns)
Here:
$16,038
State:
$10,044
(% of AGI for various income ranges: 67.0% for AGIs below $25k, 102.3% for AGIs $25k-50k, 183.0% for AGIs $50k-75k, 277.3% for AGIs $75k-100k, 708.8% for AGIs $100k-200k, 8507.7% for AGIs over 200k)
Net capital gain/loss in AGI: +$51,430 (reported on 29.0% of returns)
Here:
+$51,430
State:
+$39,590
(% of AGI for various income ranges: 17.3% for AGIs below $25k, 80.9% for AGIs $25k-50k, 174.5% for AGIs $50k-75k, 274.5% for AGIs $75k-100k, 834.2% for AGIs $100k-200k, 33277.8% for AGIs over 200k)
Profit/loss from business: +$19,735 (reported on 21.9% of returns)
Here:
+$19,735
State:
+$10,888
(% of AGI for various income ranges: 154.7% for AGIs below $25k, 258.5% for AGIs $25k-50k, 367.8% for AGIs $50k-75k, 498.3% for AGIs $75k-100k, 903.7% for AGIs $100k-200k, 5115.8% for AGIs over 200k)
Taxable individual retirement arrangement distribution: $39,718 (reported on 17.2% of returns)
77356:
$39,718
Texas:
$24,740
(% of AGI for various income ranges: 90.9% for AGIs below $25k, 248.1% for AGIs $25k-50k, 458.7% for AGIs $50k-75k, 924.0% for AGIs $75k-100k, 2237.2% for AGIs $100k-200k, 7008.8% for AGIs over 200k)
Self-employed (Keogh) retirement plans: $23,050 (reported on 0.9% of returns)
77356:
$23,050
Texas:
$29,298
(% of AGI for various income ranges: 48.3% for AGIs $100k-200k, 369.2% for AGIs over 200k)
Total itemized deductions: $39,718 (reported on 14.5% of returns)
Here:
$39,718
State:
$40,428
(% of AGI for various income ranges: 101.3% for AGIs below $25k, 244.0% for AGIs $25k-50k, 418.5% for AGIs $50k-75k, 638.2% for AGIs $75k-100k, 1263.7% for AGIs $100k-200k, 7629.5% for AGIs over 200k)
Charity contributions: $14,877 (reported on 12.2% of returns)
Here:
$14,877
State:
$18,201
(% of AGI for various income ranges: 7.2% for AGIs below $25k, 34.4% for AGIs $25k-50k, 65.0% for AGIs $50k-75k, 110.8% for AGIs $75k-100k, 343.8% for AGIs $100k-200k, 3079.8% for AGIs over 200k)
Taxes paid: $8,408 (reported on 14.3% of returns)
77356:
$8,408
State:
$7,821
(% of AGI for various income ranges: 22.1% for AGIs below $25k, 59.1% for AGIs $25k-50k, 105.3% for AGIs $50k-75k, 152.8% for AGIs $75k-100k, 316.4% for AGIs $100k-200k, 1350.9% for AGIs over 200k)
Earned income credit: $2,215 (reported on 9.4% of returns)
Here:
$2,215
State:
$2,584
(% of AGI for various income ranges: 80.3% for AGIs below $25k, 55.3% for AGIs $25k-50k, 1.0% for AGIs $50k-75k)
Percentage of individuals using paid preparers for their 2020 taxes: 90.6%
Here:
91%
State:
92%
(% for various income ranges: 89.9% for AGIs below $25k, 90.3% for AGIs $25k-50k, 90.2% for AGIs $50k-75k, 90.9% for AGIs $75k-100k, 91.5% for AGIs $100k-200k, 91.3% for AGIs over 200k)
Averages for the 2012 tax year for zip code 77356, filed in 2013:
Average Adjusted Gross Income (AGI) in 2012: $114,703 (Individual Income Tax Returns)
Here:
$114,703
State:
$65,384
Salary/wage: $86,315 (reported on 75.5% of returns)
Here:
$86,315
State:
$52,524
(% of AGI for various income ranges: 67.0% for AGIs below $25k, 68.7% for AGIs $25k-50k, 66.7% for AGIs $50k-75k, 62.6% for AGIs $75k-100k, 64.4% for AGIs $100k-200k, 49.4% for AGIs over 200k)
Taxable interest for individuals: $3,212 (reported on 43.7% of returns)
This zip code:
$3,212
Texas:
$2,372
(% of AGI for various income ranges: 2.3% for AGIs below $25k, 1.2% for AGIs $25k-50k, 0.9% for AGIs $50k-75k, 1.2% for AGIs $75k-100k, 1.1% for AGIs $100k-200k, 1.2% for AGIs over 200k)
Ordinary dividends: $12,103 (reported on 30.2% of returns)
Here:
$12,103
State:
$9,721
(% of AGI for various income ranges: 4.2% for AGIs below $25k, 2.4% for AGIs $25k-50k, 1.8% for AGIs $50k-75k, 2.4% for AGIs $75k-100k, 2.4% for AGIs $100k-200k, 3.9% for AGIs over 200k)
Net capital gain/loss in AGI: +$38,548 (reported on 28.3% of returns)
Here:
+$38,548
State:
+$35,319
(% of AGI for various income ranges: 0.7% for AGIs below $25k, 0.7% for AGIs $25k-50k, 1.2% for AGIs $50k-75k, 1.0% for AGIs $75k-100k, 2.2% for AGIs $100k-200k, 16.6% for AGIs over 200k)
Profit/loss from business: +$24,541 (reported on 22.3% of returns)
Here:
+$24,541
State:
+$13,732
(% of AGI for various income ranges: 10.5% for AGIs below $25k, 5.7% for AGIs $25k-50k, 4.0% for AGIs $50k-75k, 4.9% for AGIs $75k-100k, 4.5% for AGIs $100k-200k, 4.6% for AGIs over 200k)
Taxable individual retirement arrangement distribution: $33,423 (reported on 18.2% of returns)
77356:
$33,423
Texas:
$19,511
(% of AGI for various income ranges: 5.6% for AGIs below $25k, 5.3% for AGIs $25k-50k, 6.1% for AGIs $50k-75k, 6.9% for AGIs $75k-100k, 8.3% for AGIs $100k-200k, 3.6% for AGIs over 200k)
Self-employment retirement plans: $33,412 (reported on 1.3% of returns)
77356:
$33,412
Texas:
$23,938
(% of AGI for various income ranges: 0.2% for AGIs $25k-50k, 0.2% for AGIs $100k-200k, 0.6% for AGIs over 200k)
Total itemized deductions: $28,803 (15% of AGI, reported on 46.7% of returns)
Here:
$28,803
State:
$24,724
Here:
14.9% of AGI
State:
15.9% of AGI
(% of AGI for various income ranges: 20.4% for AGIs below $25k, 15.8% for AGIs $25k-50k, 15.6% for AGIs $50k-75k, 15.4% for AGIs $75k-100k, 14.7% for AGIs $100k-200k, 8.4% for AGIs over 200k)
Charity contributions: $7,030 (reported on 38.2% of returns)
Here:
$7,030
State:
$6,808
(% of AGI for various income ranges: 1.3% for AGIs below $25k, 1.8% for AGIs $25k-50k, 2.0% for AGIs $50k-75k, 2.3% for AGIs $75k-100k, 2.3% for AGIs $100k-200k, 2.5% for AGIs over 200k)
Taxes paid: $9,203 (reported on 46.2% of returns)
77356:
$9,203
State:
$6,921
(% of AGI for various income ranges: 4.9% for AGIs below $25k, 4.0% for AGIs $25k-50k, 4.4% for AGIs $50k-75k, 4.7% for AGIs $75k-100k, 5.1% for AGIs $100k-200k, 2.8% for AGIs over 200k)
Earned income credit: $2,114 (reported on 10.5% of returns)
Here:
$2,114
State:
$2,570
(% of AGI for various income ranges: 5.1% for AGIs below $25k, 0.9% for AGIs $25k-50k)
Percentage of individuals using paid preparers for their 2012 taxes: 50.7%
Here:
51%
State:
51%
(% for various income ranges: 43.3% for AGIs below $25k, 46.2% for AGIs $25k-50k, 49.7% for AGIs $50k-75k, 51.1% for AGIs $75k-100k, 54.4% for AGIs $100k-200k, 71.0% for AGIs over 200k)
Averages for the 2004 tax year for zip code 77356, filed in 2005:
Average Adjusted Gross Income (AGI) in 2004: $86,528 (Individual Income Tax Returns)
Here:
$86,528
State:
$47,881
Salary/wage: $67,652 (reported on 75.7% of returns)
Here:
$67,652
State:
$41,947
(% of AGI for various income ranges: 65.9% for AGIs $10k-25k, 70.1% for AGIs $25k-50k, 68.6% for AGIs $50k-75k, 65.7% for AGIs $75k-100k, 53.4% for AGIs over 100k)
Taxable interest for individuals: $3,691 (reported on 53.3% of returns)
This zip code:
$3,691
Texas:
$2,255
(% of AGI for various income ranges: 4.0% for AGIs $10k-25k, 2.5% for AGIs $25k-50k, 2.0% for AGIs $50k-75k, 1.6% for AGIs $75k-100k, 2.2% for AGIs over 100k)
Taxable dividends: $6,513 (reported on 35.9% of returns)
Here:
$6,513
State:
$4,261
(% of AGI for various income ranges: 3.5% for AGIs $10k-25k, 1.9% for AGIs $25k-50k, 2.0% for AGIs $50k-75k, 2.1% for AGIs $75k-100k, 2.8% for AGIs over 100k)
Net capital gain/loss: +$19,831 (reported on 34.3% of returns)
Here:
+$19,831
State:
+$16,110
(% of AGI for various income ranges: 0.7% for AGIs $10k-25k, 1.1% for AGIs $25k-50k, 1.6% for AGIs $50k-75k, 1.5% for AGIs $75k-100k, 10.9% for AGIs over 100k)
Profit/loss from business: +$18,363 (reported on 22.7% of returns)
Here:
+$18,363
State:
+$11,013
(% of AGI for various income ranges: 8.0% for AGIs $10k-25k, 5.6% for AGIs $25k-50k, 4.7% for AGIs $50k-75k, 3.5% for AGIs $75k-100k, 4.4% for AGIs over 100k)
IRA payment deduction: $3,874 (reported on 3.1% of returns)
77356:
$3,874
Texas:
$3,120
(% of AGI for various income ranges: 0.4% for AGIs $10k-25k, 0.3% for AGIs $25k-50k, 0.2% for AGIs $50k-75k, 0.2% for AGIs $75k-100k, 0.1% for AGIs over 100k)
Self-employed pension: $16,489 (reported on 1.6% of returns)
Here:
$16,489
Texas:
$16,401
(% of AGI for various income ranges: 0.1% for AGIs $25k-50k, 0.2% for AGIs $50k-75k, 0.1% for AGIs $75k-100k, 0.4% for AGIs over 100k)
Total itemized deductions: $23,974 (19% of AGI, reported on 49.3% of returns)
Here:
$23,974
State:
$19,631
Here:
19.2% of AGI
State:
18.9% of AGI
(% of AGI for various income ranges: 19.5% for AGIs $10k-25k, 19.7% for AGIs $25k-50k, 17.4% for AGIs $50k-75k, 18.2% for AGIs $75k-100k, 11.0% for AGIs over 100k)
Charity contributions deductions: $4,950 (4% of AGI, reported on 41.7% of returns)
Here:
$4,950
State:
$4,753
Here:
3.7% of AGI
State:
4.2% of AGI
(% of AGI for various income ranges: 1.6% for AGIs $10k-25k, 2.0% for AGIs $25k-50k, 2.2% for AGIs $50k-75k, 2.5% for AGIs $75k-100k, 2.5% for AGIs over 100k)
Total tax: $18,777 (reported on 80.7% of returns)
77356:
$18,777
State:
$9,058
(% of AGI for various income ranges: 4.3% for AGIs $10k-25k, 6.9% for AGIs $25k-50k, 9.3% for AGIs $50k-75k, 10.5% for AGIs $75k-100k, 21.6% for AGIs over 100k)
Earned income credit: $1,716 (reported on 9.4% of returns)
Here:
$1,716
State:
$2,024
Percentage of individuals using paid preparers for their 2004 taxes: 54.6%
Here:
55%
State:
57%
(% for various income ranges: 47.2% for AGIs below $10k, 53.8% for AGIs $10k-25k, 51.4% for AGIs $25k-50k, 53.7% for AGIs $50k-75k, 56.2% for AGIs $75k-100k, 63.2% for AGIs over 100k)
Household received Food Stamps/SNAP in the past 12 months: 432 Household did not receive Food Stamps/SNAP in the past 12 months: 12,678
Women who had a birth in the past 12 months: 600 (545 now married, 62 unmarried) Women who did not have a birth in the past 12 months: 5,373 (2,769 now married, 2,590 unmarried)
Housing units in zip code 77356 with a mortgage: 6,491 (335 second mortgage, 242 both second mortgage and home equity loan) Houses without a mortgage: 29
Median monthly owner costs for units with a mortgage: $2,283 Median monthly owner costs for units without a mortgage: $791
Residents with income below the poverty level in 2022:
This zip code:
7.8%
Whole state:
14.0%
Residents with income below 50% of the poverty level in 2022:
This zip code:
3.0%
Whole state:
7.4%
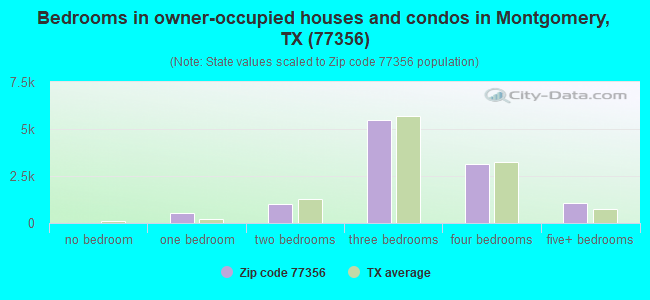
Median number of rooms in houses and condos:
Here:
6.9
State:
6.3
Median number of rooms in apartments:
Here:
4.8
State:
4.0
Notable locations in this zip code not listed on our city pages
Notable locations in zip code 77356: Scotts Ridge Recreation Site (A), Circle V Ranch (B), Peel Cabin (C), Pool Lookout (D), Kellys Pond Recreation Site (E), Montgomery Fire Department Station 51 - First Responders (F), Montgomery Fire Department Station 52 (G), Montgomery Fire Department Station 54 (H), Montgomery Fire Department Station 53 (I), Montgomery Fire Department Station 55 (J), Lake Conroe Fire Department - First Responders (K). Display/hide their locations on the map
Churches in zip code 77356 include: Brownwood Church (A), China Chapel (B), Montgomery United Methodist Church (C), Mount Mariah Church (D), Mount Pleasant Church (E), Scott Ridge Church (F). Display/hide their locations on the map
Cemeteries: Bethel Cemetery (1), Shannon Cemetery (2), Post Oak Cemetery (3), Mount Pleasant Cemetery (4), Montgomery Cemetery (5). Display/hide their locations on the map
Lakes and reservoirs: Camp Letcher Pond (A), Patterson Lake (B), Stewart Lake (C), Stanley Lake (D), Rampy Lake (E), Peel Lake (F), Lake Mount Pleasant (G), Sneed Lake (H). Display/hide their locations on the map
Streams, rivers, and creeks: Rush Creek (A), South Branch (B), Stewart Creek (C), Town Creek (D), Pole Creek (E), Little Lake Creek (F), Kidhaw Branch (G), Green Branch (H), Carwile Creek (I). Display/hide their locations on the map
In group quarters: 2 (-1 institutionalized population)
Size of family households: 5,293 2-persons, 2,059 3-persons, 1,114 4-persons, 960 5-persons, 54 6-persons, 84 7-or-more-persons
Size of nonfamily households: 3,365 1-person, 250 2-persons, 11 3-persons
4,337 married couples with children.
810 single-parent households (255 men, 555 women).
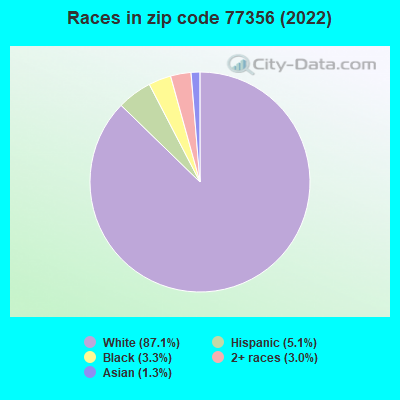
96.0% of residents of 77356 zip code speak English at home.
2.6% of residents speak Spanish at home (67% very well, 18% well, 9% not well, 5% not at all).
0.8% of residents speak other Indo-European language at home (100% very well).
0.9% of residents speak Asian or Pacific Island language at home (49% very well, 47% well, 4% not well).
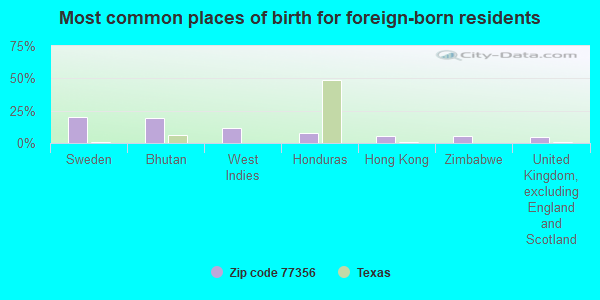
Foreign born population: 1,154 (3.8%) (59.3% of them are naturalized citizens)
This zip code:
3.8%
Whole state:
17.2%
20%Sweden
19%Bhutan
11%West Indies
8%Honduras
6%Hong Kong
5%Zimbabwe
5%United Kingdom, excluding England and Scotland
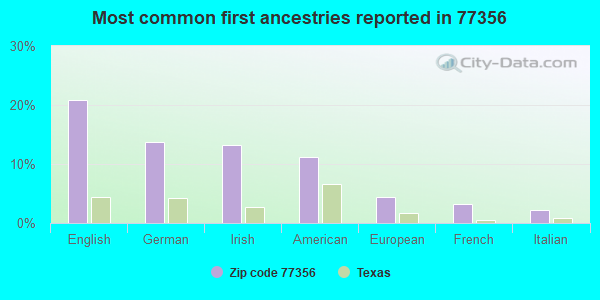
21%English
14%German
13%Irish
11%American
4%European
3%French
2%Italian
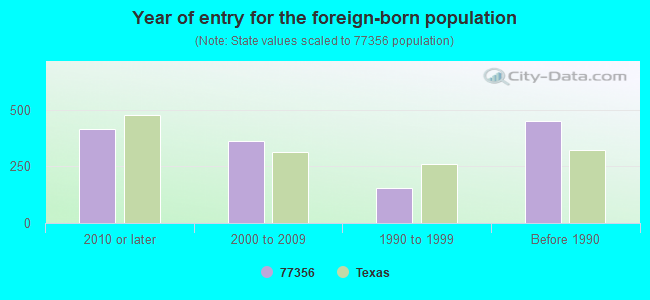
Year of entry for the foreign-born population
4132010 or later
3612000 to 2009
1531990 to 1999
449Before 1990
Facilities with environmental interests located in this zip code:
APRIL PLAZA MARINA WWTF (3 MI W STATE HWY 105 in MONTGOMERY, TX)
National Pollutant Discharge Elimination System NON-MAJOR (Tracking pollutant discharge elimination systems) - permit Business SIC classification: SPORTING AND RECREATIONAL CAMPS Organizations: APRIL PLAZA MARINA INC (CONTACT/OWNER)
Alternative names: APRIL PLAZA MARINA, INC.
AQUASOURCE UTILITY INC (2300FT N SPRING CREEK,5500FT E in MONTGOMERY, TX)
National Pollutant Discharge Elimination System NON-MAJOR (Tracking pollutant discharge elimination systems) - permit Business SIC classification: SEWERAGE SYSTEMS Organizations: AQUA UTILITIES, INC. (CONTACT/OWNER)
Alternative names: AQUA SOURCE UTILITY INC, BRUSHY CREEK UTILITY WWTF, BRUSHY CREEK WWTP
Housing units lacking complete plumbing facilities: 2.3% Housing units lacking complete kitchen facilities: 1.7%
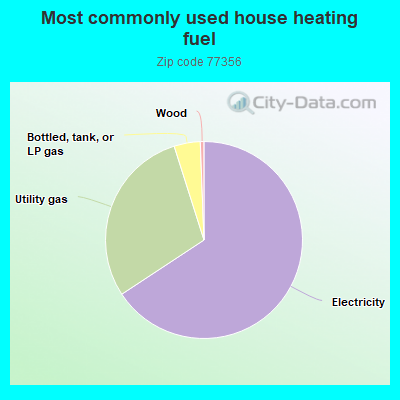
65.8%Electricity
29.4%Utility gas
4.3%Bottled, tank, or LP gas
0.6%Wood
Population in 1990: 12,002. Population change in the 1990s: +2,468 (+20.6%).
Place of birth for U.S.-born residents:
This state: 16,466
Northeast: 1,816
Midwest: 4,003
South: 3,841
West: 2,871
42% of the 77356 zip code residents lived in the same house 5 years ago. Out of people who lived in different houses, 34% lived in this county. Out of people who lived in different counties, 50% lived in Texas.
87% of the 77356 zip code residents lived in the same house 1 year ago. Out of people who lived in different houses, 26% moved from this county. Out of people who lived in different houses, 43% moved from different county within same state. Out of people who lived in different houses, 30% moved from different state. Out of people who lived in different houses, 5% moved from abroad.
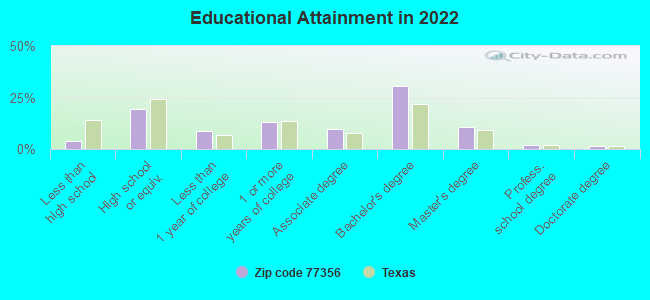
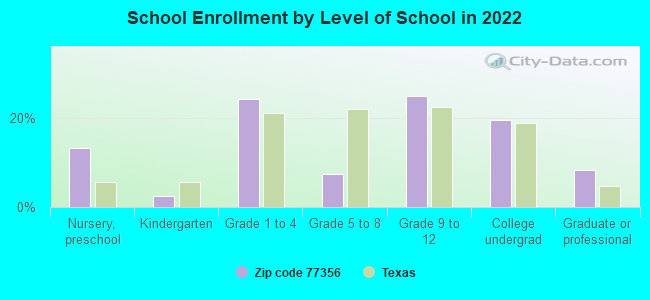
Private vs. public school enrollment:
Students in private schools in grades 1 to 8 (elementary and middle school): 101
Here:
5.1%
Texas:
8.8%
Students in private schools in grades 9 to 12 (high school): 52
Here:
3.4%
Texas:
8.0%
Students in private undergraduate colleges: 271
Here:
22.2%
Texas:
16.2%
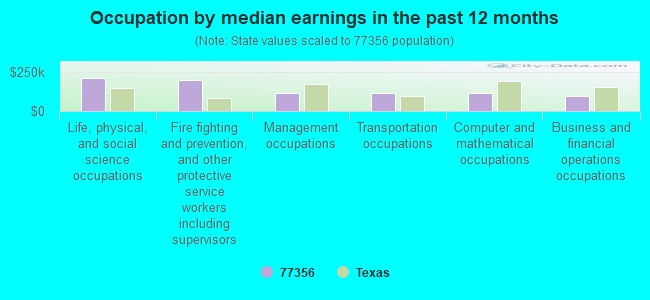
Occupation by median earnings in the past 12 months ($)
215,699Life, physical, and social science occupations
202,524Fire fighting and prevention, and other protective service workers including supervisors
115,131Management occupations
114,839Transportation occupations
113,893Computer and mathematical occupations
96,271Business and financial operations occupations
Companies with federal contracts located in this zip code (MONTGOMERY, TX):
DEL LAGO PARTNERS LP (600 DEL LAGO BLVD; small business) : $170,940 in 13 contractsfrom 2000 to 2006
Contracts for Lodging - Hotel/Motel, Lease or Rental of Facilities -- Conference Space and Facilities, by Army, NASA Signed by year:2000: $57,498; 2001: $37,558; 2002: $0; 2003: $0; 2004: $34,222; 2005: $53,414; 2006: -$11,752.
Biggest contracts:
$57,498 with Army for Lodging - Hotel/Motel. Signed on 2000-07-27. Completion date: 2000-08-06.
$37,558, same as above.Signed on 2001-11-20. Completion date: 2001-12-03.
$19,888, same as above.Signed on 2005-10-03. Completion date: 2005-10-21.
$19,671 with Army for Lease or Rental of Facilities -- Conference Space and Facilities. Signed on 2005-05-18. Completion date: 2005-08-07.
FMW DISTRIBUTORS, INC (58 BROOKGREEN CIRCLE S; small business) : $41,802 in 3 contractsfrom 2002 to 2004
$32,748 with Navy for Valves, Nonpowered. Taking place in CA. Signed on 2002-03-28. Completion date: 2002-07-31.
$5,071 with Army for Compressors and Vacuum Pumps. Signed on 2003-09-27. Completion date: 2003-09-10.
$3,983 with Navy for Air Conditioning Equipment. Signed on 2004-08-27. Completion date: 2004-09-10.
ADVANCED CHEMISTRY & TECHNOLOG (10486 COMMERCE ROW; small business) : $15,905 in 6 contractsfrom 2004 to 2005
Contracts for Preservative and Sealing Compounds by Army Signed by year:2000: $0; 2001: $0; 2002: $0; 2003: $0; 2004: $6,087; 2005: $9,818; 2006: $0.
Biggest contracts:
$5,632 with Army for Preservative and Sealing Compounds. Signed on 2004-12-22. Completion date: 2005-01-21.
$4,493, same as above.Signed on 2005-08-22. Completion date: 2005-09-06.
$2,819, same as above.Signed on 2005-06-16. Completion date: 2005-07-15.
$1,937, same as above.Signed on 2005-08-31. Completion date: 2005-09-16.
PENDULUM STRENGTH TRAINING SOL (147 PARKWAY; small business)
$7,624 with Navy for Athletic and Sporting Equipment. Taking place in VA. Signed on 2006-04-28. Completion date: 2006-07-10.
Top industries in this zip code by the number of employees in 2005:
Accommodation and Food Services: Hotels (except Casino Hotels) and Motels (100-249: 1, 10-19: 1)
Arts, Entertainment, and Recreation: Marinas (100-249: 1, 5-9: 1)
Other Services (except Public Administration): Other Similar Organizations (except Business, Professional, Labor, and Political Organizations) (20-49: 3, 10-19: 1, 5-9: 2, 1-4: 5)
Arts, Entertainment, and Recreation: Golf Courses and Country Clubs (50-99: 1)
Other Services (except Public Administration): Religious Organizations (10-19: 4, 1-4: 4)
Fatal accident statistics in 2014:
Fatal accident count: 6
Vehicles involved in fatal accidents: 8
Fatal accidents caused by drunken drivers: 4
Fatalities: 6
Persons involved in fatal accidents: 12
Pedestrians involved in fatal accidents: 0
Fatal accident statistics in 2013:
Fatal accident count: 1
Vehicles involved in fatal accidents: 1
Fatal accidents caused by drunken drivers: 0
Fatalities: 1
Persons involved in fatal accidents: 1
Pedestrians involved in fatal accidents: 0
Home Mortgage Disclosure Act Aggregated Statistics For Year 2009 (Based on 8 partial tracts)
A) FHA, FSA/RHS & VA Home Purchase Loans
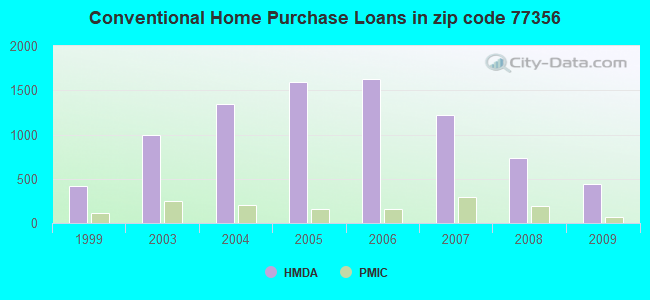
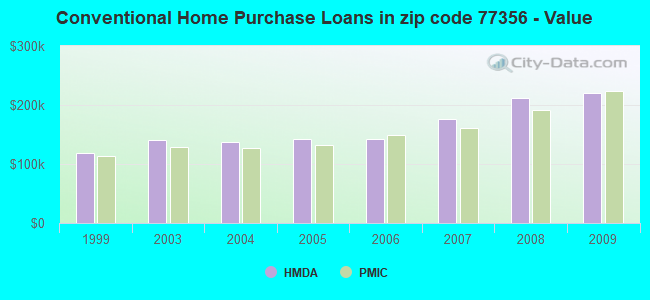
B) Conventional Home Purchase Loans
C) Refinancings
D) Home Improvement Loans
E) Loans on Dwellings For 5+ Families
F) Non-occupant Loans on < 5 Family Dwellings (A B C & D)
G) Loans On Manufactured Home Dwelling (A B C & D)
Number
Average Value
Number
Average Value
Number
Average Value
Number
Average Value
Number
Average Value
Number
Average Value
Number
Average Value
LOANS ORIGINATED
190
$165,365
445
$219,550
840
$233,378
39
$69,983
1
$500,400
226
$206,060
9
$62,649
APPLICATIONS APPROVED, NOT ACCEPTED
15
$143,633
43
$228,066
76
$183,777
8
$48,931
0
$0
22
$226,485
1
$92,430
APPLICATIONS DENIED
40
$150,473
85
$184,758
294
$210,499
49
$46,363
0
$0
57
$178,780
15
$57,954
APPLICATIONS WITHDRAWN
21
$180,657
40
$222,289
159
$203,651
9
$89,503
0
$0
32
$212,612
1
$24,320
FILES CLOSED FOR INCOMPLETENESS
4
$155,965
8
$204,414
56
$192,333
6
$60,878
0
$0
11
$197,132
3
$59,493
Aggregated Statistics For Year 2008 (Based on 8 partial tracts)
A) FHA, FSA/RHS & VA Home Purchase Loans
B) Conventional Home Purchase Loans
C) Refinancings
D) Home Improvement Loans
F) Non-occupant Loans on < 5 Family Dwellings (A B C & D)
G) Loans On Manufactured Home Dwelling (A B C & D)
Number
Average Value
Number
Average Value
Number
Average Value
Number
Average Value
Number
Average Value
Number
Average Value
LOANS ORIGINATED
142
$163,441
731
$212,515
428
$209,058
87
$78,392
277
$207,801
15
$58,353
APPLICATIONS APPROVED, NOT ACCEPTED
5
$212,188
86
$225,269
67
$205,366
22
$46,264
29
$232,052
10
$68,977
APPLICATIONS DENIED
25
$151,072
120
$167,192
237
$192,476
84
$55,491
58
$174,612
16
$59,249
APPLICATIONS WITHDRAWN
17
$173,359
86
$175,815
142
$184,300
7
$195,616
38
$174,526
1
$34,750
FILES CLOSED FOR INCOMPLETENESS
2
$153,600
28
$232,514
31
$239,228
2
$19,620
7
$217,781
1
$34,750
Aggregated Statistics For Year 2007 (Based on 8 partial tracts)
A) FHA, FSA/RHS & VA Home Purchase Loans
B) Conventional Home Purchase Loans
C) Refinancings
D) Home Improvement Loans
F) Non-occupant Loans on < 5 Family Dwellings (A B C & D)
G) Loans On Manufactured Home Dwelling (A B C & D)
Number
Average Value
Number
Average Value
Number
Average Value
Number
Average Value
Number
Average Value
Number
Average Value
LOANS ORIGINATED
56
$141,493
1,220
$175,724
471
$218,079
70
$55,973
359
$168,660
17
$67,836
APPLICATIONS APPROVED, NOT ACCEPTED
3
$134,873
205
$179,301
98
$200,086
24
$47,988
53
$202,334
10
$67,114
APPLICATIONS DENIED
16
$120,940
298
$211,452
323
$201,034
117
$93,366
106
$260,301
18
$62,333
APPLICATIONS WITHDRAWN
10
$125,391
127
$172,552
141
$191,363
16
$94,047
37
$169,650
5
$100,790
FILES CLOSED FOR INCOMPLETENESS
1
$141,080
70
$193,888
57
$242,109
2
$45,000
16
$190,127
0
$0
Aggregated Statistics For Year 2006 (Based on 8 partial tracts)
A) FHA, FSA/RHS & VA Home Purchase Loans
B) Conventional Home Purchase Loans
C) Refinancings
D) Home Improvement Loans
E) Loans on Dwellings For 5+ Families
F) Non-occupant Loans on < 5 Family Dwellings (A B C & D)
G) Loans On Manufactured Home Dwelling (A B C & D)
Number
Average Value
Number
Average Value
Number
Average Value
Number
Average Value
Number
Average Value
Number
Average Value
Number
Average Value
LOANS ORIGINATED
53
$141,719
1,630
$142,494
446
$221,388
102
$57,414
1
$1,024,800
424
$145,178
26
$78,998
APPLICATIONS APPROVED, NOT ACCEPTED
1
$32,660
229
$137,048
87
$214,566
34
$58,529
0
$0
54
$148,276
20
$61,795
APPLICATIONS DENIED
11
$103,755
450
$154,355
346
$176,041
117
$48,863
0
$0
142
$152,120
43
$53,922
APPLICATIONS WITHDRAWN
8
$136,646
234
$186,227
189
$197,048
20
$90,846
0
$0
53
$211,771
5
$67,040
FILES CLOSED FOR INCOMPLETENESS
0
$0
41
$179,318
79
$213,134
2
$149,820
0
$0
8
$204,452
0
$0
Aggregated Statistics For Year 2005 (Based on 8 partial tracts)
A) FHA, FSA/RHS & VA Home Purchase Loans
B) Conventional Home Purchase Loans
C) Refinancings
D) Home Improvement Loans
E) Loans on Dwellings For 5+ Families
F) Non-occupant Loans on < 5 Family Dwellings (A B C & D)
G) Loans On Manufactured Home Dwelling (A B C & D)
Number
Average Value
Number
Average Value
Number
Average Value
Number
Average Value
Number
Average Value
Number
Average Value
Number
Average Value
LOANS ORIGINATED
45
$125,607
1,593
$141,734
551
$189,806
75
$54,213
0
$0
419
$131,715
26
$72,556
APPLICATIONS APPROVED, NOT ACCEPTED
5
$84,888
196
$149,524
80
$179,634
22
$33,680
1
$60,000
27
$102,031
18
$45,132
APPLICATIONS DENIED
8
$99,764
414
$178,137
405
$149,801
118
$50,071
0
$0
109
$130,350
47
$59,923
APPLICATIONS WITHDRAWN
4
$91,992
256
$171,250
223
$186,890
58
$201,056
0
$0
71
$119,708
9
$92,586
FILES CLOSED FOR INCOMPLETENESS
1
$132,000
38
$164,281
180
$168,361
2
$28,900
0
$0
21
$115,628
0
$0
Aggregated Statistics For Year 2004 (Based on 8 partial tracts)
A) FHA, FSA/RHS & VA Home Purchase Loans
B) Conventional Home Purchase Loans
C) Refinancings
D) Home Improvement Loans
E) Loans on Dwellings For 5+ Families
F) Non-occupant Loans on < 5 Family Dwellings (A B C & D)
G) Loans On Manufactured Home Dwelling (A B C & D)
Number
Average Value
Number
Average Value
Number
Average Value
Number
Average Value
Number
Average Value
Number
Average Value
Number
Average Value
LOANS ORIGINATED
62
$118,067
1,344
$137,309
761
$174,101
76
$66,256
1
$561,600
328
$145,984
28
$69,049
APPLICATIONS APPROVED, NOT ACCEPTED
4
$80,142
165
$113,374
147
$149,677
12
$42,035
0
$0
38
$97,788
18
$42,921
APPLICATIONS DENIED
10
$84,954
265
$125,047
462
$150,116
88
$38,421
0
$0
62
$148,031
49
$43,036
APPLICATIONS WITHDRAWN
12
$122,938
164
$144,969
246
$149,317
11
$56,371
0
$0
28
$145,687
7
$101,177
FILES CLOSED FOR INCOMPLETENESS
0
$0
59
$138,511
156
$168,793
9
$69,242
0
$0
12
$120,497
1
$83,400
Aggregated Statistics For Year 2003 (Based on 8 partial tracts)
A) FHA, FSA/RHS & VA Home Purchase Loans
B) Conventional Home Purchase Loans
C) Refinancings
D) Home Improvement Loans
E) Loans on Dwellings For 5+ Families
F) Non-occupant Loans on < 5 Family Dwellings (A B C & D)
Number
Average Value
Number
Average Value
Number
Average Value
Number
Average Value
Number
Average Value
Number
Average Value
LOANS ORIGINATED
60
$116,456
990
$140,390
1,503
$174,757
70
$36,479
2
$596,270
313
$140,964
APPLICATIONS APPROVED, NOT ACCEPTED
6
$139,665
128
$121,428
186
$164,113
14
$39,876
0
$0
47
$140,142
APPLICATIONS DENIED
15
$115,396
193
$111,624
593
$140,838
69
$27,934
0
$0
57
$109,920
APPLICATIONS WITHDRAWN
12
$95,892
112
$138,786
307
$138,114
7
$151,193
0
$0
25
$123,654
FILES CLOSED FOR INCOMPLETENESS
7
$104,393
54
$152,897
78
$182,601
4
$119,788
0
$0
10
$103,754
Aggregated Statistics For Year 1999 (Based on 4 partial tracts)
A) FHA, FSA/RHS & VA Home Purchase Loans
B) Conventional Home Purchase Loans
C) Refinancings
D) Home Improvement Loans
F) Non-occupant Loans on < 5 Family Dwellings (A B C & D)
2002 - 2018 National Fire Incident Reporting System (NFIRS) incidents
According to the data from the years 2002 - 2018 the average number of fire incidents per year is 192. The highest number of fire incidents - 342 took place in 2011, and the least - 95 in 2002. The data has a rising trend.
When looking into fire subcategories, the most incidents belonged to: Outside Fires (57.1%), and Structure Fires (31.7%).
Fire incident types reported to NFIRS in Zip Code 77356


 Nearest zip codes: 77873, 77316, 77363, 77876, 77318, 77340.


 According to the data from the years 2002 - 2018 the average number of fire incidents per year is 192. The highest number of fire incidents - 342 took place in 2011, and the least - 95 in 2002. The data has a rising trend.
 When looking into fire subcategories, the most incidents belonged to: Outside Fires (57.1%), and Structure Fires (31.7%).