Estimated zip code population in 2022: 7,467 Zip code population in 2010: 7,161 Zip code population in 2000: 7,047
Houses and condos: 4,003 Renter-occupied apartments: 681
% of renters here:
23%
State:
38%
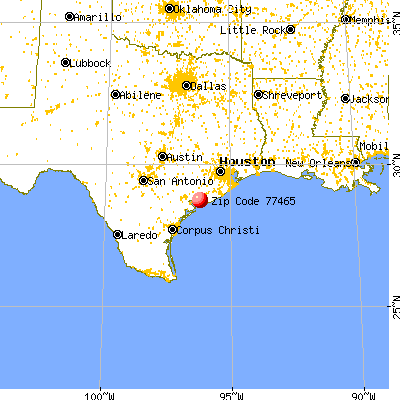
March 2022 cost of living index in zip code 77465: 79.1 (low, U.S. average is 100)
Land area: 194.8 sq. mi. Water area: 14.0 sq. mi.
Population density: 38 people per square mile
(very low).
OSM Map
General Map
Google Map
MSN Map
OSM Map
General Map
Google Map
MSN Map
OSM Map
General Map
Google Map
MSN Map
OSM Map
General Map
Google Map
MSN Map
Please wait while loading the map...
Real estate property taxes paid for housing units in 2022:
This zip code:
1.0% ($1,974)
Texas:
1.5% ($4,050)
Median real estate property taxes paid for housing units with mortgages in 2022: $3,177 (1.2%) Median real estate property taxes paid for housing units with no mortgage in 2022: $1,689 (0.9%)
Estimated median house/condo value in 2022: $207,360
77465:
$207,360
Texas:
$275,400
According to our research of Texas and other state lists, there were 19 registered sex offenders living in 77465 zip code as of May 23, 2024. The ratio of all residents to sex offenders in zip code 77465 is 383 to 1. The ratio of registered sex offenders to all residents in this zip code is near the state average.
Median resident age:
This zip code:
43.1 years
Texas median age:
35.6 years
Average household size:
This zip code:
2.5 people
Texas:
2.6 people
Averages for the 2020 tax year for zip code 77465, filed in 2021:
Average Adjusted Gross Income (AGI) in 2020: $56,698 (Individual Income Tax Returns)
Here:
$56,698
State:
$77,054
Salary/wage: $49,081 (reported on 77.3% of returns)
Here:
$49,081
State:
$62,766
(% of AGI for various income ranges: 1151.0% for AGIs below $25k, 3614.7% for AGIs $25k-50k, 6631.7% for AGIs $50k-75k, 9826.8% for AGIs $75k-100k, 17084.6% for AGIs $100k-200k, 37046.7% for AGIs over 200k)
Taxable interest for individuals: $1,978 (reported on 23.7% of returns)
This zip code:
$1,978
Texas:
$2,665
(% of AGI for various income ranges: 10.7% for AGIs below $25k, 21.7% for AGIs $25k-50k, 41.4% for AGIs $50k-75k, 68.9% for AGIs $75k-100k, 189.6% for AGIs $100k-200k, 1913.3% for AGIs over 200k)
Ordinary dividends: $4,245 (reported on 10.3% of returns)
Here:
$4,245
State:
$10,044
(% of AGI for various income ranges: 9.7% for AGIs below $25k, 25.0% for AGIs $25k-50k, 84.1% for AGIs $50k-75k, 71.1% for AGIs $75k-100k, 109.2% for AGIs $100k-200k, 1753.3% for AGIs over 200k)
Net capital gain/loss in AGI: +$22,674 (reported on 10.6% of returns)
Here:
+$22,674
State:
+$39,590
(% of AGI for various income ranges: 5.5% for AGIs below $25k, 20.8% for AGIs $25k-50k, 79.7% for AGIs $50k-75k, 117.4% for AGIs $75k-100k, 605.0% for AGIs $100k-200k, 18766.7% for AGIs over 200k)
Profit/loss from business: +$6,368 (reported on 24.3% of returns)
Here:
+$6,368
State:
+$10,888
(% of AGI for various income ranges: 296.4% for AGIs below $25k, 96.2% for AGIs $25k-50k, 216.9% for AGIs $50k-75k, 107.4% for AGIs $75k-100k, 195.8% for AGIs $100k-200k, 1693.3% for AGIs over 200k)
Taxable individual retirement arrangement distribution: $20,861 (reported on 7.2% of returns)
77465:
$20,861
Texas:
$24,740
(% of AGI for various income ranges: 38.0% for AGIs below $25k, 76.8% for AGIs $25k-50k, 172.1% for AGIs $50k-75k, 332.1% for AGIs $75k-100k, 1198.3% for AGIs $100k-200k)
Total itemized deductions: $47,680 (reported on 3.1% of returns)
Here:
$47,680
State:
$40,428
(% of AGI for various income ranges: 94.0% for AGIs $25k-50k, 360.0% for AGIs $50k-75k, 531.7% for AGIs $100k-200k, 6280.0% for AGIs over 200k)
Charity contributions: $21,250 (reported on 2.5% of returns)
Here:
$21,250
State:
$18,201
(% of AGI for various income ranges: 47.6% for AGIs $50k-75k, 188.8% for AGIs $100k-200k, 3696.7% for AGIs over 200k)
Taxes paid: $6,230 (reported on 3.1% of returns)
77465:
$6,230
State:
$7,821
(% of AGI for various income ranges: 74.1% for AGIs $50k-75k, 105.8% for AGIs $100k-200k, 513.3% for AGIs over 200k)
Earned income credit: $2,481 (reported on 24.6% of returns)
Here:
$2,481
State:
$2,584
(% of AGI for various income ranges: 155.1% for AGIs below $25k, 101.8% for AGIs $25k-50k)
Percentage of individuals using paid preparers for their 2020 taxes: 87.5%
Here:
88%
State:
92%
(% for various income ranges: 83.2% for AGIs below $25k, 91.0% for AGIs $25k-50k, 90.2% for AGIs $50k-75k, 86.2% for AGIs $75k-100k, 90.0% for AGIs $100k-200k, 100.0% for AGIs over 200k)
Averages for the 2012 tax year for zip code 77465, filed in 2013:
Average Adjusted Gross Income (AGI) in 2012: $47,199 (Individual Income Tax Returns)
Here:
$47,199
State:
$65,384
Salary/wage: $42,260 (reported on 77.2% of returns)
Here:
$42,260
State:
$52,524
(% of AGI for various income ranges: 65.2% for AGIs below $25k, 76.6% for AGIs $25k-50k, 75.8% for AGIs $50k-75k, 78.2% for AGIs $75k-100k, 77.0% for AGIs $100k-200k, 30.5% for AGIs over 200k)
Taxable interest for individuals: $1,234 (reported on 26.2% of returns)
This zip code:
$1,234
Texas:
$2,372
(% of AGI for various income ranges: 0.8% for AGIs below $25k, 0.7% for AGIs $25k-50k, 0.5% for AGIs $50k-75k, 0.5% for AGIs $75k-100k, 0.6% for AGIs $100k-200k, 1.1% for AGIs over 200k)
Ordinary dividends: $3,482 (reported on 11.2% of returns)
Here:
$3,482
State:
$9,721
(% of AGI for various income ranges: 0.6% for AGIs below $25k, 1.0% for AGIs $25k-50k, 0.6% for AGIs $50k-75k, 0.9% for AGIs $75k-100k, 0.7% for AGIs $100k-200k, 1.2% for AGIs over 200k)
Net capital gain/loss in AGI: +$4,162 (reported on 9.9% of returns)
Here:
+$4,162
State:
+$35,319
(% of AGI for various income ranges: 0.4% for AGIs $25k-50k, 0.9% for AGIs $75k-100k, 0.6% for AGIs $100k-200k, 3.8% for AGIs over 200k)
Profit/loss from business: +$10,366 (reported on 24.8% of returns)
Here:
+$10,366
State:
+$13,732
(% of AGI for various income ranges: 21.7% for AGIs below $25k, 4.6% for AGIs $25k-50k, 4.0% for AGIs $50k-75k, 2.6% for AGIs $75k-100k, 4.1% for AGIs $100k-200k)
Taxable individual retirement arrangement distribution: $13,367 (reported on 7.1% of returns)
77465:
$13,367
Texas:
$19,511
(% of AGI for various income ranges: 1.6% for AGIs below $25k, 2.2% for AGIs $25k-50k, 1.9% for AGIs $50k-75k, 2.8% for AGIs $75k-100k, 2.8% for AGIs $100k-200k)
Total itemized deductions: $19,652 (22% of AGI, reported on 16.3% of returns)
Here:
$19,652
State:
$24,724
Here:
22.3% of AGI
State:
15.9% of AGI
(% of AGI for various income ranges: 4.6% for AGIs below $25k, 7.5% for AGIs $25k-50k, 8.6% for AGIs $50k-75k, 7.8% for AGIs $75k-100k, 6.8% for AGIs $100k-200k, 4.4% for AGIs over 200k)
Charity contributions: $4,388 (reported on 11.6% of returns)
Here:
$4,388
State:
$6,808
(% of AGI for various income ranges: 0.2% for AGIs below $25k, 0.6% for AGIs $25k-50k, 0.9% for AGIs $50k-75k, 1.1% for AGIs $75k-100k, 2.5% for AGIs $100k-200k)
Taxes paid: $3,926 (reported on 16.0% of returns)
77465:
$3,926
State:
$6,921
(% of AGI for various income ranges: 0.8% for AGIs below $25k, 1.2% for AGIs $25k-50k, 1.2% for AGIs $50k-75k, 1.5% for AGIs $75k-100k, 1.7% for AGIs $100k-200k, 1.3% for AGIs over 200k)
Earned income credit: $2,485 (reported on 27.6% of returns)
Here:
$2,485
State:
$2,570
(% of AGI for various income ranges: 9.9% for AGIs below $25k, 1.7% for AGIs $25k-50k)
Percentage of individuals using paid preparers for their 2012 taxes: 57.5%
Here:
57%
State:
51%
(% for various income ranges: 53.8% for AGIs below $25k, 60.3% for AGIs $25k-50k, 53.8% for AGIs $50k-75k, 65.0% for AGIs $75k-100k, 64.3% for AGIs $100k-200k, 75.0% for AGIs over 200k)
Averages for the 2004 tax year for zip code 77465, filed in 2005:
Average Adjusted Gross Income (AGI) in 2004: $30,095 (Individual Income Tax Returns)
Here:
$30,095
State:
$47,881
Salary/wage: $28,767 (reported on 77.1% of returns)
Here:
$28,767
State:
$41,947
(% of AGI for various income ranges: 131.8% for AGIs below $10k, 68.8% for AGIs $10k-25k, 77.8% for AGIs $25k-50k, 76.7% for AGIs $50k-75k, 80.9% for AGIs $75k-100k, 56.9% for AGIs over 100k)
Taxable interest for individuals: $1,742 (reported on 30.9% of returns)
This zip code:
$1,742
Texas:
$2,255
(% of AGI for various income ranges: 5.4% for AGIs below $10k, 2.2% for AGIs $10k-25k, 1.5% for AGIs $25k-50k, 1.6% for AGIs $50k-75k, 0.7% for AGIs $75k-100k, 2.1% for AGIs over 100k)
Taxable dividends: $1,648 (reported on 13.0% of returns)
Here:
$1,648
State:
$4,261
(% of AGI for various income ranges: 3.1% for AGIs below $10k, 0.7% for AGIs $10k-25k, 0.7% for AGIs $25k-50k, 0.6% for AGIs $50k-75k, 0.4% for AGIs $75k-100k, 0.8% for AGIs over 100k)
Net capital gain/loss: +$5,842 (reported on 10.6% of returns)
Here:
+$5,842
State:
+$16,110
(% of AGI for various income ranges: 2.8% for AGIs below $10k, 0.1% for AGIs $10k-25k, 0.1% for AGIs $25k-50k, 0.2% for AGIs $50k-75k, 0.1% for AGIs $75k-100k, 8.8% for AGIs over 100k)
Profit/loss from business: +$6,587 (reported on 23.9% of returns)
Here:
+$6,587
State:
+$11,013
(% of AGI for various income ranges: 32.1% for AGIs below $10k, 13.9% for AGIs $10k-25k, 3.7% for AGIs $25k-50k, 2.2% for AGIs $50k-75k, 2.8% for AGIs $75k-100k, 1.3% for AGIs over 100k)
IRA payment deduction: $3,267 (reported on 1.1% of returns)
77465:
$3,267
Texas:
$3,120
Total itemized deductions: $16,175 (25% of AGI, reported on 12.7% of returns)
Here:
$16,175
State:
$19,631
Here:
24.5% of AGI
State:
18.9% of AGI
(% of AGI for various income ranges: 7.6% for AGIs below $10k, 4.7% for AGIs $10k-25k, 6.8% for AGIs $25k-50k, 8.2% for AGIs $50k-75k, 7.5% for AGIs $75k-100k, 6.5% for AGIs over 100k)
Charity contributions deductions: $3,996 (6% of AGI, reported on 10.3% of returns)
Here:
$3,996
State:
$4,753
Here:
5.7% of AGI
State:
4.2% of AGI
(% of AGI for various income ranges: 0.4% for AGIs below $10k, 0.5% for AGIs $10k-25k, 0.8% for AGIs $25k-50k, 1.4% for AGIs $50k-75k, 1.7% for AGIs $75k-100k, 2.5% for AGIs over 100k)
Total tax: $4,522 (reported on 63.0% of returns)
77465:
$4,522
State:
$9,058
(% of AGI for various income ranges: 7.1% for AGIs below $10k, 4.3% for AGIs $10k-25k, 5.6% for AGIs $25k-50k, 9.2% for AGIs $50k-75k, 11.2% for AGIs $75k-100k, 17.3% for AGIs over 100k)
Earned income credit: $2,179 (reported on 31.5% of returns)
Here:
$2,179
State:
$2,024
Percentage of individuals using paid preparers for their 2004 taxes: 60.7%
Here:
61%
State:
57%
(% for various income ranges: 58.9% for AGIs below $10k, 59.3% for AGIs $10k-25k, 62.9% for AGIs $25k-50k, 66.7% for AGIs $50k-75k, 53.0% for AGIs $75k-100k, 67.5% for AGIs over 100k)
Household received Food Stamps/SNAP in the past 12 months: 356 Household did not receive Food Stamps/SNAP in the past 12 months: 2,598
Women who had a birth in the past 12 months: 24 (0 now married, 23 unmarried) Women who did not have a birth in the past 12 months: 1,159 (665 now married, 488 unmarried)
Housing units in zip code 77465 with a mortgage: 757 Median monthly owner costs for units with a mortgage: $1,431 Median monthly owner costs for units without a mortgage: $525
Residents with income below the poverty level in 2022:
This zip code:
13.6%
Whole state:
14.0%
Residents with income below 50% of the poverty level in 2022:
This zip code:
10.4%
Whole state:
7.4%
Median number of rooms in houses and condos:
Here:
5.6
State:
6.3
Median number of rooms in apartments:
Here:
5.5
State:
4.0
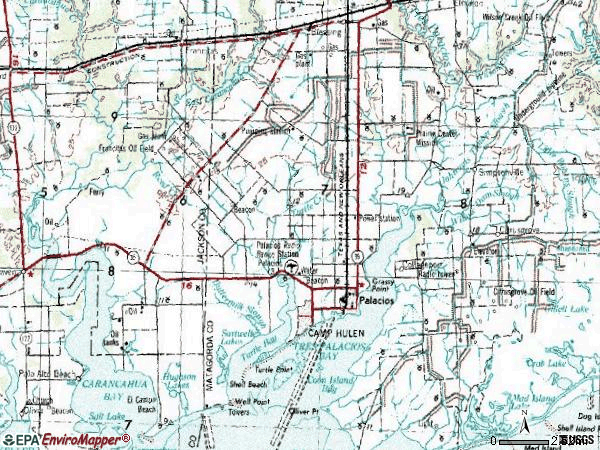
Notable locations in this zip code not listed on our city pages
Notable locations in zip code 77465: Citrus Grove School (A), El Campo Club (B), East Bay Yacht Harbor Marina (C), Palacios Volunteer Fire Department (D), Tres Palacios Oaks Volunteer Fire Department (E), Matagorda County Sheriff's Office (F), Carancahua Community Volunteer Fire Department (G), Matagorda County Emergency Medical Services (H), Palacios Area Historical Association (I). Display/hide their locations on the map
Churches in zip code 77465 include: Ashby Church (A), Prairie Center Mission (B), Carancahua Church (C), Saint Mary Church (D), Solid Rock Fellowship Church (E), United Pentecostal Church (F), Saint Johns Episcopal Church (G), Church of God of Prophecy (H), Church of Christ (I). Display/hide their locations on the map
Streams, rivers, and creeks: Briar Creek (A), Turtle Creek (B), Wilson Creek (C), Cashs Creek (D), Reed Creek (E), Buttermilk Slough (F), Johnsons Timber Slough (G), Horn Creek (H), Fivemile Branch (I). Display/hide their locations on the map
In group quarters: 8 (-1 institutionalized population)
Size of family households: 1,050 2-persons, 506 3-persons, 191 4-persons, 336 5-persons
Size of nonfamily households: 805 1-person, 69 2-persons
949 married couples with children.
629 single-parent households (629 men).
60.6% of residents of 77465 zip code speak English at home.
33.9% of residents speak Spanish at home (64% very well, 20% well, 10% not well, 6% not at all).
0.3% of residents speak other Indo-European language at home (100% very well).
5.1% of residents speak Asian or Pacific Island language at home (3% very well, 97% well).
Foreign born population: 955 (12.8%) (38.3% of them are naturalized citizens)
This zip code:
12.8%
Whole state:
17.2%
76%Honduras
19%Thailand
9%American
5%Czech
4%German
4%French
3%English
2%European
1%Irish
Year of entry for the foreign-born population
1012010 or later
3702000 to 2009
1461990 to 1999
330Before 1990
Housing units lacking complete plumbing facilities: 6.3% Housing units lacking complete kitchen facilities: 7.6%
61.7%Electricity
27.1%Utility gas
5.3%Bottled, tank, or LP gas
3.9%No fuel used
2.0%Solar energy
Population in 1990: 5,607. Population change in the 1990s: +1,440 (+25.7%).
Place of birth for U.S.-born residents:
This state: 5,511
Northeast: 168
Midwest: 262
South: 322
West: 147
66% of the 77465 zip code residents lived in the same house 5 years ago. Out of people who lived in different houses, 60% lived in this county. Out of people who lived in different counties, 50% lived in Texas.
91% of the 77465 zip code residents lived in the same house 1 year ago. Out of people who lived in different houses, 48% moved from this county. Out of people who lived in different houses, 32% moved from different county within same state. Out of people who lived in different houses, 0% moved from different state. Out of people who lived in different houses, 22% moved from abroad.
Private vs. public school enrollment:
Students in private schools in grades 1 to 8 (elementary and middle school):
Here:
0.0%
Texas:
8.8%
Students in private schools in grades 9 to 12 (high school): 50
Here:
9.3%
Texas:
8.0%
Students in private undergraduate colleges:
Here:
0.0%
Texas:
16.2%
Occupation by median earnings in the past 12 months ($)
81,716Health diagnosing and treating practitioners and other technical occupations
79,305Production occupations
56,485Education, training, and library occupations
48,191Construction and extraction occupations
45,458Management occupations
37,442Sales and related occupations
Top industries in this zip code by the number of employees in 2005:
Wholesale Trade: Fish and Seafood Merchant Wholesalers (10-19 employees: 1 establishment, 5-9 employees: 3 establishments, 1-4 employees: 5 establishments)
Accommodation and Food Services: Limited-Service Restaurants (10-19: 2, 1-4: 2)
Health Care and Social Assistance: General Medical and Surgical Hospitals (20-49: 1)
Health Care and Social Assistance: Nursing Care Facilities (20-49: 1)
Health Care and Social Assistance: Services for the Elderly and Persons with Disabilities (20-49: 1)
People in group quarters in 2010:
34 people in nursing facilities/skilled-nursing facilities
People in group quarters in 2000:
41 people in nursing homes
3 people in religious group quarters
Fatal accident statistics in 2014:
Fatal accident count: 1
Vehicles involved in fatal accidents: 1
Fatal accidents caused by drunken drivers: 0
Fatalities: 1
Persons involved in fatal accidents: 1
Pedestrians involved in fatal accidents: 0
Fatal accident statistics in 2012:
Fatal accident count: 5
Vehicles involved in fatal accidents: 8
Fatal accidents caused by drunken drivers: 3
Fatalities: 5
Persons involved in fatal accidents: 15
Pedestrians involved in fatal accidents: 2
2002 - 2018 National Fire Incident Reporting System (NFIRS) incidents
According to the data from the years 2002 - 2018 the average number of fire incidents per year is 8. The highest number of reported fires - 27 took place in 2017, and the least - 1 in 2004. The data has a rising trend.
When looking into fire subcategories, the most incidents belonged to: Outside Fires (67.2%), and Mobile Property/Vehicle Fires (16.8%).
Fire incident types reported to NFIRS in Zip Code 77465


 Nearest zip codes: 77419, 77428, 77440, 77961, 77458, 77970.


 According to the data from the years 2002 - 2018 the average number of fire incidents per year is 8. The highest number of reported fires - 27 took place in 2017, and the least - 1 in 2004. The data has a rising trend.
 When looking into fire subcategories, the most incidents belonged to: Outside Fires (67.2%), and Mobile Property/Vehicle Fires (16.8%).