Estimated zip code population in 2022: 94,081 Zip code population in 2010: 74,514 Zip code population in 2000: 56,016
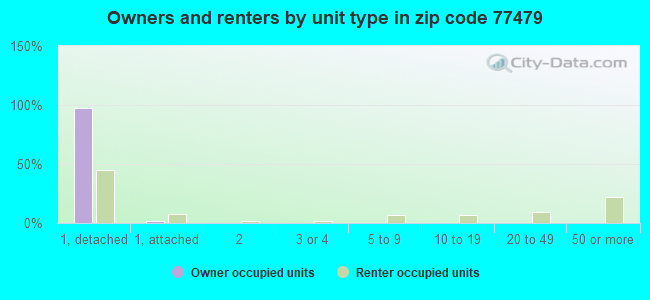
Houses and condos: 31,429 Renter-occupied apartments: 4,847
% of renters here:
16%
State:
38%
March 2022 cost of living index in zip code 77479: 98.3 (near average, U.S. average is 100)
Land area: 33.1 sq. mi. Water area: 1.5 sq. mi.
Population density: 2,844 people per square mile
(average).
OSM Map
General Map
Google Map
MSN Map
OSM Map
General Map
Google Map
MSN Map
OSM Map
General Map
Google Map
MSN Map
OSM Map
General Map
Google Map
MSN Map
Please wait while loading the map...
Real estate property taxes paid for housing units in 2022:
This zip code:
1.9% ($9,462)
Texas:
1.5% ($4,050)
Median real estate property taxes paid for housing units with mortgages in 2022: $10,039 (1.9%) Median real estate property taxes paid for housing units with no mortgage in 2022: $8,602 (1.7%)
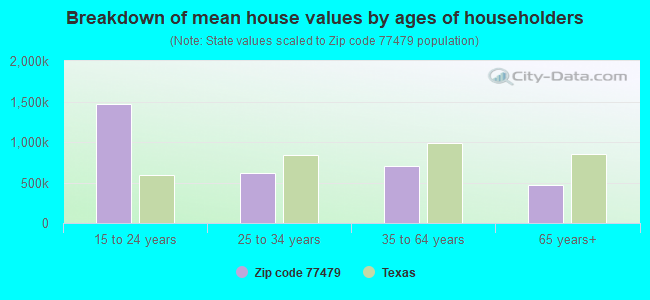
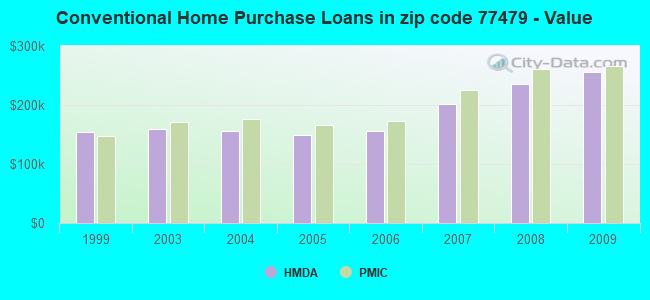
Estimated median house/condo value in 2022: $506,250
77479:
$506,250
Texas:
$275,400
According to our research of Texas and other state lists, there were 10 registered sex offenders living in 77479 zip code as of May 17, 2024. The ratio of all residents to sex offenders in zip code 77479 is 8,674 to 1. The ratio of registered sex offenders to all residents in this zip code is much lower than the state average.
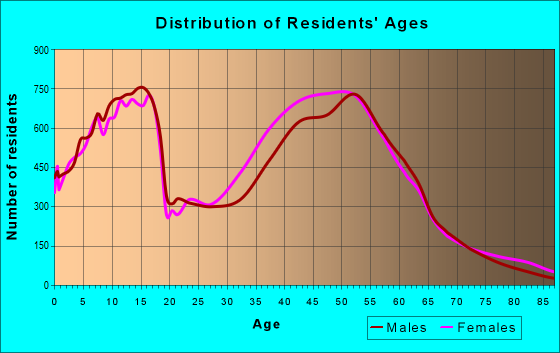
Median resident age:
This zip code:
41.4 years
Texas median age:
35.6 years
Average household size:
This zip code:
3.0 people
Texas:
2.6 people
Averages for the 2020 tax year for zip code 77479, filed in 2021:
Average Adjusted Gross Income (AGI) in 2020: $164,259 (Individual Income Tax Returns)
Here:
$164,259
State:
$77,054
Salary/wage: $128,564 (reported on 82.1% of returns)
Here:
$128,564
State:
$62,766
(% of AGI for various income ranges: 1183.5% for AGIs below $25k, 3640.6% for AGIs $25k-50k, 6840.7% for AGIs $50k-75k, 9901.0% for AGIs $75k-100k, 19788.1% for AGIs $100k-200k, 86069.7% for AGIs over 200k)
Taxable interest for individuals: $4,140 (reported on 49.3% of returns)
This zip code:
$4,140
Texas:
$2,665
(% of AGI for various income ranges: 43.6% for AGIs below $25k, 88.9% for AGIs $25k-50k, 118.6% for AGIs $50k-75k, 169.0% for AGIs $75k-100k, 277.5% for AGIs $100k-200k, 1812.8% for AGIs over 200k)
Ordinary dividends: $10,383 (reported on 41.5% of returns)
Here:
$10,383
State:
$10,044
(% of AGI for various income ranges: 49.6% for AGIs below $25k, 110.8% for AGIs $25k-50k, 190.7% for AGIs $50k-75k, 280.6% for AGIs $75k-100k, 531.6% for AGIs $100k-200k, 4207.9% for AGIs over 200k)
Net capital gain/loss in AGI: +$35,895 (reported on 41.1% of returns)
Here:
+$35,895
State:
+$39,590
(% of AGI for various income ranges: 27.8% for AGIs below $25k, 121.6% for AGIs $25k-50k, 201.9% for AGIs $50k-75k, 354.4% for AGIs $75k-100k, 846.2% for AGIs $100k-200k, 17562.7% for AGIs over 200k)
Profit/loss from business: +$21,708 (reported on 22.8% of returns)
Here:
+$21,708
State:
+$10,888
(% of AGI for various income ranges: 204.5% for AGIs below $25k, 318.8% for AGIs $25k-50k, 430.0% for AGIs $50k-75k, 477.4% for AGIs $75k-100k, 763.4% for AGIs $100k-200k, 3740.1% for AGIs over 200k)
Taxable individual retirement arrangement distribution: $43,169 (reported on 9.9% of returns)
77479:
$43,169
Texas:
$24,740
(% of AGI for various income ranges: 50.1% for AGIs below $25k, 166.3% for AGIs $25k-50k, 294.2% for AGIs $50k-75k, 534.4% for AGIs $75k-100k, 1061.6% for AGIs $100k-200k, 2922.7% for AGIs over 200k)
Self-employed (Keogh) retirement plans: $29,598 (reported on 1.6% of returns)
77479:
$29,598
Texas:
$29,298
(% of AGI for various income ranges: 9.2% for AGIs $25k-50k, 24.5% for AGIs $75k-100k, 47.8% for AGIs $100k-200k, 520.5% for AGIs over 200k)
Total itemized deductions: $45,469 (reported on 15.5% of returns)
Here:
$45,469
State:
$40,428
(% of AGI for various income ranges: 68.5% for AGIs below $25k, 203.9% for AGIs $25k-50k, 434.2% for AGIs $50k-75k, 612.3% for AGIs $75k-100k, 1144.4% for AGIs $100k-200k, 6161.5% for AGIs over 200k)
Charity contributions: $20,056 (reported on 13.1% of returns)
Here:
$20,056
State:
$18,201
(% of AGI for various income ranges: 5.5% for AGIs below $25k, 28.6% for AGIs $25k-50k, 79.6% for AGIs $50k-75k, 128.3% for AGIs $75k-100k, 324.2% for AGIs $100k-200k, 2713.1% for AGIs over 200k)
Taxes paid: $9,103 (reported on 15.2% of returns)
77479:
$9,103
State:
$7,821
(% of AGI for various income ranges: 17.8% for AGIs below $25k, 46.9% for AGIs $25k-50k, 111.4% for AGIs $50k-75k, 169.4% for AGIs $75k-100k, 304.8% for AGIs $100k-200k, 999.5% for AGIs over 200k)
Earned income credit: $2,187 (reported on 7.7% of returns)
Here:
$2,187
State:
$2,584
(% of AGI for various income ranges: 69.0% for AGIs below $25k, 73.7% for AGIs $25k-50k, 0.8% for AGIs $50k-75k)
Percentage of individuals using paid preparers for their 2020 taxes: 90.5%
Here:
90%
State:
92%
(% for various income ranges: 89.4% for AGIs below $25k, 91.0% for AGIs $25k-50k, 90.3% for AGIs $50k-75k, 90.0% for AGIs $75k-100k, 90.3% for AGIs $100k-200k, 91.6% for AGIs over 200k)
Averages for the 2012 tax year for zip code 77479, filed in 2013:
Average Adjusted Gross Income (AGI) in 2012: $147,906 (Individual Income Tax Returns)
Here:
$147,906
State:
$65,384
Salary/wage: $120,367 (reported on 87.2% of returns)
Here:
$120,367
State:
$52,524
(% of AGI for various income ranges: 80.3% for AGIs below $25k, 79.2% for AGIs $25k-50k, 77.9% for AGIs $50k-75k, 79.1% for AGIs $75k-100k, 84.1% for AGIs $100k-200k, 63.8% for AGIs over 200k)
Taxable interest for individuals: $2,688 (reported on 53.0% of returns)
This zip code:
$2,688
Texas:
$2,372
(% of AGI for various income ranges: 2.3% for AGIs below $25k, 1.3% for AGIs $25k-50k, 1.0% for AGIs $50k-75k, 1.0% for AGIs $75k-100k, 0.6% for AGIs $100k-200k, 1.0% for AGIs over 200k)
Ordinary dividends: $9,391 (reported on 39.1% of returns)
Here:
$9,391
State:
$9,721
(% of AGI for various income ranges: 3.0% for AGIs below $25k, 2.0% for AGIs $25k-50k, 1.7% for AGIs $50k-75k, 1.6% for AGIs $75k-100k, 1.3% for AGIs $100k-200k, 3.1% for AGIs over 200k)
Net capital gain/loss in AGI: +$27,670 (reported on 34.5% of returns)
Here:
+$27,670
State:
+$35,319
(% of AGI for various income ranges: 0.6% for AGIs $25k-50k, 0.5% for AGIs $50k-75k, 0.7% for AGIs $75k-100k, 0.9% for AGIs $100k-200k, 10.1% for AGIs over 200k)
Profit/loss from business: +$31,304 (reported on 20.4% of returns)
Here:
+$31,304
State:
+$13,732
(% of AGI for various income ranges: 12.2% for AGIs below $25k, 8.0% for AGIs $25k-50k, 5.6% for AGIs $50k-75k, 5.2% for AGIs $75k-100k, 4.0% for AGIs $100k-200k, 3.9% for AGIs over 200k)
Taxable individual retirement arrangement distribution: $27,678 (reported on 9.2% of returns)
77479:
$27,678
Texas:
$19,511
(% of AGI for various income ranges: 3.2% for AGIs below $25k, 2.9% for AGIs $25k-50k, 3.2% for AGIs $50k-75k, 3.3% for AGIs $75k-100k, 2.4% for AGIs $100k-200k, 1.1% for AGIs over 200k)
Self-employment retirement plans: $24,221 (reported on 2.0% of returns)
77479:
$24,221
Texas:
$23,938
(% of AGI for various income ranges: 0.1% for AGIs $25k-50k, 0.1% for AGIs $50k-75k, 0.2% for AGIs $75k-100k, 0.3% for AGIs $100k-200k, 0.4% for AGIs over 200k)
Total itemized deductions: $27,964 (12% of AGI, reported on 50.2% of returns)
Here:
$27,964
State:
$24,724
Here:
11.9% of AGI
State:
15.9% of AGI
(% of AGI for various income ranges: 12.4% for AGIs below $25k, 12.5% for AGIs $25k-50k, 15.1% for AGIs $50k-75k, 15.4% for AGIs $75k-100k, 12.6% for AGIs $100k-200k, 7.1% for AGIs over 200k)
Charity contributions: $6,392 (reported on 42.3% of returns)
Here:
$6,392
State:
$6,808
(% of AGI for various income ranges: 1.0% for AGIs below $25k, 1.3% for AGIs $25k-50k, 1.7% for AGIs $50k-75k, 2.0% for AGIs $75k-100k, 2.0% for AGIs $100k-200k, 1.8% for AGIs over 200k)
Taxes paid: $11,088 (reported on 49.8% of returns)
77479:
$11,088
State:
$6,921
(% of AGI for various income ranges: 3.4% for AGIs below $25k, 4.0% for AGIs $25k-50k, 5.3% for AGIs $50k-75k, 5.6% for AGIs $75k-100k, 5.1% for AGIs $100k-200k, 2.9% for AGIs over 200k)
Earned income credit: $2,130 (reported on 6.7% of returns)
Here:
$2,130
State:
$2,570
(% of AGI for various income ranges: 4.3% for AGIs below $25k, 0.9% for AGIs $25k-50k)
Percentage of individuals using paid preparers for their 2012 taxes: 47.2%
Here:
47%
State:
51%
(% for various income ranges: 42.8% for AGIs below $25k, 48.8% for AGIs $25k-50k, 46.5% for AGIs $50k-75k, 44.7% for AGIs $75k-100k, 44.5% for AGIs $100k-200k, 57.2% for AGIs over 200k)
Averages for the 2004 tax year for zip code 77479, filed in 2005:
Average Adjusted Gross Income (AGI) in 2004: $98,619 (Individual Income Tax Returns)
Here:
$98,619
State:
$47,881
Salary/wage: $89,670 (reported on 86.2% of returns)
Here:
$89,670
State:
$41,947
(% of AGI for various income ranges: 75.6% for AGIs $10k-25k, 81.2% for AGIs $25k-50k, 83.4% for AGIs $50k-75k, 86.9% for AGIs $75k-100k, 75.5% for AGIs over 100k)
Taxable interest for individuals: $2,218 (reported on 62.2% of returns)
This zip code:
$2,218
Texas:
$2,255
(% of AGI for various income ranges: 3.7% for AGIs $10k-25k, 2.5% for AGIs $25k-50k, 1.9% for AGIs $50k-75k, 1.1% for AGIs $75k-100k, 1.1% for AGIs over 100k)
Taxable dividends: $3,502 (reported on 43.1% of returns)
Here:
$3,502
State:
$4,261
(% of AGI for various income ranges: 2.9% for AGIs $10k-25k, 1.6% for AGIs $25k-50k, 1.6% for AGIs $50k-75k, 1.1% for AGIs $75k-100k, 1.5% for AGIs over 100k)
Net capital gain/loss: +$11,833 (reported on 39.3% of returns)
Here:
+$11,833
State:
+$16,110
(% of AGI for various income ranges: 0.8% for AGIs $10k-25k, 0.2% for AGIs $25k-50k, 0.6% for AGIs $50k-75k, 0.7% for AGIs $75k-100k, 6.1% for AGIs over 100k)
Profit/loss from business: +$23,203 (reported on 20.8% of returns)
Here:
+$23,203
State:
+$11,013
(% of AGI for various income ranges: 10.8% for AGIs $10k-25k, 6.9% for AGIs $25k-50k, 4.4% for AGIs $50k-75k, 3.7% for AGIs $75k-100k, 4.8% for AGIs over 100k)
IRA payment deduction: $3,698 (reported on 4.7% of returns)
77479:
$3,698
Texas:
$3,120
(% of AGI for various income ranges: 0.5% for AGIs $10k-25k, 0.5% for AGIs $25k-50k, 0.4% for AGIs $50k-75k, 0.3% for AGIs $75k-100k, 0.1% for AGIs over 100k)
Self-employed pension: $18,277 (reported on 2.4% of returns)
Here:
$18,277
Texas:
$16,401
(% of AGI for various income ranges: 0.1% for AGIs $10k-25k, 0.2% for AGIs $25k-50k, 0.2% for AGIs $50k-75k, 0.3% for AGIs $75k-100k, 0.5% for AGIs over 100k)
Total itemized deductions: $22,850 (16% of AGI, reported on 54.8% of returns)
Here:
$22,850
State:
$19,631
Here:
15.9% of AGI
State:
18.9% of AGI
(% of AGI for various income ranges: 15.6% for AGIs $10k-25k, 19.6% for AGIs $25k-50k, 19.7% for AGIs $50k-75k, 18.1% for AGIs $75k-100k, 10.6% for AGIs over 100k)
Charity contributions deductions: $4,817 (3% of AGI, reported on 47.9% of returns)
Here:
$4,817
State:
$4,753
Here:
3.2% of AGI
State:
4.2% of AGI
(% of AGI for various income ranges: 1.1% for AGIs $10k-25k, 2.0% for AGIs $25k-50k, 2.4% for AGIs $50k-75k, 2.4% for AGIs $75k-100k, 2.4% for AGIs over 100k)
Total tax: $21,716 (reported on 80.8% of returns)
77479:
$21,716
State:
$9,058
(% of AGI for various income ranges: 4.9% for AGIs $10k-25k, 6.9% for AGIs $25k-50k, 8.7% for AGIs $50k-75k, 10.0% for AGIs $75k-100k, 20.7% for AGIs over 100k)
Earned income credit: $1,655 (reported on 6.0% of returns)
Here:
$1,655
State:
$2,024
Percentage of individuals using paid preparers for their 2004 taxes: 45.9%
Here:
46%
State:
57%
(% for various income ranges: 39.2% for AGIs below $10k, 51.9% for AGIs $10k-25k, 51.1% for AGIs $25k-50k, 46.0% for AGIs $50k-75k, 41.7% for AGIs $75k-100k, 47.4% for AGIs over 100k)
Likely homosexual households (counted as self-reported same-sex unmarried-partner households)
Lesbian couples: 0.0% of all households
Gay men: 0.1% of all households
Household received Food Stamps/SNAP in the past 12 months: 1,004 Household did not receive Food Stamps/SNAP in the past 12 months: 29,765
Women who had a birth in the past 12 months: 835 (763 now married, 82 unmarried) Women who did not have a birth in the past 12 months: 21,202 (12,975 now married, 8,111 unmarried)
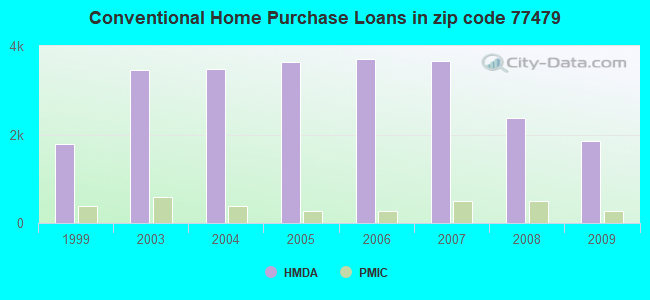
Housing units in zip code 77479 with a mortgage: 15,777 (1,037 second mortgage, 683 both second mortgage and home equity loan) Houses without a mortgage: 426
Median monthly owner costs for units with a mortgage: $3,016 Median monthly owner costs for units without a mortgage: $1,220
Residents with income below the poverty level in 2022:
This zip code:
3.9%
Whole state:
14.0%
Residents with income below 50% of the poverty level in 2022:
This zip code:
2.1%
Whole state:
7.4%
Median number of rooms in houses and condos:
Here:
8.1
State:
6.3
Median number of rooms in apartments:
Here:
4.5
State:
4.0
Notable locations in this zip code not listed on our city pages
20,327 married couples with children.
1,833 single-parent households (485 men, 1,348 women).
53.6% of residents of 77479 zip code speak English at home.
5.3% of residents speak Spanish at home (83% very well, 11% well, 4% not well, 3% not at all).
18.8% of residents speak other Indo-European language at home (77% very well, 16% well, 5% not well, 2% not at all).
21.3% of residents speak Asian or Pacific Island language at home (63% very well, 25% well, 8% not well, 4% not at all).
2.6% of residents speak other language at home (86% very well, 8% well, 5% not well).
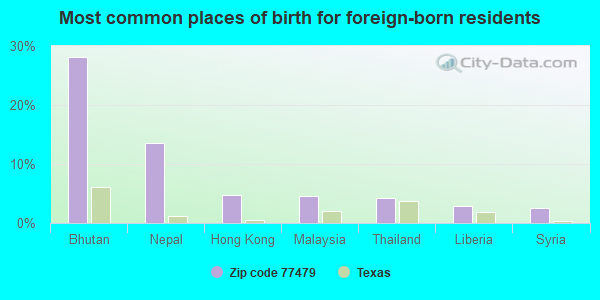
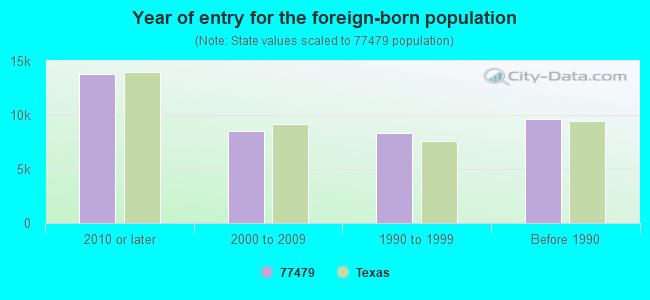
Foreign born population: 39,971 (42.5%) (66.9% of them are naturalized citizens)
Facilities with environmental interests located in this zip code:
ARIZONA FLEMING EL (16431 LEXINGTON BLVD in SUGAR LAND, TX)
(National Center for Education Statistics) - STATE ID-079907133 Organizations: FORT BEND ISD (SCHOOL DISTRICT)
AUSTIN PARKWAY EL (16431 LEXINGTON BLVD in SUGAR LAND, TX)
(National Center for Education Statistics) - STATE ID-079907126 Organizations: FORT BEND ISD (SCHOOL DISTRICT)
BARBARA JORDAN ELEMENTARY (16431 LEXINGTON BLVD in SUGARLAND, TX)
(National Center for Education Statistics) - STATE ID-079907141 Organizations: FORT BEND ISD (SCHOOL DISTRICT)
BARRINGTON PLACE EL (16431 LEXINGTON BLVD in SUGAR LAND, TX)
(National Center for Education Statistics) - STATE ID-079907127 Organizations: FORT BEND ISD (SCHOOL DISTRICT)
ANT ENTERPRISES INC. (SUGAR (LAND CONCRETE BATCH PLANT) in SUGAR LAND, TX)
National Pollutant Discharge Elimination System NON-MAJOR (Tracking pollutant discharge elimination systems) - permit Alternative names: ANTHONY TORRES, PRESIDENT
ANT ENTERPRISES INC. (17543 SOUTHWEST FREEWAY in SUGAR LAND, TX)
ENFORCEMENT/COMPLIANCE ACTIVITY (Integrated Compliance Information System)
Housing units lacking complete kitchen facilities: 0.5%
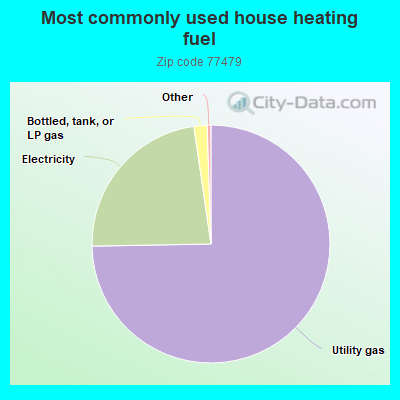
74.8%Utility gas
23.0%Electricity
1.8%Bottled, tank, or LP gas
Population in 1990: 20,219. Population change in the 1990s: +35,797 (+177.0%).
Place of birth for U.S.-born residents:
This state: 34,474
Northeast: 3,899
Midwest: 4,760
South: 6,904
West: 4,252
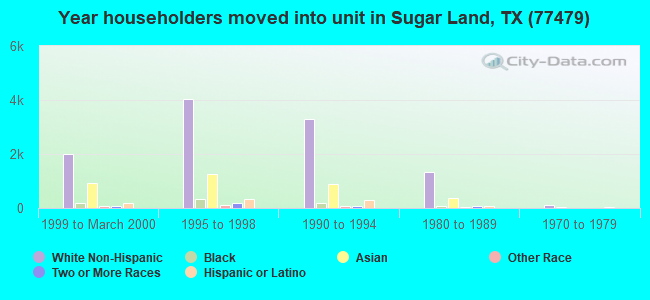
50% of the 77479 zip code residents lived in the same house 5 years ago. Out of people who lived in different houses, 30% lived in this county. Out of people who lived in different counties, 50% lived in Texas.
91% of the 77479 zip code residents lived in the same house 1 year ago. Out of people who lived in different houses, 36% moved from this county. Out of people who lived in different houses, 25% moved from different county within same state. Out of people who lived in different houses, 18% moved from different state. Out of people who lived in different houses, 27% moved from abroad.
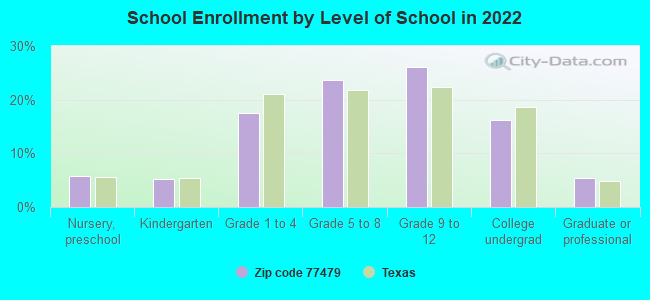
Private vs. public school enrollment:
Students in private schools in grades 1 to 8 (elementary and middle school): 1,035
Here:
9.1%
Texas:
8.8%
Students in private schools in grades 9 to 12 (high school): 488
Here:
6.8%
Texas:
8.0%
Students in private undergraduate colleges: 643
Here:
14.4%
Texas:
16.2%
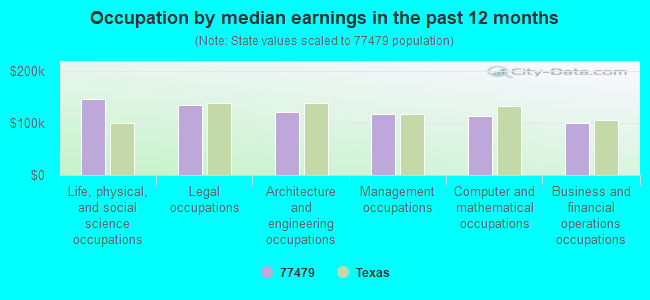
Occupation by median earnings in the past 12 months ($)
145,537Life, physical, and social science occupations
134,087Legal occupations
119,934Architecture and engineering occupations
116,108Management occupations
113,576Computer and mathematical occupations
98,854Business and financial operations occupations
Companies with federal contracts located in this zip code (SUGAR LAND, TX):
ENERGY & ENVIROMENTAL TECHNOLO (15 OLD WINDSOR WAY; small business) : $1,019,732 in 23 contractsfrom 1999 to 2004
Contracts for Hazardous Substance Removal, Cleanup, and Disposal Services and Operational Support, Construction of Structures and Facilities -- Other Non-Building Facilities, Maintenance, Repair or Alteration of Real Property -- Miscellaneous Buildings, Construction of Structures and Facilities -- Pollution Abatement and Control Facilities, and moreby Defense Logistics Agency, Army, EPA Signed by year:2000: $758,948; 2001: $86,000; 2002: $0; 2003: $0; 2004: -$9,630; 2005: $0; 2006: $0.
Biggest contracts:
$100,000 with Defense Logistics Agency for Hazardous Substance Removal, Cleanup, and Disposal Services and Operational Support. Taking place in NJ. Signed on 2000-09-27. Completion date: 2000-10-27.
$80,000, same as above.Signed on 2000-01-03. Completion date: 2000-03-31.
$78,000, same as above.Signed on 2000-03-14. Completion date: 2000-06-30.
$78,000, same as above.Signed on 2000-07-26. Completion date: 2000-09-30.
BOBBYE A SWINFORD (4231 ROCKY BEND DRIVE; small business) : $50,894 in 12 contractsfrom 2002 to 2006
Contracts for Operation of Government-Owned Facilities -- Recreation Facilities (Non-Building) by U.S. Army Corps of Engineers - civil program financing only, Army Signed by year:2000: $0; 2001: $0; 2002: $11,830; 2003: $2,940; 2004: $14,240; 2005: $14,094; 2006: $7,790.
Biggest contracts:
$10,290 with U.S. Army Corps of Engineers - civil program financing only for Operation of Government-Owned Facilities -- Recreation Facilities (Non-Building). Taking place in MO. Signed on 2002-12-30. Completion date: 2003-10-31.
$7,790 with Army for Operation of Government-Owned Facilities -- Recreation Facilities (Non-Building). Taking place in AR. Signed on 2006-02-14. Completion date: 2005-09-30.
$7,200 with U.S. Army Corps of Engineers - civil program financing only for Operation of Government-Owned Facilities -- Recreation Facilities (Non-Building). Taking place in AR. Signed on 2004-03-05. Completion date: 2004-09-13.
$7,200 with Army for Operation of Government-Owned Facilities -- Recreation Facilities (Non-Building). Taking place in AR. Signed on 2004-03-05. Completion date: 2004-09-13.
NATIONAL MARINE SERVICES (2622 LIVELY LANE SUITE 100; small business) : $10,522 in 3 contractsfrom 2000 to 2003
$30,700 with U.S. Army Corps of Engineers - civil program financing only for Inspection Services (including commercial testing and lab services, except medical/dental) -- Ships, Small Craft, Pontoons, and Floating Docks. Signed on 2000-03-23. Completion date: 2001-03-31.
$4,627 with U.S. Army Corps of Engineers - civil program financing only for Quality Control Services -- Ships, Small Craft, Pontoons, and Floating Docks. Taking place in PA. Signed on 2003-01-16. Completion date: 2002-11-12.
-$24,805 with U.S. Army Corps of Engineers - civil program financing only for Inspection Services (including commercial testing and lab services, except medical/dental) -- Ships, Small Craft, Pontoons, and Floating Docks. Signed on 2002-12-03. Completion date: 2001-03-31.
INTEGRATED POWER SYSTEMS CORPO (730 SARTARTIA RD; small business)
$4,716 with Navy for Non-nuclear Ship Repair (East) Ship repair (including overhauls and conversions) performed on non-nuclear propelled and nonpropelled ships east of the 108th meridian. Taking place in FL. Signed on 2000-10-20. Completion date: 2000-11-10.
Top industries in this zip code by the number of employees in 2005:
2002 - 2018 National Fire Incident Reporting System (NFIRS) incidents
According to the data from the years 2002 - 2018 the average number of fire incidents per year is 67. The highest number of fire incidents - 108 took place in 2018, and the least - 36 in 2009. The data has a rising trend.
When looking into fire subcategories, the most incidents belonged to: Structure Fires (43.3%), and Outside Fires (32.7%).
Fire incident types reported to NFIRS in Zip Code 77479


 Nearest zip codes: 77478, 77498, 77477, 77469, 77459, 77099.
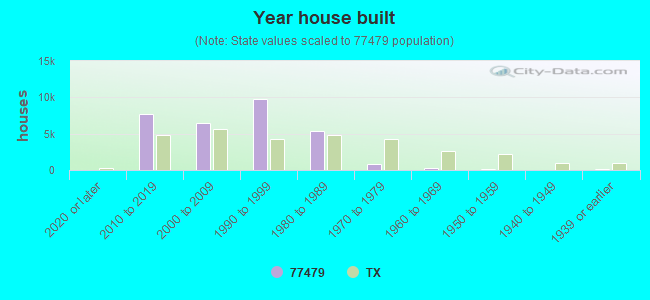


 According to the data from the years 2002 - 2018 the average number of fire incidents per year is 67. The highest number of fire incidents - 108 took place in 2018, and the least - 36 in 2009. The data has a rising trend.
 When looking into fire subcategories, the most incidents belonged to: Structure Fires (43.3%), and Outside Fires (32.7%).