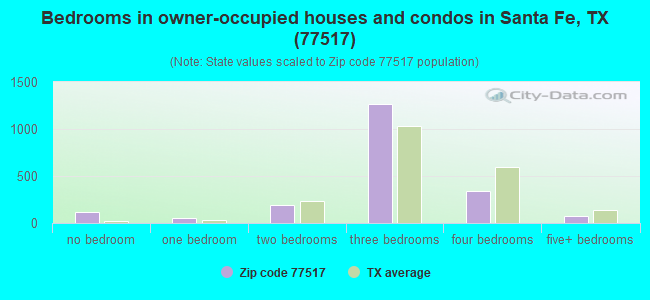
Estimated zip code population in 2022: 6,325 Zip code population in 2010: 5,315 Zip code population in 2000: 4,609
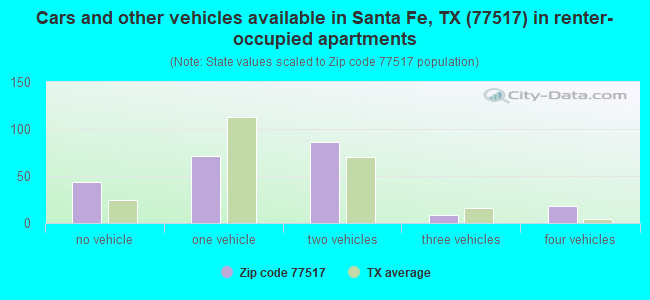
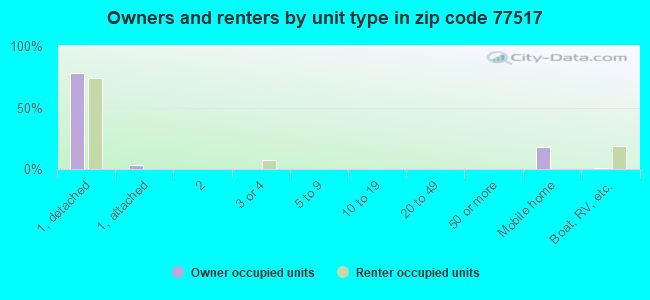
Houses and condos: 2,261 Renter-occupied apartments: 228
% of renters here:
10%
State:
38%
March 2022 cost of living index in zip code 77517: 95.1 (less than average, U.S. average is 100)
Land area: 20.2 sq. mi. Water area: 0.1 sq. mi.
Population density: 314 people per square mile
(very low).
OSM Map
General Map
Google Map
MSN Map
OSM Map
General Map
Google Map
MSN Map
OSM Map
General Map
Google Map
MSN Map
OSM Map
General Map
Google Map
MSN Map
Please wait while loading the map...
Real estate property taxes paid for housing units in 2022:
This zip code:
1.2% ($3,706)
Texas:
1.5% ($4,050)
Median real estate property taxes paid for housing units with mortgages in 2022: $4,543 (1.1%) Median real estate property taxes paid for housing units with no mortgage in 2022: $3,323 (1.3%)
Business Search- 14 Million verified businesses
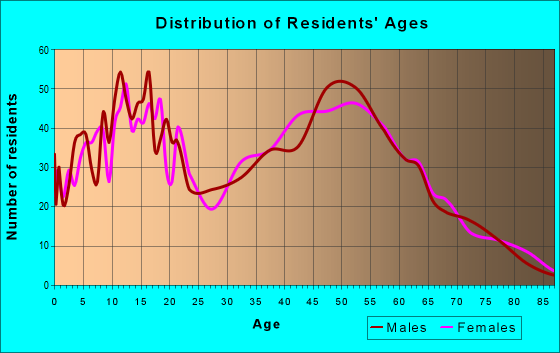
Males: 3,301
(52.2%)
Females: 3,024
(47.8%)
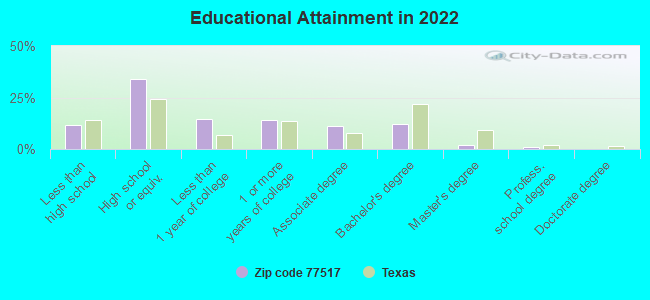
For population 25 years and over in 77517:
High school or higher: 87.6%
Bachelor's degree or higher: 14.4%
Graduate or professional degree: 2.6%
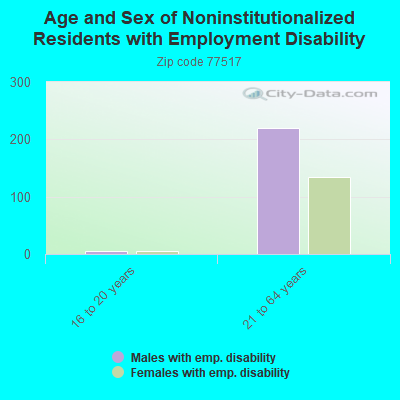
Unemployed: 15.4%
Mean travel time to work (commute): 37.6 minutes
For population 15 years and over in 77517:
Never married: 18.1%
Now married: 71.4%
Separated: 1.3%
Widowed: 3.1%
Divorced: 6.2%
Zip code 77517 compared to state average:
Unemployed percentage significantly above state average.
Black race population percentage significantly below state average.
Hispanic race population percentage below state average.
Median age above state average.
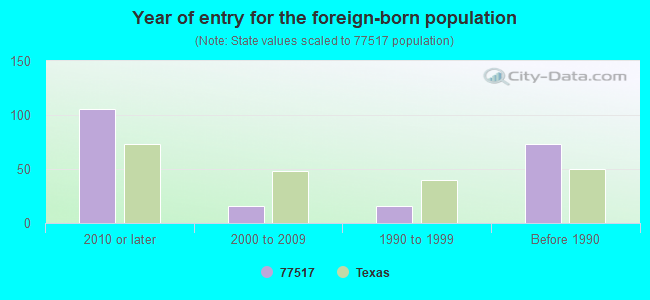
Foreign-born population percentage significantly below state average.
Renting percentage significantly below state average.
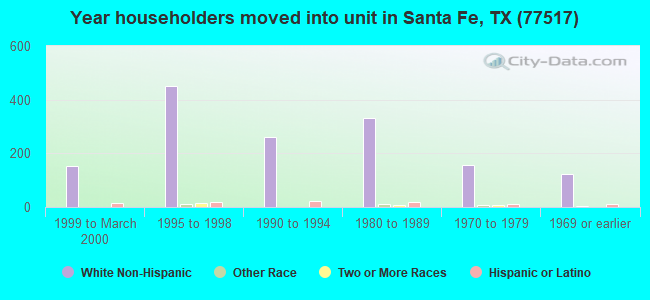
Length of stay since moving in significantly above state average.
Percentage of population with a bachelor's degree or higher below state average.
Averages for the 2020 tax year for zip code 77517, filed in 2021:
Average Adjusted Gross Income (AGI) in 2020: $80,194 (Individual Income Tax Returns)
Here:
$80,194
State:
$77,054
Salary/wage: $74,406 (reported on 81.7% of returns)
Here:
$74,406
State:
$62,766
(% of AGI for various income ranges: 1070.5% for AGIs below $25k, 3656.0% for AGIs $25k-50k, 6243.8% for AGIs $50k-75k, 9195.2% for AGIs $75k-100k, 16139.3% for AGIs $100k-200k, 52075.6% for AGIs over 200k)
Taxable interest for individuals: $1,625 (reported on 30.4% of returns)
This zip code:
$1,625
Texas:
$2,665
(% of AGI for various income ranges: 8.9% for AGIs below $25k, 23.6% for AGIs $25k-50k, 64.1% for AGIs $50k-75k, 53.0% for AGIs $75k-100k, 55.6% for AGIs $100k-200k, 812.2% for AGIs over 200k)
Ordinary dividends: $4,211 (reported on 15.6% of returns)
Here:
$4,211
State:
$10,044
(% of AGI for various income ranges: 15.8% for AGIs below $25k, 40.7% for AGIs $25k-50k, 77.9% for AGIs $50k-75k, 94.3% for AGIs $75k-100k, 123.2% for AGIs $100k-200k, 736.7% for AGIs over 200k)
Net capital gain/loss in AGI: +$10,420 (reported on 14.2% of returns)
Here:
+$10,420
State:
+$39,590
(% of AGI for various income ranges: 8.0% for AGIs below $25k, 10.9% for AGIs $25k-50k, 23.4% for AGIs $50k-75k, 79.6% for AGIs $75k-100k, 230.7% for AGIs $100k-200k, 3305.6% for AGIs over 200k)
Profit/loss from business: +$7,192 (reported on 18.0% of returns)
Here:
+$7,192
State:
+$10,888
(% of AGI for various income ranges: 122.2% for AGIs below $25k, 9.3% for AGIs $25k-50k, 188.0% for AGIs $100k-200k, 2762.2% for AGIs over 200k)
Taxable individual retirement arrangement distribution: $27,384 (reported on 10.7% of returns)
77517:
$27,384
Texas:
$24,740
(% of AGI for various income ranges: 71.7% for AGIs below $25k, 144.0% for AGIs $25k-50k, 389.0% for AGIs $50k-75k, 632.2% for AGIs $75k-100k, 746.8% for AGIs $100k-200k, 1931.1% for AGIs over 200k)
Total itemized deductions: $33,817 (reported on 8.3% of returns)
Here:
$33,817
State:
$40,428
(% of AGI for various income ranges: 102.5% for AGIs below $25k, 276.9% for AGIs $50k-75k, 350.9% for AGIs $75k-100k, 774.4% for AGIs $100k-200k, 2972.2% for AGIs over 200k)
Charity contributions: $13,206 (reported on 6.2% of returns)
Here:
$13,206
State:
$18,201
(% of AGI for various income ranges: 43.6% for AGIs $25k-50k, 118.7% for AGIs $75k-100k, 189.8% for AGIs $100k-200k, 1255.6% for AGIs over 200k)
Taxes paid: $7,836 (reported on 7.6% of returns)
77517:
$7,836
State:
$7,821
(% of AGI for various income ranges: 18.8% for AGIs below $25k, 51.4% for AGIs $50k-75k, 98.3% for AGIs $75k-100k, 172.9% for AGIs $100k-200k, 577.8% for AGIs over 200k)
Earned income credit: $2,326 (reported on 13.1% of returns)
Here:
$2,326
State:
$2,584
(% of AGI for various income ranges: 93.0% for AGIs below $25k, 64.2% for AGIs $25k-50k)
Percentage of individuals using paid preparers for their 2020 taxes: 91.7%
Here:
92%
State:
92%
(% for various income ranges: 90.5% for AGIs below $25k, 92.9% for AGIs $25k-50k, 89.7% for AGIs $50k-75k, 93.8% for AGIs $75k-100k, 93.0% for AGIs $100k-200k, 90.5% for AGIs over 200k)
Averages for the 2012 tax year for zip code 77517, filed in 2013:
Average Adjusted Gross Income (AGI) in 2012: $70,654 (Individual Income Tax Returns)
Here:
$70,654
State:
$65,384
Salary/wage: $61,826 (reported on 84.5% of returns)
Here:
$61,826
State:
$52,524
(% of AGI for various income ranges: 69.8% for AGIs below $25k, 77.9% for AGIs $25k-50k, 78.9% for AGIs $50k-75k, 80.7% for AGIs $75k-100k, 85.6% for AGIs $100k-200k, 47.5% for AGIs over 200k)
Taxable interest for individuals: $995 (reported on 32.1% of returns)
This zip code:
$995
Texas:
$2,372
(% of AGI for various income ranges: 0.8% for AGIs below $25k, 0.6% for AGIs $25k-50k, 0.4% for AGIs $50k-75k, 0.4% for AGIs $75k-100k, 0.3% for AGIs $100k-200k, 0.7% for AGIs over 200k)
Ordinary dividends: $2,222 (reported on 14.8% of returns)
Here:
$2,222
State:
$9,721
(% of AGI for various income ranges: 2.3% for AGIs below $25k, 0.6% for AGIs $25k-50k, 0.4% for AGIs $50k-75k, 0.5% for AGIs $75k-100k, 0.2% for AGIs $100k-200k, 0.3% for AGIs over 200k)
Net capital gain/loss in AGI: +$10,363 (reported on 10.0% of returns)
Here:
+$10,363
State:
+$35,319
(% of AGI for various income ranges: 0.3% for AGIs $50k-75k, 0.1% for AGIs $75k-100k, 0.7% for AGIs $100k-200k, 5.2% for AGIs over 200k)
Profit/loss from business: +$9,211 (reported on 16.6% of returns)
Here:
+$9,211
State:
+$13,732
(% of AGI for various income ranges: 9.4% for AGIs below $25k, 2.5% for AGIs $25k-50k, 0.5% for AGIs $50k-75k, 1.6% for AGIs $75k-100k, 3.1% for AGIs $100k-200k)
Taxable individual retirement arrangement distribution: $21,389 (reported on 10.3% of returns)
77517:
$21,389
Texas:
$19,511
(% of AGI for various income ranges: 3.4% for AGIs below $25k, 3.7% for AGIs $25k-50k, 4.0% for AGIs $50k-75k, 3.3% for AGIs $75k-100k, 4.5% for AGIs $100k-200k)
Total itemized deductions: $20,038 (15% of AGI, reported on 28.8% of returns)
Here:
$20,038
State:
$24,724
Here:
15.4% of AGI
State:
15.9% of AGI
(% of AGI for various income ranges: 6.5% for AGIs below $25k, 7.7% for AGIs $25k-50k, 9.9% for AGIs $50k-75k, 9.6% for AGIs $75k-100k, 9.5% for AGIs $100k-200k, 4.8% for AGIs over 200k)
Charity contributions: $4,364 (reported on 20.7% of returns)
Here:
$4,364
State:
$6,808
(% of AGI for various income ranges: 0.4% for AGIs below $25k, 0.8% for AGIs $25k-50k, 0.9% for AGIs $50k-75k, 1.1% for AGIs $75k-100k, 1.6% for AGIs $100k-200k, 1.5% for AGIs over 200k)
Taxes paid: $5,962 (reported on 28.4% of returns)
77517:
$5,962
State:
$6,921
(% of AGI for various income ranges: 1.1% for AGIs below $25k, 1.9% for AGIs $25k-50k, 2.6% for AGIs $50k-75k, 2.6% for AGIs $75k-100k, 3.1% for AGIs $100k-200k, 1.5% for AGIs over 200k)
Earned income credit: $2,268 (reported on 15.1% of returns)
Here:
$2,268
State:
$2,570
(% of AGI for various income ranges: 6.7% for AGIs below $25k, 1.1% for AGIs $25k-50k)
Percentage of individuals using paid preparers for their 2012 taxes: 48.0%
Here:
48%
State:
51%
(% for various income ranges: 40.2% for AGIs below $25k, 45.5% for AGIs $25k-50k, 48.7% for AGIs $50k-75k, 51.7% for AGIs $75k-100k, 57.7% for AGIs $100k-200k, 66.7% for AGIs over 200k)
Averages for the 2004 tax year for zip code 77517, filed in 2005:
Average Adjusted Gross Income (AGI) in 2004: $48,213 (Individual Income Tax Returns)
Here:
$48,213
State:
$47,881
Salary/wage: $46,080 (reported on 88.5% of returns)
Here:
$46,080
State:
$41,947
(% of AGI for various income ranges: 143.0% for AGIs below $10k, 74.3% for AGIs $10k-25k, 85.7% for AGIs $25k-50k, 85.1% for AGIs $50k-75k, 87.4% for AGIs $75k-100k, 82.1% for AGIs over 100k)
Taxable interest for individuals: $1,058 (reported on 42.4% of returns)
This zip code:
$1,058
Texas:
$2,255
(% of AGI for various income ranges: 5.0% for AGIs below $10k, 1.8% for AGIs $10k-25k, 0.8% for AGIs $25k-50k, 0.6% for AGIs $50k-75k, 0.6% for AGIs $75k-100k, 1.0% for AGIs over 100k)
Taxable dividends: $1,080 (reported on 15.4% of returns)
Here:
$1,080
State:
$4,261
(% of AGI for various income ranges: 0.3% for AGIs below $10k, 0.9% for AGIs $10k-25k, 0.2% for AGIs $25k-50k, 0.3% for AGIs $50k-75k, 0.2% for AGIs $75k-100k, 0.4% for AGIs over 100k)
Net capital gain/loss: +$3,090 (reported on 12.3% of returns)
Here:
+$3,090
State:
+$16,110
(% of AGI for various income ranges: -1.4% for AGIs below $10k, -0.2% for AGIs $10k-25k, -0.0% for AGIs $25k-50k, 0.2% for AGIs $50k-75k, -0.2% for AGIs $75k-100k, 2.4% for AGIs over 100k)
Profit/loss from business: +$4,446 (reported on 17.5% of returns)
Here:
+$4,446
State:
+$11,013
(% of AGI for various income ranges: -4.5% for AGIs below $10k, 8.4% for AGIs $10k-25k, 1.4% for AGIs $25k-50k, 2.6% for AGIs $50k-75k, 1.0% for AGIs $75k-100k, 0.2% for AGIs over 100k)
IRA payment deduction: $2,979 (reported on 2.0% of returns)
77517:
$2,979
Texas:
$3,120
Total itemized deductions: $16,632 (20% of AGI, reported on 28.3% of returns)
Here:
$16,632
State:
$19,631
Here:
20.1% of AGI
State:
18.9% of AGI
(% of AGI for various income ranges: 8.6% for AGIs below $10k, 6.7% for AGIs $10k-25k, 7.6% for AGIs $25k-50k, 9.9% for AGIs $50k-75k, 11.1% for AGIs $75k-100k, 10.8% for AGIs over 100k)
Charity contributions deductions: $3,190 (4% of AGI, reported on 21.8% of returns)
Here:
$3,190
State:
$4,753
Here:
3.7% of AGI
State:
4.2% of AGI
(% of AGI for various income ranges: 1.0% for AGIs $10k-25k, 0.7% for AGIs $25k-50k, 1.4% for AGIs $50k-75k, 1.4% for AGIs $75k-100k, 2.0% for AGIs over 100k)
Total tax: $6,560 (reported on 78.5% of returns)
77517:
$6,560
State:
$9,058
(% of AGI for various income ranges: 3.0% for AGIs below $10k, 4.3% for AGIs $10k-25k, 6.7% for AGIs $25k-50k, 9.2% for AGIs $50k-75k, 10.6% for AGIs $75k-100k, 15.4% for AGIs over 100k)
Earned income credit: $1,878 (reported on 14.5% of returns)
Here:
$1,878
State:
$2,024
Percentage of individuals using paid preparers for their 2004 taxes: 50.3%
Here:
50%
State:
57%
(% for various income ranges: 43.5% for AGIs below $10k, 54.4% for AGIs $10k-25k, 49.2% for AGIs $25k-50k, 52.0% for AGIs $50k-75k, 49.2% for AGIs $75k-100k, 53.8% for AGIs over 100k)
Household received Food Stamps/SNAP in the past 12 months: 257 Household did not receive Food Stamps/SNAP in the past 12 months: 2,003
Women who had a birth in the past 12 months: 100 (90 now married, 10 unmarried) Women who did not have a birth in the past 12 months: 1,224 (771 now married, 444 unmarried)
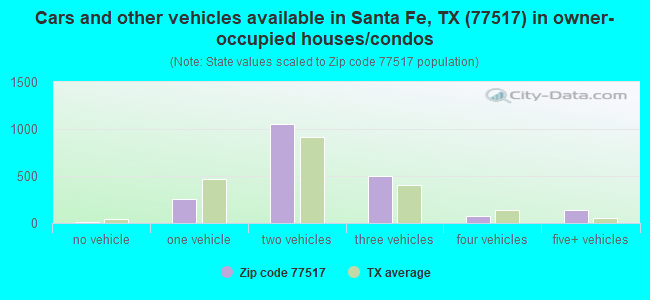
Housing units in zip code 77517 with a mortgage: 882 (19 second mortgage, 21 both second mortgage and home equity loan) Houses without a mortgage: 48
Median monthly owner costs for units with a mortgage: $2,079 Median monthly owner costs for units without a mortgage: $725
Residents with income below the poverty level in 2022:
This zip code:
3.4%
Whole state:
14.0%
Residents with income below 50% of the poverty level in 2022:
This zip code:
2.6%
Whole state:
7.4%
Median number of rooms in houses and condos:
Here:
6.0
State:
6.3
Median number of rooms in apartments:
Here:
4.9
State:
4.0
Notable locations in this zip code not listed on our city pages
Size of family households: 727 2-persons, 525 3-persons, 293 4-persons, 195 5-persons, 16 6-persons, 70 7-or-more-persons
Size of nonfamily households: 390 1-person, 34 2-persons
1,140 married couples with children.
200 single-parent households (139 men, 61 women).
90.4% of residents of 77517 zip code speak English at home.
8.9% of residents speak Spanish at home (99% very well, 1% well).
0.3% of residents speak other Indo-European language at home (100% very well).
Foreign born population: 113 (1.8%) (100.0% of them are naturalized citizens)
This zip code:
1.8%
Whole state:
17.2%
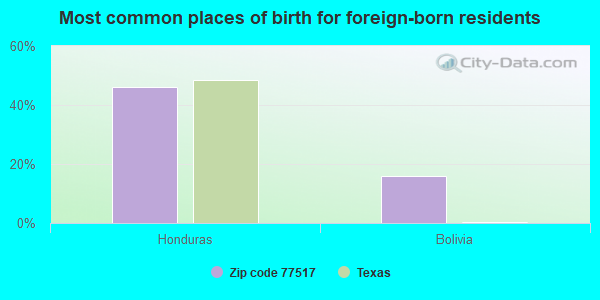
46%Honduras
16%Bolivia
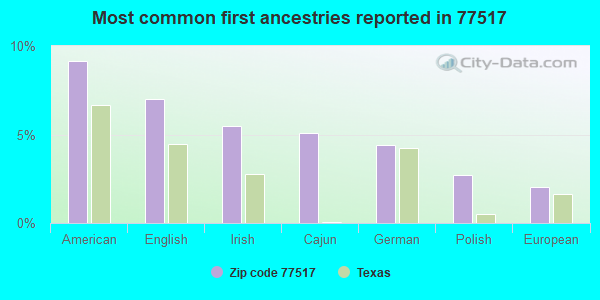
9%American
7%English
5%Irish
5%Cajun
4%German
3%Polish
2%European
Year of entry for the foreign-born population
1062010 or later
162000 to 2009
161990 to 1999
73Before 1990
Housing units lacking complete plumbing facilities: 0.9% Housing units lacking complete kitchen facilities: 1.7%
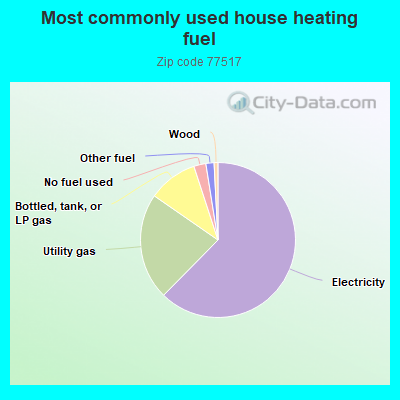
62.2%Electricity
22.2%Utility gas
10.3%Bottled, tank, or LP gas
2.5%No fuel used
1.7%Other fuel
0.8%Wood
Population in 1990: 3,377. Population change in the 1990s: +1,232 (+36.5%).
Place of birth for U.S.-born residents:
This state: 5,065
Northeast: 64
Midwest: 222
South: 541
West: 175
64% of the 77517 zip code residents lived in the same house 5 years ago. Out of people who lived in different houses, 62% lived in this county. Out of people who lived in different counties, 50% lived in Texas.
97% of the 77517 zip code residents lived in the same house 1 year ago. Out of people who lived in different houses, 33% moved from this county. Out of people who lived in different houses, 45% moved from different county within same state. Out of people who lived in different houses, 33% moved from different state.
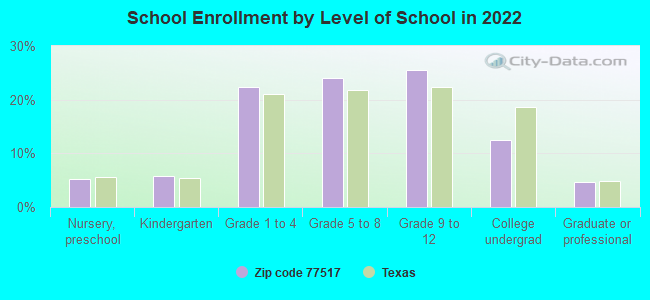
Private vs. public school enrollment:
Students in private schools in grades 1 to 8 (elementary and middle school): 96
Here:
14.2%
Texas:
8.8%
Students in private schools in grades 9 to 12 (high school): 26
Here:
7.3%
Texas:
8.0%
Students in private undergraduate colleges:
Here:
0.0%
Texas:
16.2%
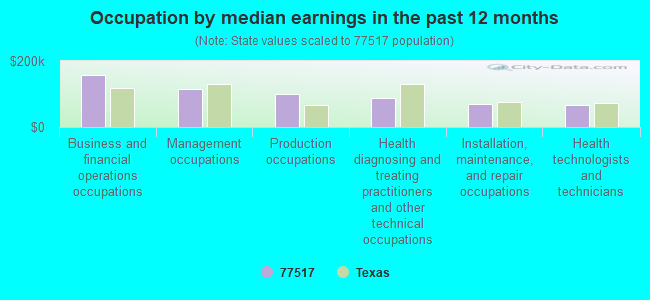
Occupation by median earnings in the past 12 months ($)
156,510Business and financial operations occupations
114,910Management occupations
99,186Production occupations
89,086Health diagnosing and treating practitioners and other technical occupations
68,883Installation, maintenance, and repair occupations
67,173Health technologists and technicians
Top industries in this zip code by the number of employees in 2005:
Accommodation and Food Services: Limited-Service Restaurants (20-49 employees: 2 establishments)
Other Services (except Public Administration): Religious Organizations (20-49: 1, 5-9: 1, 1-4: 2)
Administrative and Support and Waste Management and Remediation Services: Security Guards and Patrol Services (20-49: 1)
Construction: Oil and Gas Pipeline and Related Structures Construction (20-49: 1)
Administrative and Support and Waste Management and Remediation Services: Landscaping Services (10-19: 1, 1-4: 1)
Health Care and Social Assistance: Child Day Care Services (10-19: 1)
Construction: Plumbing, Heating, and Air-Conditioning Contractors (5-9: 1, 1-4: 2)
Finance and Insurance: All Other Nondepository Credit Intermediation (5-9: 1)
Fatal accident statistics in 2012:
Fatal accident count: 1
Vehicles involved in fatal accidents: 3
Fatal accidents caused by drunken drivers: 0
Fatalities: 2
Persons involved in fatal accidents: 3
Pedestrians involved in fatal accidents: 0
Home Mortgage Disclosure Act Aggregated Statistics For Year 2009 (Based on 4 partial tracts)
A) FHA, FSA/RHS & VA Home Purchase Loans
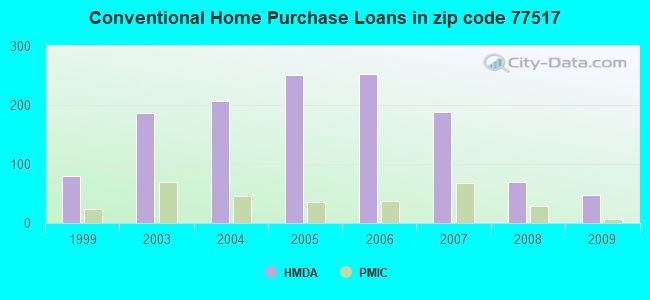
B) Conventional Home Purchase Loans
C) Refinancings
D) Home Improvement Loans
F) Non-occupant Loans on < 5 Family Dwellings (A B C & D)
G) Loans On Manufactured Home Dwelling (A B C & D)
Number
Average Value
Number
Average Value
Number
Average Value
Number
Average Value
Number
Average Value
Number
Average Value
LOANS ORIGINATED
50
$139,425
48
$124,674
127
$146,055
23
$36,187
8
$74,862
11
$68,856
APPLICATIONS APPROVED, NOT ACCEPTED
5
$173,998
4
$129,092
19
$121,015
3
$26,823
2
$100,545
5
$68,582
APPLICATIONS DENIED
10
$106,256
19
$188,633
69
$129,792
27
$32,265
3
$61,853
12
$55,812
APPLICATIONS WITHDRAWN
7
$140,926
5
$101,896
45
$135,821
4
$88,742
5
$70,130
1
$116,230
FILES CLOSED FOR INCOMPLETENESS
1
$26,540
2
$40,730
16
$150,876
4
$53,110
0
$0
3
$43,833
Aggregated Statistics For Year 2008 (Based on 4 partial tracts)
A) FHA, FSA/RHS & VA Home Purchase Loans
B) Conventional Home Purchase Loans
C) Refinancings
D) Home Improvement Loans
F) Non-occupant Loans on < 5 Family Dwellings (A B C & D)
G) Loans On Manufactured Home Dwelling (A B C & D)
Number
Average Value
Number
Average Value
Number
Average Value
Number
Average Value
Number
Average Value
Number
Average Value
LOANS ORIGINATED
50
$129,731
69
$139,451
96
$131,651
44
$28,894
12
$96,660
11
$74,586
APPLICATIONS APPROVED, NOT ACCEPTED
0
$0
18
$133,189
14
$145,305
8
$45,315
2
$69,150
11
$83,748
APPLICATIONS DENIED
7
$103,977
28
$71,907
79
$118,351
59
$44,943
7
$72,950
14
$59,754
APPLICATIONS WITHDRAWN
9
$129,044
14
$124,030
27
$136,142
10
$60,369
2
$65,205
4
$130,632
FILES CLOSED FOR INCOMPLETENESS
1
$61,410
3
$136,807
13
$151,933
2
$84,440
1
$56,870
0
$0
Aggregated Statistics For Year 2007 (Based on 4 partial tracts)
A) FHA, FSA/RHS & VA Home Purchase Loans
B) Conventional Home Purchase Loans
C) Refinancings
D) Home Improvement Loans
F) Non-occupant Loans on < 5 Family Dwellings (A B C & D)
G) Loans On Manufactured Home Dwelling (A B C & D)
Number
Average Value
Number
Average Value
Number
Average Value
Number
Average Value
Number
Average Value
Number
Average Value
LOANS ORIGINATED
29
$125,017
188
$114,375
147
$131,131
64
$47,291
30
$87,462
19
$75,722
APPLICATIONS APPROVED, NOT ACCEPTED
0
$0
20
$81,352
25
$177,880
12
$47,191
2
$71,505
8
$57,392
APPLICATIONS DENIED
5
$89,506
53
$113,399
132
$119,791
64
$48,812
16
$104,549
11
$65,249
APPLICATIONS WITHDRAWN
5
$91,666
24
$109,959
72
$135,544
6
$64,808
1
$7,580
2
$89,405
FILES CLOSED FOR INCOMPLETENESS
0
$0
9
$124,878
29
$149,857
2
$16,340
0
$0
2
$73,510
Aggregated Statistics For Year 2006 (Based on 4 partial tracts)
A) FHA, FSA/RHS & VA Home Purchase Loans
B) Conventional Home Purchase Loans
C) Refinancings
D) Home Improvement Loans
E) Loans on Dwellings For 5+ Families
F) Non-occupant Loans on < 5 Family Dwellings (A B C & D)
G) Loans On Manufactured Home Dwelling (A B C & D)
Number
Average Value
Number
Average Value
Number
Average Value
Number
Average Value
Number
Average Value
Number
Average Value
Number
Average Value
LOANS ORIGINATED
30
$122,640
253
$90,841
158
$120,380
60
$44,799
0
$0
28
$89,429
26
$80,615
APPLICATIONS APPROVED, NOT ACCEPTED
3
$105,630
51
$76,741
31
$131,286
9
$51,632
0
$0
4
$143,448
21
$64,319
APPLICATIONS DENIED
4
$94,748
69
$79,640
174
$109,648
60
$40,374
1
$151,640
31
$76,982
35
$62,090
APPLICATIONS WITHDRAWN
5
$124,466
45
$84,415
112
$120,687
8
$91,616
0
$0
5
$71,944
6
$94,585
FILES CLOSED FOR INCOMPLETENESS
1
$44,730
11
$109,338
31
$127,027
1
$75,820
0
$0
2
$163,015
2
$56,105
Aggregated Statistics For Year 2005 (Based on 4 partial tracts)
A) FHA, FSA/RHS & VA Home Purchase Loans
B) Conventional Home Purchase Loans
C) Refinancings
D) Home Improvement Loans
E) Loans on Dwellings For 5+ Families
F) Non-occupant Loans on < 5 Family Dwellings (A B C & D)
G) Loans On Manufactured Home Dwelling (A B C & D)
Number
Average Value
Number
Average Value
Number
Average Value
Number
Average Value
Number
Average Value
Number
Average Value
Number
Average Value
LOANS ORIGINATED
33
$104,027
251
$119,431
209
$109,371
58
$55,298
0
$0
26
$73,538
37
$69,682
APPLICATIONS APPROVED, NOT ACCEPTED
6
$107,122
79
$69,605
33
$101,092
9
$90,321
0
$0
1
$68,240
27
$58,237
APPLICATIONS DENIED
6
$100,847
102
$75,917
232
$102,396
53
$38,999
0
$0
13
$73,835
49
$57,627
APPLICATIONS WITHDRAWN
2
$104,305
53
$96,463
134
$124,729
26
$222,877
0
$0
12
$100,965
4
$100,175
FILES CLOSED FOR INCOMPLETENESS
2
$81,955
19
$96,219
45
$111,892
1
$49,670
1
$151,640
0
$0
0
$0
Aggregated Statistics For Year 2004 (Based on 4 partial tracts)
A) FHA, FSA/RHS & VA Home Purchase Loans
B) Conventional Home Purchase Loans
C) Refinancings
D) Home Improvement Loans
F) Non-occupant Loans on < 5 Family Dwellings (A B C & D)
G) Loans On Manufactured Home Dwelling (A B C & D)
Number
Average Value
Number
Average Value
Number
Average Value
Number
Average Value
Number
Average Value
Number
Average Value
LOANS ORIGINATED
31
$110,680
207
$92,728
271
$111,458
47
$44,997
24
$84,065
34
$81,305
APPLICATIONS APPROVED, NOT ACCEPTED
1
$78,480
63
$70,363
47
$94,844
6
$46,842
6
$67,883
18
$39,098
APPLICATIONS DENIED
7
$123,819
66
$76,763
284
$100,192
43
$32,034
13
$99,150
41
$62,295
APPLICATIONS WITHDRAWN
4
$124,652
22
$97,677
145
$103,694
11
$70,550
9
$66,517
14
$76,018
FILES CLOSED FOR INCOMPLETENESS
0
$0
4
$148,820
59
$118,330
0
$0
3
$54,440
1
$143,050
Aggregated Statistics For Year 2003 (Based on 4 partial tracts)
A) FHA, FSA/RHS & VA Home Purchase Loans
B) Conventional Home Purchase Loans
C) Refinancings
D) Home Improvement Loans
F) Non-occupant Loans on < 5 Family Dwellings (A B C & D)
Number
Average Value
Number
Average Value
Number
Average Value
Number
Average Value
Number
Average Value
LOANS ORIGINATED
41
$108,242
187
$92,059
468
$101,409
44
$45,457
31
$59,253
APPLICATIONS APPROVED, NOT ACCEPTED
3
$117,883
25
$76,096
55
$110,725
9
$28,152
4
$67,550
APPLICATIONS DENIED
7
$98,797
43
$77,609
319
$92,494
36
$39,325
15
$62,651
APPLICATIONS WITHDRAWN
1
$58,610
18
$86,208
139
$96,476
8
$34,591
5
$65,454
FILES CLOSED FOR INCOMPLETENESS
1
$96,360
4
$119,208
21
$95,377
1
$26,540
2
$51,160
Aggregated Statistics For Year 1999 (Based on 2 partial tracts)
A) FHA, FSA/RHS & VA Home Purchase Loans
B) Conventional Home Purchase Loans
C) Refinancings
D) Home Improvement Loans
F) Non-occupant Loans on < 5 Family Dwellings (A B C & D)
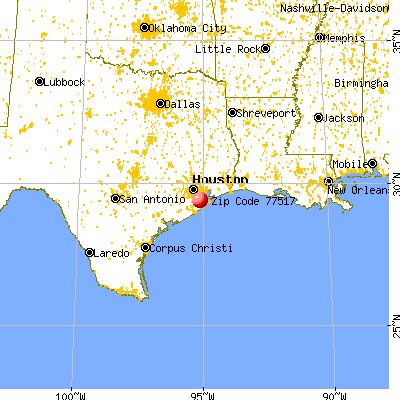


 Nearest zip codes: 77510, 77511, 77563, 77539, 77591, 77573.