Estimated zip code population in 2022: 10,590 Zip code population in 2010: 8,673 Zip code population in 2000: 7,084
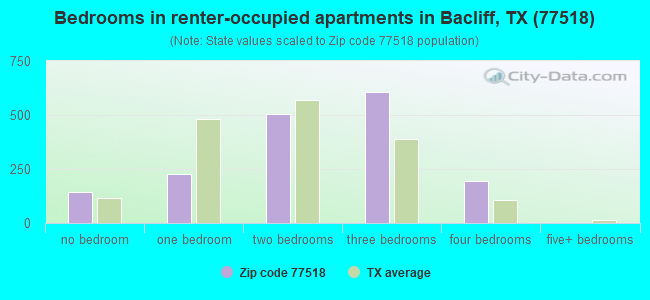
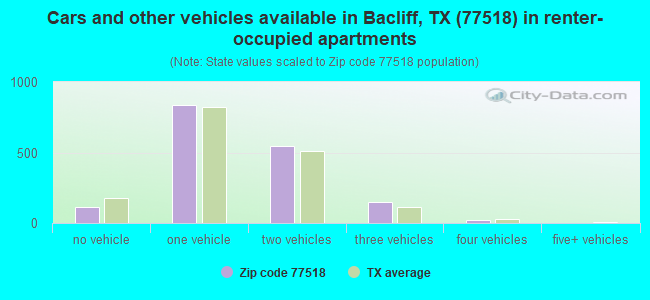
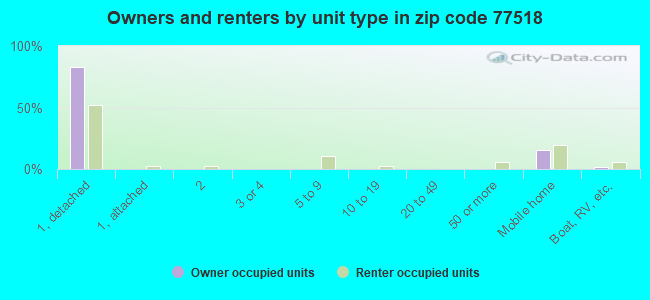
Houses and condos: 4,088 Renter-occupied apartments: 1,668
% of renters here:
44%
State:
38%
March 2022 cost of living index in zip code 77518: 96.0 (near average, U.S. average is 100)
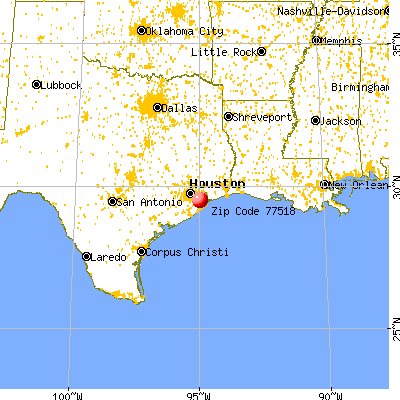
Land area: 2.9 sq. mi. Water area: 0.0 sq. mi.
Population density: 3,652 people per square mile
(average).
OSM Map
General Map
Google Map
MSN Map
OSM Map
General Map
Google Map
MSN Map
OSM Map
General Map
Google Map
MSN Map
OSM Map
General Map
Google Map
MSN Map
Please wait while loading the map...
Real estate property taxes paid for housing units in 2022:
This zip code:
1.1% ($2,080)
Texas:
1.5% ($4,050)
Median real estate property taxes paid for housing units with mortgages in 2022: $4,769 (2.0%) Median real estate property taxes paid for housing units with no mortgage in 2022: $1,727 (1.1%)
Business Search- 14 Million verified businesses
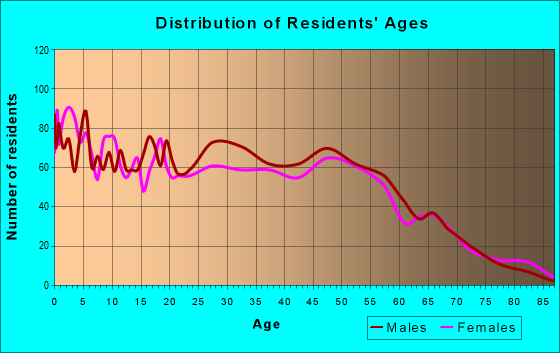
Males: 5,024
(47.4%)
Females: 5,565
(52.6%)
For population 25 years and over in 77518:
High school or higher: 76.1%
Bachelor's degree or higher: 20.4%
Graduate or professional degree: 4.2%
Unemployed: 5.7%
Mean travel time to work (commute): 27.4 minutes
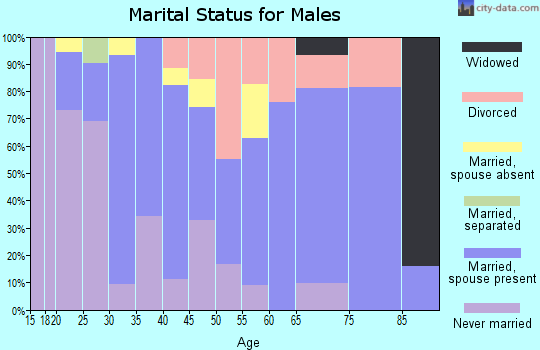
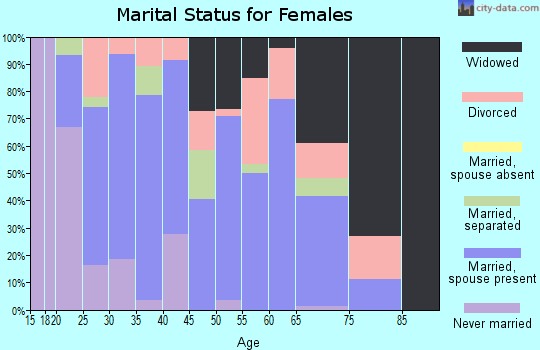
For population 15 years and over in 77518:
Never married: 32.3%
Now married: 45.2%
Separated: 2.4%
Widowed: 5.4%
Divorced: 14.7%
Zip code 77518 compared to state average:
Black race population percentage below state average.
Length of stay since moving in significantly above state average.
Number of college students below state average.
Percentage of population with a bachelor's degree or higher below state average.
Averages for the 2020 tax year for zip code 77518, filed in 2021:
Average Adjusted Gross Income (AGI) in 2020: $45,856 (Individual Income Tax Returns)
Here:
$45,856
State:
$77,054
Salary/wage: $42,479 (reported on 81.0% of returns)
Here:
$42,479
State:
$62,766
(% of AGI for various income ranges: 1183.9% for AGIs below $25k, 3428.4% for AGIs $25k-50k, 6529.6% for AGIs $50k-75k, 9740.0% for AGIs $75k-100k, 15360.4% for AGIs $100k-200k, 85160.0% for AGIs over 200k)
Taxable interest for individuals: $1,880 (reported on 12.9% of returns)
This zip code:
$1,880
Texas:
$2,665
(% of AGI for various income ranges: 4.5% for AGIs below $25k, 10.1% for AGIs $25k-50k, 24.3% for AGIs $50k-75k, 9.2% for AGIs $75k-100k, 65.6% for AGIs $100k-200k, 3375.0% for AGIs over 200k)
Ordinary dividends: $6,924 (reported on 6.1% of returns)
Here:
$6,924
State:
$10,044
(% of AGI for various income ranges: 4.2% for AGIs below $25k, 24.3% for AGIs $25k-50k, 50.9% for AGIs $50k-75k, 26.4% for AGIs $75k-100k, 137.6% for AGIs $100k-200k, 5255.0% for AGIs over 200k)
Net capital gain/loss in AGI: +$8,848 (reported on 6.5% of returns)
Here:
+$8,848
State:
+$39,590
(% of AGI for various income ranges: 1.6% for AGIs below $25k, 12.6% for AGIs $25k-50k, 39.6% for AGIs $50k-75k, 92.0% for AGIs $75k-100k, 374.0% for AGIs $100k-200k, 6210.0% for AGIs over 200k)
Profit/loss from business: +$6,298 (reported on 22.6% of returns)
Here:
+$6,298
State:
+$10,888
(% of AGI for various income ranges: 224.9% for AGIs below $25k, 126.8% for AGIs $25k-50k, 154.4% for AGIs $75k-100k, 698.4% for AGIs $100k-200k)
Taxable individual retirement arrangement distribution: $18,980 (reported on 4.2% of returns)
77518:
$18,980
Texas:
$24,740
(% of AGI for various income ranges: 26.1% for AGIs below $25k, 46.5% for AGIs $25k-50k, 176.2% for AGIs $50k-75k, 95.2% for AGIs $75k-100k, 742.8% for AGIs $100k-200k)
Total itemized deductions: $29,730 (reported on 4.2% of returns)
Here:
$29,730
State:
$40,428
(% of AGI for various income ranges: 127.8% for AGIs $25k-50k, 289.4% for AGIs $50k-75k, 319.6% for AGIs $75k-100k, 1008.8% for AGIs $100k-200k)
Charity contributions: $10,757 (reported on 3.0% of returns)
Here:
$10,757
State:
$18,201
(% of AGI for various income ranges: 22.3% for AGIs $25k-50k, 51.3% for AGIs $50k-75k, 66.8% for AGIs $75k-100k, 350.8% for AGIs $100k-200k)
Taxes paid: $5,900 (reported on 4.2% of returns)
77518:
$5,900
State:
$7,821
(% of AGI for various income ranges: 22.5% for AGIs $25k-50k, 57.0% for AGIs $50k-75k, 68.8% for AGIs $75k-100k, 206.8% for AGIs $100k-200k)
Earned income credit: $2,598 (reported on 27.2% of returns)
Here:
$2,598
State:
$2,584
(% of AGI for various income ranges: 157.2% for AGIs below $25k, 87.7% for AGIs $25k-50k)
Percentage of individuals using paid preparers for their 2020 taxes: 92.2%
Here:
92%
State:
92%
(% for various income ranges: 91.2% for AGIs below $25k, 94.2% for AGIs $25k-50k, 94.9% for AGIs $50k-75k, 90.9% for AGIs $75k-100k, 89.5% for AGIs $100k-200k, 83.3% for AGIs over 200k)
Averages for the 2012 tax year for zip code 77518, filed in 2013:
Average Adjusted Gross Income (AGI) in 2012: $41,818 (Individual Income Tax Returns)
Here:
$41,818
State:
$65,384
Salary/wage: $39,381 (reported on 83.5% of returns)
Here:
$39,381
State:
$52,524
(% of AGI for various income ranges: 73.6% for AGIs below $25k, 85.0% for AGIs $25k-50k, 86.2% for AGIs $50k-75k, 82.1% for AGIs $75k-100k, 79.7% for AGIs $100k-200k, 53.8% for AGIs over 200k)
Taxable interest for individuals: $1,408 (reported on 18.0% of returns)
This zip code:
$1,408
Texas:
$2,372
(% of AGI for various income ranges: 0.6% for AGIs below $25k, 0.5% for AGIs $25k-50k, 0.3% for AGIs $50k-75k, 0.4% for AGIs $75k-100k, 0.3% for AGIs $100k-200k, 2.2% for AGIs over 200k)
Ordinary dividends: $4,856 (reported on 6.8% of returns)
Here:
$4,856
State:
$9,721
(% of AGI for various income ranges: 0.7% for AGIs below $25k, 0.2% for AGIs $25k-50k, 0.4% for AGIs $50k-75k, 0.5% for AGIs $75k-100k, 2.1% for AGIs $100k-200k)
Net capital gain/loss in AGI: +$22,850 (reported on 6.0% of returns)
Here:
+$22,850
State:
+$35,319
(% of AGI for various income ranges: 0.5% for AGIs $50k-75k, 0.3% for AGIs $75k-100k, 1.2% for AGIs $100k-200k, 27.4% for AGIs over 200k)
Profit/loss from business: +$8,735 (reported on 20.8% of returns)
Here:
+$8,735
State:
+$13,732
(% of AGI for various income ranges: 15.6% for AGIs below $25k, 5.3% for AGIs $25k-50k, 1.6% for AGIs $50k-75k, 0.7% for AGIs $75k-100k, 2.3% for AGIs $100k-200k)
Taxable individual retirement arrangement distribution: $18,138 (reported on 5.3% of returns)
77518:
$18,138
Texas:
$19,511
(% of AGI for various income ranges: 1.5% for AGIs below $25k, 1.0% for AGIs $25k-50k, 1.3% for AGIs $50k-75k, 3.9% for AGIs $75k-100k, 4.8% for AGIs $100k-200k)
Total itemized deductions: $19,580 (21% of AGI, reported on 15.3% of returns)
Here:
$19,580
State:
$24,724
Here:
20.7% of AGI
State:
15.9% of AGI
(% of AGI for various income ranges: 4.0% for AGIs below $25k, 5.7% for AGIs $25k-50k, 8.8% for AGIs $50k-75k, 10.1% for AGIs $75k-100k, 7.9% for AGIs $100k-200k, 6.4% for AGIs over 200k)
Charity contributions: $3,871 (reported on 10.5% of returns)
Here:
$3,871
State:
$6,808
(% of AGI for various income ranges: 0.2% for AGIs below $25k, 0.6% for AGIs $25k-50k, 1.2% for AGIs $50k-75k, 1.4% for AGIs $75k-100k, 1.4% for AGIs $100k-200k, 0.8% for AGIs over 200k)
Taxes paid: $4,700 (reported on 15.0% of returns)
77518:
$4,700
State:
$6,921
(% of AGI for various income ranges: 0.6% for AGIs below $25k, 1.1% for AGIs $25k-50k, 1.8% for AGIs $50k-75k, 2.3% for AGIs $75k-100k, 2.2% for AGIs $100k-200k, 2.3% for AGIs over 200k)
Earned income credit: $2,607 (reported on 29.1% of returns)
Here:
$2,607
State:
$2,570
(% of AGI for various income ranges: 9.6% for AGIs below $25k, 1.8% for AGIs $25k-50k)
Percentage of individuals using paid preparers for their 2012 taxes: 52.4%
Here:
52%
State:
51%
(% for various income ranges: 52.6% for AGIs below $25k, 52.1% for AGIs $25k-50k, 50.0% for AGIs $50k-75k, 51.9% for AGIs $75k-100k, 53.3% for AGIs $100k-200k, 75.0% for AGIs over 200k)
Averages for the 2004 tax year for zip code 77518, filed in 2005:
Average Adjusted Gross Income (AGI) in 2004: $34,005 (Individual Income Tax Returns)
Here:
$34,005
State:
$47,881
Salary/wage: $33,934 (reported on 83.6% of returns)
Here:
$33,934
State:
$41,947
(% of AGI for various income ranges: 115.7% for AGIs below $10k, 77.3% for AGIs $10k-25k, 89.9% for AGIs $25k-50k, 87.4% for AGIs $50k-75k, 85.2% for AGIs $75k-100k, 70.3% for AGIs over 100k)
Taxable interest for individuals: $1,083 (reported on 23.4% of returns)
This zip code:
$1,083
Texas:
$2,255
(% of AGI for various income ranges: 2.4% for AGIs below $10k, 0.9% for AGIs $10k-25k, 0.5% for AGIs $25k-50k, 0.7% for AGIs $50k-75k, 0.5% for AGIs $75k-100k, 1.0% for AGIs over 100k)
Taxable dividends: $1,745 (reported on 9.4% of returns)
Here:
$1,745
State:
$4,261
(% of AGI for various income ranges: 1.8% for AGIs below $10k, 0.5% for AGIs $10k-25k, 0.3% for AGIs $25k-50k, 0.3% for AGIs $50k-75k, 0.3% for AGIs $75k-100k, 0.8% for AGIs over 100k)
Net capital gain/loss: +$6,654 (reported on 8.5% of returns)
Here:
+$6,654
State:
+$16,110
(% of AGI for various income ranges: -0.2% for AGIs below $10k, -0.1% for AGIs $10k-25k, 0.3% for AGIs $25k-50k, 1.1% for AGIs $50k-75k, 1.4% for AGIs $75k-100k, 5.6% for AGIs over 100k)
Profit/loss from business: +$6,586 (reported on 21.1% of returns)
Here:
+$6,586
State:
+$11,013
(% of AGI for various income ranges: 37.3% for AGIs below $10k, 13.0% for AGIs $10k-25k, 3.1% for AGIs $25k-50k, 1.3% for AGIs $50k-75k, 0.9% for AGIs $75k-100k, 0.5% for AGIs over 100k)
IRA payment deduction: $3,318 (reported on 1.3% of returns)
77518:
$3,318
Texas:
$3,120
Total itemized deductions: $15,977 (23% of AGI, reported on 18.2% of returns)
Here:
$15,977
State:
$19,631
Here:
23.0% of AGI
State:
18.9% of AGI
(% of AGI for various income ranges: 7.2% for AGIs below $10k, 4.4% for AGIs $10k-25k, 7.7% for AGIs $25k-50k, 11.2% for AGIs $50k-75k, 10.4% for AGIs $75k-100k, 8.6% for AGIs over 100k)
Charity contributions deductions: $2,527 (3% of AGI, reported on 13.2% of returns)
Here:
$2,527
State:
$4,753
Here:
3.5% of AGI
State:
4.2% of AGI
(% of AGI for various income ranges: 0.3% for AGIs $10k-25k, 0.7% for AGIs $25k-50k, 1.4% for AGIs $50k-75k, 1.3% for AGIs $75k-100k, 1.2% for AGIs over 100k)
Total tax: $4,999 (reported on 69.8% of returns)
77518:
$4,999
State:
$9,058
(% of AGI for various income ranges: 7.6% for AGIs below $10k, 4.3% for AGIs $10k-25k, 6.3% for AGIs $25k-50k, 9.5% for AGIs $50k-75k, 11.7% for AGIs $75k-100k, 19.3% for AGIs over 100k)
Earned income credit: $2,003 (reported on 28.5% of returns)
Here:
$2,003
State:
$2,024
Percentage of individuals using paid preparers for their 2004 taxes: 55.5%
Here:
55%
State:
57%
(% for various income ranges: 51.1% for AGIs below $10k, 62.0% for AGIs $10k-25k, 55.5% for AGIs $25k-50k, 47.9% for AGIs $50k-75k, 50.3% for AGIs $75k-100k, 66.9% for AGIs over 100k)
Household received Food Stamps/SNAP in the past 12 months: 1,216 Household did not receive Food Stamps/SNAP in the past 12 months: 2,655
Women who had a birth in the past 12 months: 291 (147 now married, 140 unmarried) Women who did not have a birth in the past 12 months: 2,676 (957 now married, 1,725 unmarried)
Housing units in zip code 77518 with a mortgage: 955 (44 second mortgage, 27 both second mortgage and home equity loan) Median monthly owner costs for units with a mortgage: $1,644 Median monthly owner costs for units without a mortgage: $559
Residents with income below the poverty level in 2022:
This zip code:
27.8%
Whole state:
14.0%
Residents with income below 50% of the poverty level in 2022:
This zip code:
19.7%
Whole state:
7.4%
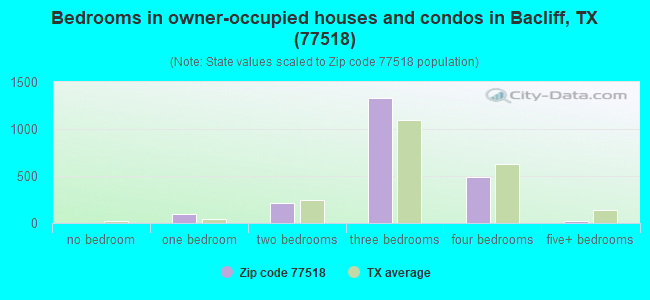
Median number of rooms in houses and condos:
Here:
5.7
State:
6.3
Median number of rooms in apartments:
Here:
4.7
State:
4.0
Notable locations in this zip code not listed on our city pages
1,569 married couples with children.
1,429 single-parent households (64 men, 1,365 women).
63.7% of residents of 77518 zip code speak English at home.
33.5% of residents speak Spanish at home (67% very well, 13% well, 14% not well, 5% not at all).
0.1% of residents speak other Indo-European language at home (100% very well).
1.7% of residents speak Asian or Pacific Island language at home (49% very well, 51% not at all).
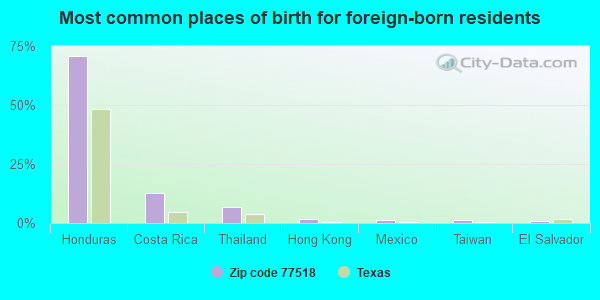
Foreign born population: 1,750 (16.5%) (26.8% of them are naturalized citizens)
This zip code:
16.5%
Whole state:
17.2%
71%Honduras
13%Costa Rica
7%Thailand
2%Hong Kong
1%Mexico
1%Taiwan
1%El Salvador
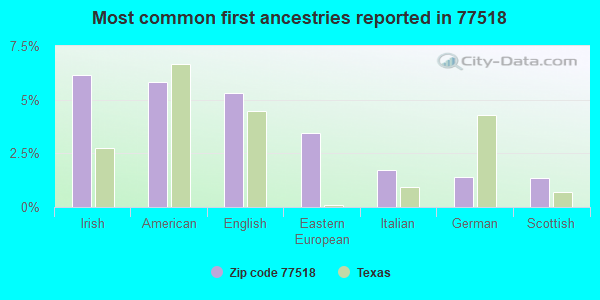
6%Irish
6%American
5%English
3%Eastern European
2%Italian
1%German
1%Scottish
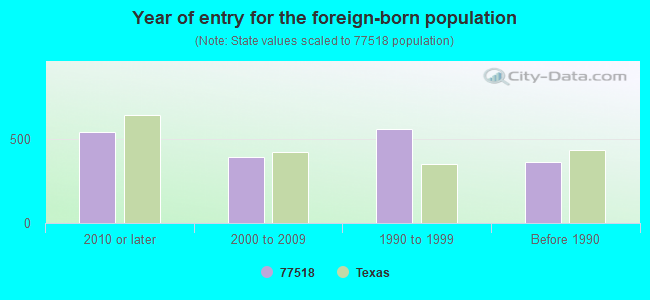
Year of entry for the foreign-born population
5392010 or later
3922000 to 2009
5601990 to 1999
364Before 1990
Facilities with environmental interests located in this zip code:
BACLIFF MUNI UTIL DIST (1 1/2 M N OF THE INTX OF STATE HWY 146 in BACLIFF, TX)
(Integrated Compliance Information System) - ICIS-06-1998-0970, FORMAL ENFORCEMENT ACTION Business SIC classification: SEWERAGE SYSTEMS
B&T HARDY TRUCKING INC (4804 8TH STREET in BACLIFF, TX)
(Resource Conservation and Recovery Act (tracking hazardous waste)) Alternative names: HARDY TRAVIS TRKNG
BACLIFF MUD (4303 12TH ST in BACLIFF, TX)
National Pollutant Discharge Elimination System MAJOR (Tracking pollutant discharge elimination systems) - permit COMMUNITY WATER SYSTEM (SDWIS) Business SIC classification: SEWERAGE SYSTEMS
Housing units lacking complete plumbing facilities: 2.1% Housing units lacking complete kitchen facilities: 4.9%
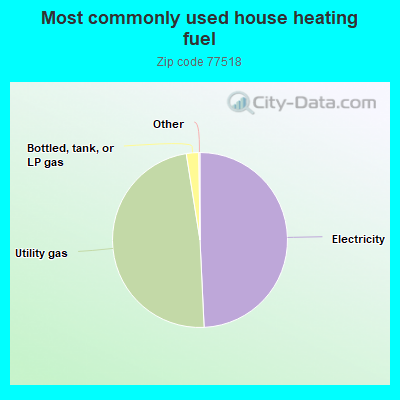
49.3%Electricity
48.3%Utility gas
2.3%Bottled, tank, or LP gas
Population in 1990: 5,465. Population change in the 1990s: +1,619 (+29.6%).
Place of birth for U.S.-born residents:
This state: 6,387
Northeast: 436
Midwest: 565
South: 995
West: 304
43% of the 77518 zip code residents lived in the same house 5 years ago. Out of people who lived in different houses, 57% lived in this county. Out of people who lived in different counties, 50% lived in Texas.
84% of the 77518 zip code residents lived in the same house 1 year ago. Out of people who lived in different houses, 50% moved from this county. Out of people who lived in different houses, 29% moved from different county within same state. Out of people who lived in different houses, 16% moved from different state. Out of people who lived in different houses, 4% moved from abroad.
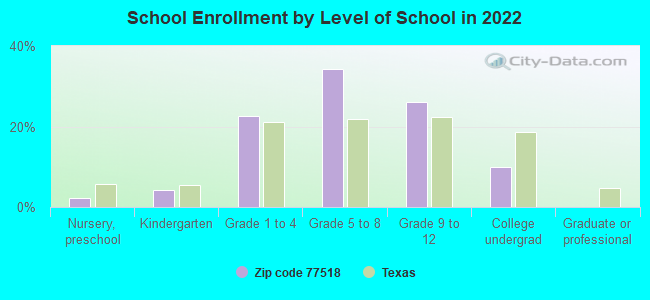
Private vs. public school enrollment:
Students in private schools in grades 1 to 8 (elementary and middle school): 8
Here:
0.5%
Texas:
8.8%
Students in private schools in grades 9 to 12 (high school): 10
Here:
1.5%
Texas:
8.0%
Students in private undergraduate colleges: 54
Here:
19.0%
Texas:
16.2%
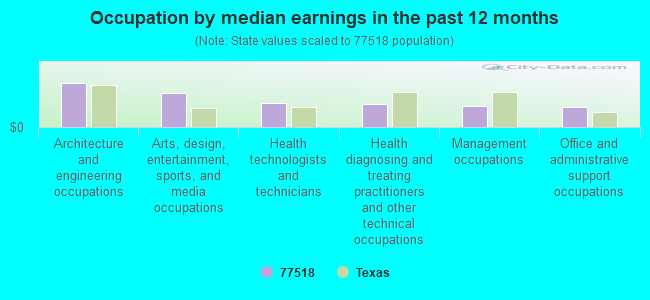
Occupation by median earnings in the past 12 months ($)
125,736Architecture and engineering occupations
96,254Arts, design, entertainment, sports, and media occupations
68,243Health technologists and technicians
66,915Health diagnosing and treating practitioners and other technical occupations
60,196Management occupations
56,300Office and administrative support occupations
Top industries in this zip code by the number of employees in 2005:
Construction: All Other Specialty Trade Contractors (10-19: 1, 1-4: 1)
Other Services (except Public Administration): Commercial and Industrial Machinery and Equipment (except Automotive and Electronic) Repair and Maintenance (10-19: 1)
Real Estate and Rental and Leasing: Lessors of Nonresidential Buildings (except Miniwarehouses) (10-19: 1)
Fatal accident statistics in 2014:
Fatal accident count: 2
Vehicles involved in fatal accidents: 2
Fatal accidents caused by drunken drivers: 0
Fatalities: 2
Persons involved in fatal accidents: 6
Pedestrians involved in fatal accidents: 1
Fatal accident statistics in 2012:
Fatal accident count: 1
Vehicles involved in fatal accidents: 1
Fatal accidents caused by drunken drivers: 0
Fatalities: 1
Persons involved in fatal accidents: 1
Pedestrians involved in fatal accidents: 1
Home Mortgage Disclosure Act Aggregated Statistics For Year 2009 (Based on 6 partial tracts)
A) FHA, FSA/RHS & VA Home Purchase Loans
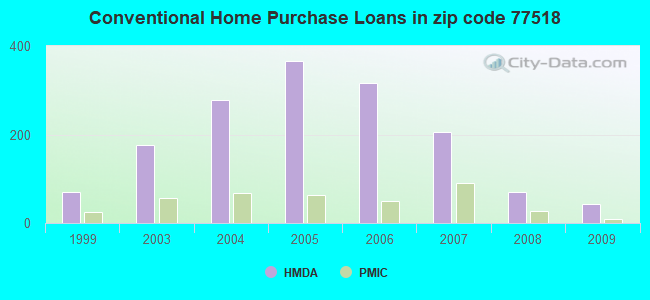
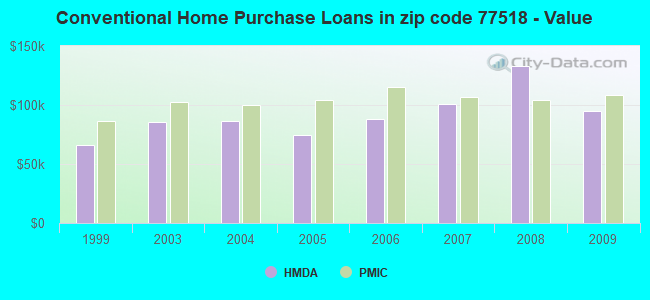
B) Conventional Home Purchase Loans
C) Refinancings
D) Home Improvement Loans
E) Loans on Dwellings For 5+ Families
F) Non-occupant Loans on < 5 Family Dwellings (A B C & D)
G) Loans On Manufactured Home Dwelling (A B C & D)
Number
Average Value
Number
Average Value
Number
Average Value
Number
Average Value
Number
Average Value
Number
Average Value
Number
Average Value
LOANS ORIGINATED
66
$116,136
42
$94,608
76
$147,273
13
$30,980
0
$0
14
$159,812
4
$54,398
APPLICATIONS APPROVED, NOT ACCEPTED
4
$103,842
6
$60,560
7
$94,110
1
$4,490
0
$0
1
$4,490
6
$56,238
APPLICATIONS DENIED
16
$129,119
13
$162,695
60
$121,070
20
$36,979
1
$176,410
9
$74,316
10
$55,124
APPLICATIONS WITHDRAWN
10
$124,197
5
$134,814
29
$125,644
2
$12,170
0
$0
1
$57,180
1
$50,000
FILES CLOSED FOR INCOMPLETENESS
2
$240,995
3
$83,930
13
$78,186
2
$10,890
0
$0
1
$61,540
0
$0
Aggregated Statistics For Year 2008 (Based on 6 partial tracts)
A) FHA, FSA/RHS & VA Home Purchase Loans
B) Conventional Home Purchase Loans
C) Refinancings
D) Home Improvement Loans
F) Non-occupant Loans on < 5 Family Dwellings (A B C & D)
G) Loans On Manufactured Home Dwelling (A B C & D)
Number
Average Value
Number
Average Value
Number
Average Value
Number
Average Value
Number
Average Value
Number
Average Value
LOANS ORIGINATED
46
$111,794
69
$132,632
68
$130,894
18
$41,834
27
$133,380
5
$70,558
APPLICATIONS APPROVED, NOT ACCEPTED
1
$94,230
12
$62,948
15
$87,654
9
$26,983
6
$50,268
9
$52,383
APPLICATIONS DENIED
12
$148,315
35
$70,325
94
$107,669
45
$43,218
22
$70,123
21
$48,240
APPLICATIONS WITHDRAWN
8
$118,054
13
$170,535
25
$175,201
3
$25,527
6
$115,093
2
$17,100
FILES CLOSED FOR INCOMPLETENESS
0
$0
9
$88,057
8
$91,272
4
$35,195
5
$105,842
0
$0
Aggregated Statistics For Year 2007 (Based on 6 partial tracts)
A) FHA, FSA/RHS & VA Home Purchase Loans
B) Conventional Home Purchase Loans
C) Refinancings
D) Home Improvement Loans
E) Loans on Dwellings For 5+ Families
F) Non-occupant Loans on < 5 Family Dwellings (A B C & D)
G) Loans On Manufactured Home Dwelling (A B C & D)
Number
Average Value
Number
Average Value
Number
Average Value
Number
Average Value
Number
Average Value
Number
Average Value
Number
Average Value
LOANS ORIGINATED
28
$110,402
206
$100,516
96
$111,598
24
$33,779
1
$1,025,600
58
$84,791
7
$45,923
APPLICATIONS APPROVED, NOT ACCEPTED
1
$112,170
31
$69,562
36
$96,038
7
$53,917
0
$0
15
$90,585
8
$35,679
APPLICATIONS DENIED
6
$117,518
80
$86,008
163
$125,466
55
$33,106
0
$0
34
$75,812
20
$46,964
APPLICATIONS WITHDRAWN
7
$129,860
19
$90,604
67
$114,131
5
$58,140
0
$0
11
$117,039
1
$92,460
FILES CLOSED FOR INCOMPLETENESS
0
$0
15
$94,412
14
$105,797
0
$0
0
$0
5
$70,650
0
$0
Aggregated Statistics For Year 2006 (Based on 6 partial tracts)
A) FHA, FSA/RHS & VA Home Purchase Loans
B) Conventional Home Purchase Loans
C) Refinancings
D) Home Improvement Loans
E) Loans on Dwellings For 5+ Families
F) Non-occupant Loans on < 5 Family Dwellings (A B C & D)
G) Loans On Manufactured Home Dwelling (A B C & D)
Number
Average Value
Number
Average Value
Number
Average Value
Number
Average Value
Number
Average Value
Number
Average Value
Number
Average Value
LOANS ORIGINATED
21
$109,561
316
$87,877
111
$100,391
34
$36,807
2
$340,345
87
$69,827
22
$38,839
APPLICATIONS APPROVED, NOT ACCEPTED
2
$82,845
67
$73,603
27
$75,532
11
$46,369
0
$0
12
$61,073
17
$48,152
APPLICATIONS DENIED
2
$34,620
121
$88,975
159
$92,764
53
$29,463
0
$0
35
$69,817
35
$45,529
APPLICATIONS WITHDRAWN
6
$89,860
52
$75,257
102
$95,677
6
$41,458
0
$0
16
$59,894
1
$55,770
FILES CLOSED FOR INCOMPLETENESS
0
$0
16
$104,794
35
$116,890
1
$13,460
0
$0
6
$68,493
1
$28,840
Aggregated Statistics For Year 2005 (Based on 6 partial tracts)
A) FHA, FSA/RHS & VA Home Purchase Loans
B) Conventional Home Purchase Loans
C) Refinancings
D) Home Improvement Loans
E) Loans on Dwellings For 5+ Families
F) Non-occupant Loans on < 5 Family Dwellings (A B C & D)
G) Loans On Manufactured Home Dwelling (A B C & D)
Number
Average Value
Number
Average Value
Number
Average Value
Number
Average Value
Number
Average Value
Number
Average Value
Number
Average Value
LOANS ORIGINATED
27
$111,808
367
$74,255
137
$111,629
23
$76,786
1
$897,400
61
$83,477
14
$53,868
APPLICATIONS APPROVED, NOT ACCEPTED
0
$0
90
$60,572
27
$74,905
10
$21,903
0
$0
7
$70,903
30
$50,571
APPLICATIONS DENIED
11
$72,915
132
$87,821
171
$83,864
51
$30,426
0
$0
38
$79,008
29
$45,681
APPLICATIONS WITHDRAWN
4
$97,838
42
$78,433
90
$110,944
15
$178,935
0
$0
7
$94,589
0
$0
FILES CLOSED FOR INCOMPLETENESS
2
$123,085
19
$84,926
35
$95,732
2
$46,440
0
$0
3
$105,797
1
$50,640
Aggregated Statistics For Year 2004 (Based on 6 partial tracts)
A) FHA, FSA/RHS & VA Home Purchase Loans
B) Conventional Home Purchase Loans
C) Refinancings
D) Home Improvement Loans
E) Loans on Dwellings For 5+ Families
F) Non-occupant Loans on < 5 Family Dwellings (A B C & D)
G) Loans On Manufactured Home Dwelling (A B C & D)
Number
Average Value
Number
Average Value
Number
Average Value
Number
Average Value
Number
Average Value
Number
Average Value
Number
Average Value
LOANS ORIGINATED
52
$110,482
279
$86,117
186
$89,775
23
$41,053
1
$961,500
50
$86,922
24
$48,816
APPLICATIONS APPROVED, NOT ACCEPTED
7
$98,021
50
$75,038
57
$91,226
6
$29,225
0
$0
4
$104,728
17
$47,784
APPLICATIONS DENIED
10
$97,906
125
$61,918
204
$84,640
51
$29,446
0
$0
27
$78,096
47
$38,127
APPLICATIONS WITHDRAWN
6
$123,230
44
$94,210
110
$90,048
7
$68,211
0
$0
11
$102,250
1
$9,610
FILES CLOSED FOR INCOMPLETENESS
2
$105,845
14
$95,524
29
$92,132
1
$49,090
0
$0
1
$65,700
0
$0
Aggregated Statistics For Year 2003 (Based on 6 partial tracts)
A) FHA, FSA/RHS & VA Home Purchase Loans
B) Conventional Home Purchase Loans
C) Refinancings
D) Home Improvement Loans
E) Loans on Dwellings For 5+ Families
F) Non-occupant Loans on < 5 Family Dwellings (A B C & D)
Number
Average Value
Number
Average Value
Number
Average Value
Number
Average Value
Number
Average Value
Number
Average Value
LOANS ORIGINATED
54
$100,303
176
$85,219
293
$105,639
11
$30,525
3
$391,190
53
$90,159
APPLICATIONS APPROVED, NOT ACCEPTED
4
$102,715
34
$83,049
49
$99,277
4
$8,280
0
$0
5
$124,284
APPLICATIONS DENIED
5
$104,716
61
$65,870
230
$80,920
29
$17,454
0
$0
15
$84,280
APPLICATIONS WITHDRAWN
6
$96,175
32
$97,965
117
$71,139
2
$12,325
0
$0
5
$58,648
FILES CLOSED FOR INCOMPLETENESS
0
$0
13
$104,061
21
$100,704
1
$12,820
0
$0
2
$125,160
Aggregated Statistics For Year 1999 (Based on 3 partial tracts)
A) FHA, FSA/RHS & VA Home Purchase Loans
B) Conventional Home Purchase Loans
C) Refinancings
D) Home Improvement Loans
F) Non-occupant Loans on < 5 Family Dwellings (A B C & D)
2002 - 2018 National Fire Incident Reporting System (NFIRS) incidents
Based on the data from the years 2002 - 2018 the average number of fires per year is 25. The highest number of fire incidents - 58 took place in 2004, and the least - 3 in 2010. The data has an increasing trend.
When looking into fire subcategories, the most reports belonged to: Outside Fires (39.7%), and Structure Fires (39.0%).
Fire incident types reported to NFIRS in Zip Code 77518


 Nearest zip codes: 77565, 77539, 77586, 77573, 77591, 77058.
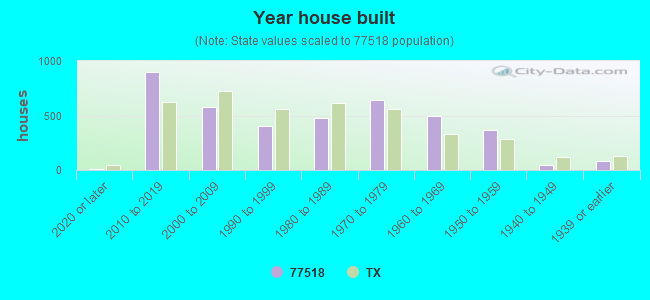


 Based on the data from the years 2002 - 2018 the average number of fires per year is 25. The highest number of fire incidents - 58 took place in 2004, and the least - 3 in 2010. The data has an increasing trend.
 When looking into fire subcategories, the most reports belonged to: Outside Fires (39.7%), and Structure Fires (39.0%).