Estimated zip code population in 2022: 3,296 Zip code population in 2010: 2,863 Zip code population in 2000: 2,696
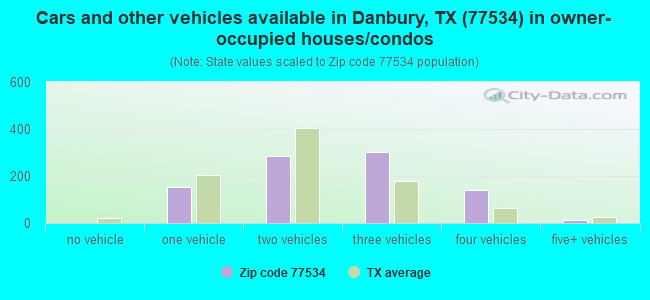
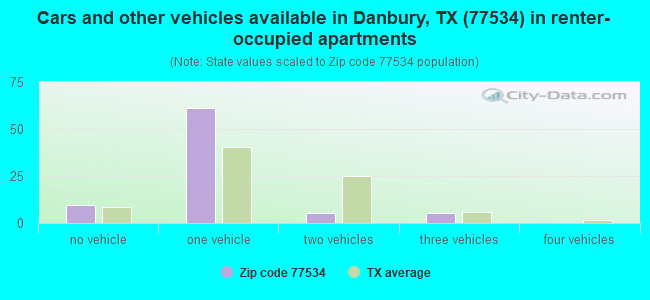
Houses and condos: 1,203 Renter-occupied apartments: 80
% of renters here:
8%
State:
38%
March 2022 cost of living index in zip code 77534: 86.5 (less than average, U.S. average is 100)
Land area: 36.0 sq. mi. Water area: 1.5 sq. mi.
Population density: 92 people per square mile
(very low).
OSM Map
General Map
Google Map
MSN Map
OSM Map
General Map
Google Map
MSN Map
OSM Map
General Map
Google Map
MSN Map
OSM Map
General Map
Google Map
MSN Map
Please wait while loading the map...
Real estate property taxes paid for housing units in 2022:
This zip code:
1.3% ($3,186)
Texas:
1.5% ($4,050)
Median real estate property taxes paid for housing units with mortgages in 2022: $3,825 (1.3%) Median real estate property taxes paid for housing units with no mortgage in 2022: $2,530 (1.1%)
Business Search- 14 Million verified businesses
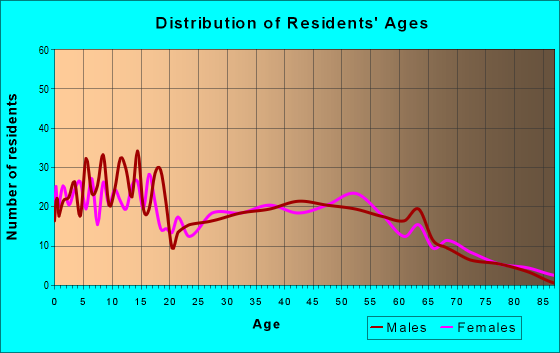
Males: 1,541
(46.8%)
Females: 1,754
(53.2%)
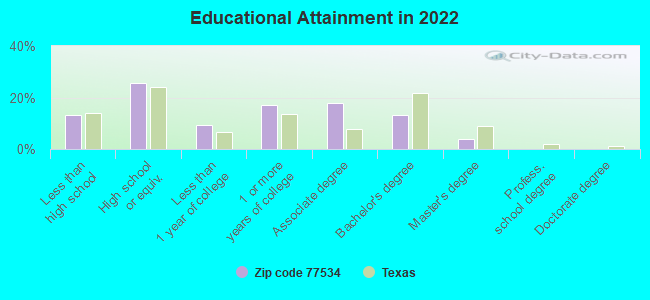
For population 25 years and over in 77534:
High school or higher: 86.7%
Bachelor's degree or higher: 17.0%
Graduate or professional degree: 4.0%
Unemployed: 4.2%
Mean travel time to work (commute): 32.5 minutes
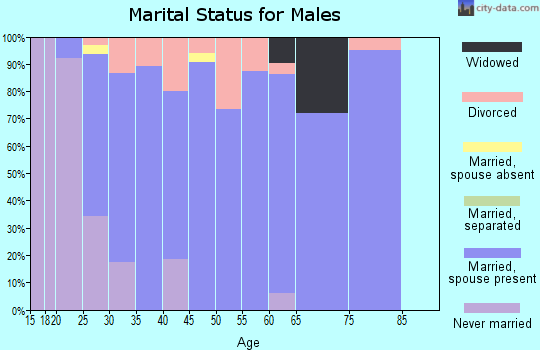
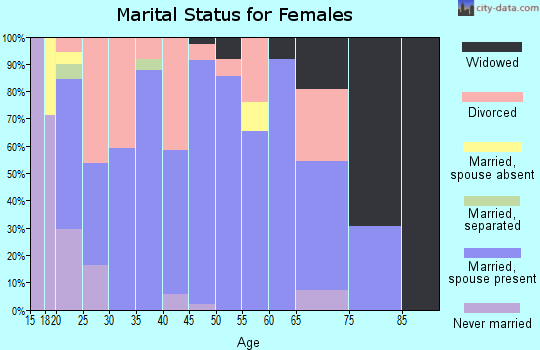
For population 15 years and over in 77534:
Never married: 33.9%
Now married: 54.7%
Separated: 0.2%
Widowed: 2.7%
Divorced: 8.5%
Zip code 77534 compared to state average:
Black race population percentage significantly below state average.
Foreign-born population percentage significantly below state average.
Renting percentage significantly below state average.
Length of stay since moving in above state average.
Percentage of population with a bachelor's degree or higher significantly below state average.
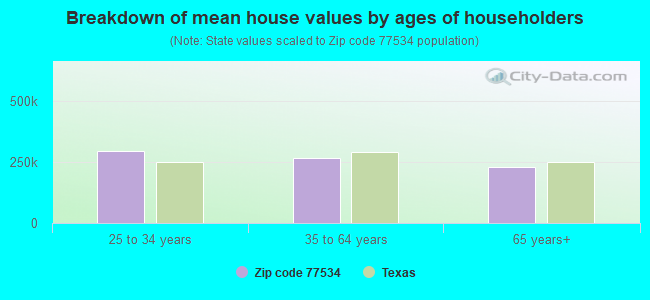
Estimated median house/condo value in 2022: $251,679
77534:
$251,679
Texas:
$275,400
According to our research of Texas and other state lists, there was 1 registered sex offender living in 77534 zip code as of May 21, 2024. The ratio of all residents to sex offenders in zip code 77534 is 2,691 to 1. The ratio of registered sex offenders to all residents in this zip code is much lower than the state average.
Median resident age:
This zip code:
35.1 years
Texas median age:
35.6 years
Average household size:
This zip code:
3.4 people
Texas:
2.6 people
Averages for the 2020 tax year for zip code 77534, filed in 2021:
Average Adjusted Gross Income (AGI) in 2020: $83,896 (Individual Income Tax Returns)
Here:
$83,896
State:
$77,054
Salary/wage: $78,038 (reported on 83.6% of returns)
Here:
$78,038
State:
$62,766
(% of AGI for various income ranges: 1262.5% for AGIs below $25k, 3837.1% for AGIs $25k-50k, 5951.9% for AGIs $50k-75k, 8368.3% for AGIs $75k-100k, 17282.6% for AGIs $100k-200k, 52316.0% for AGIs over 200k)
Taxable interest for individuals: $1,169 (reported on 25.7% of returns)
This zip code:
$1,169
Texas:
$2,665
(% of AGI for various income ranges: 7.5% for AGIs below $25k, 15.0% for AGIs $25k-50k, 14.4% for AGIs $50k-75k, 23.3% for AGIs $75k-100k, 26.8% for AGIs $100k-200k, 524.0% for AGIs over 200k)
Ordinary dividends: $3,500 (reported on 13.6% of returns)
Here:
$3,500
State:
$10,044
(% of AGI for various income ranges: 30.0% for AGIs below $25k, 40.6% for AGIs $50k-75k, 18.3% for AGIs $75k-100k, 77.4% for AGIs $100k-200k, 694.0% for AGIs over 200k)
Net capital gain/loss in AGI: +$10,058 (reported on 13.6% of returns)
Here:
+$10,058
State:
+$39,590
(% of AGI for various income ranges: 9.3% for AGIs below $25k, 34.4% for AGIs $50k-75k, 10.8% for AGIs $75k-100k, 155.8% for AGIs $100k-200k, 3042.0% for AGIs over 200k)
Profit/loss from business: +$4,437 (reported on 19.3% of returns)
Here:
+$4,437
State:
+$10,888
(% of AGI for various income ranges: 127.1% for AGIs below $25k, 83.3% for AGIs $25k-50k, 60.6% for AGIs $50k-75k, 204.2% for AGIs $75k-100k, 106.3% for AGIs $100k-200k, 196.0% for AGIs over 200k)
Taxable individual retirement arrangement distribution: $19,050 (reported on 8.6% of returns)
77534:
$19,050
Texas:
$24,740
(% of AGI for various income ranges: 143.6% for AGIs below $25k, 585.0% for AGIs $50k-75k, 498.9% for AGIs $100k-200k)
Total itemized deductions: $32,709 (reported on 7.9% of returns)
Here:
$32,709
State:
$40,428
(% of AGI for various income ranges: 548.1% for AGIs $50k-75k, 837.4% for AGIs $100k-200k, 2260.0% for AGIs over 200k)
Charity contributions: $11,810 (reported on 7.1% of returns)
Here:
$11,810
State:
$18,201
(% of AGI for various income ranges: 112.5% for AGIs $50k-75k, 250.5% for AGIs $100k-200k, 1050.0% for AGIs over 200k)
Taxes paid: $7,982 (reported on 7.9% of returns)
77534:
$7,982
State:
$7,821
(% of AGI for various income ranges: 127.5% for AGIs $50k-75k, 227.4% for AGIs $100k-200k, 484.0% for AGIs over 200k)
Earned income credit: $2,547 (reported on 13.6% of returns)
Here:
$2,547
State:
$2,584
(% of AGI for various income ranges: 118.9% for AGIs below $25k, 62.9% for AGIs $25k-50k)
Percentage of individuals using paid preparers for their 2020 taxes: 92.9%
Here:
93%
State:
92%
(% for various income ranges: 94.6% for AGIs below $25k, 87.1% for AGIs $25k-50k, 95.2% for AGIs $50k-75k, 100.0% for AGIs $75k-100k, 92.6% for AGIs $100k-200k, 90.0% for AGIs over 200k)
Averages for the 2012 tax year for zip code 77534, filed in 2013:
Average Adjusted Gross Income (AGI) in 2012: $70,159 (Individual Income Tax Returns)
Here:
$70,159
State:
$65,384
Salary/wage: $60,610 (reported on 86.4% of returns)
Here:
$60,610
State:
$52,524
(% of AGI for various income ranges: 72.9% for AGIs below $25k, 81.0% for AGIs $25k-50k, 82.5% for AGIs $50k-75k, 86.5% for AGIs $75k-100k, 88.4% for AGIs $100k-200k, 39.8% for AGIs over 200k)
Taxable interest for individuals: $589 (reported on 34.8% of returns)
This zip code:
$589
Texas:
$2,372
(% of AGI for various income ranges: 0.8% for AGIs below $25k, 0.1% for AGIs $25k-50k, 0.3% for AGIs $50k-75k, 0.2% for AGIs $75k-100k, 0.4% for AGIs $100k-200k, 0.2% for AGIs over 200k)
Ordinary dividends: $2,270 (reported on 15.2% of returns)
Here:
$2,270
State:
$9,721
(% of AGI for various income ranges: 1.5% for AGIs below $25k, 1.2% for AGIs $25k-50k, 0.3% for AGIs $50k-75k, 0.1% for AGIs $75k-100k, 0.3% for AGIs $100k-200k, 0.5% for AGIs over 200k)
Net capital gain/loss in AGI: +$41,538 (reported on 9.8% of returns)
Here:
+$41,538
State:
+$35,319
(% of AGI for various income ranges: 0.9% for AGIs $100k-200k, 24.2% for AGIs over 200k)
Profit/loss from business: +$6,917 (reported on 18.2% of returns)
Here:
+$6,917
State:
+$13,732
(% of AGI for various income ranges: 9.3% for AGIs below $25k, 2.6% for AGIs $25k-50k, 1.6% for AGIs $50k-75k, 2.9% for AGIs $75k-100k, 1.2% for AGIs $100k-200k)
Taxable individual retirement arrangement distribution: $16,667 (reported on 9.1% of returns)
77534:
$16,667
Texas:
$19,511
(% of AGI for various income ranges: 1.9% for AGIs below $25k, 4.1% for AGIs $25k-50k, 7.1% for AGIs $50k-75k, 1.9% for AGIs $100k-200k)
Total itemized deductions: $21,597 (16% of AGI, reported on 25.0% of returns)
Here:
$21,597
State:
$24,724
Here:
16.1% of AGI
State:
15.9% of AGI
(% of AGI for various income ranges: 6.9% for AGIs $25k-50k, 9.0% for AGIs $50k-75k, 10.1% for AGIs $75k-100k, 9.2% for AGIs $100k-200k, 5.4% for AGIs over 200k)
Charity contributions: $4,368 (reported on 18.9% of returns)
Here:
$4,368
State:
$6,808
(% of AGI for various income ranges: 0.9% for AGIs $25k-50k, 1.1% for AGIs $50k-75k, 1.5% for AGIs $75k-100k, 1.6% for AGIs $100k-200k, 0.9% for AGIs over 200k)
Taxes paid: $5,975 (reported on 24.2% of returns)
77534:
$5,975
State:
$6,921
(% of AGI for various income ranges: 1.5% for AGIs $25k-50k, 2.1% for AGIs $50k-75k, 2.5% for AGIs $75k-100k, 2.8% for AGIs $100k-200k, 1.4% for AGIs over 200k)
Earned income credit: $2,578 (reported on 13.6% of returns)
Here:
$2,578
State:
$2,570
(% of AGI for various income ranges: 6.6% for AGIs below $25k, 1.3% for AGIs $25k-50k)
Percentage of individuals using paid preparers for their 2012 taxes: 53.0%
Here:
53%
State:
51%
(% for various income ranges: 48.8% for AGIs below $25k, 51.7% for AGIs $25k-50k, 55.0% for AGIs $50k-75k, 53.8% for AGIs $75k-100k, 58.3% for AGIs $100k-200k, 60.0% for AGIs over 200k)
Averages for the 2004 tax year for zip code 77534, filed in 2005:
Average Adjusted Gross Income (AGI) in 2004: $44,220 (Individual Income Tax Returns)
Here:
$44,220
State:
$47,881
Salary/wage: $43,310 (reported on 87.6% of returns)
Here:
$43,310
State:
$41,947
(% of AGI for various income ranges: 88.3% for AGIs below $10k, 81.6% for AGIs $10k-25k, 89.4% for AGIs $25k-50k, 86.8% for AGIs $50k-75k, 89.4% for AGIs $75k-100k, 81.3% for AGIs over 100k)
Taxable interest for individuals: $582 (reported on 51.4% of returns)
This zip code:
$582
Texas:
$2,255
(% of AGI for various income ranges: 2.1% for AGIs below $10k, 1.1% for AGIs $10k-25k, 0.5% for AGIs $25k-50k, 0.5% for AGIs $50k-75k, 0.4% for AGIs $75k-100k, 0.9% for AGIs over 100k)
Taxable dividends: $1,292 (reported on 13.7% of returns)
Here:
$1,292
State:
$4,261
(% of AGI for various income ranges: 1.7% for AGIs below $10k, 0.2% for AGIs $10k-25k, 0.2% for AGIs $25k-50k, 0.4% for AGIs $50k-75k, 0.3% for AGIs $75k-100k, 0.6% for AGIs over 100k)
Net capital gain/loss: +$7,822 (reported on 11.0% of returns)
Here:
+$7,822
State:
+$16,110
(% of AGI for various income ranges: -2.5% for AGIs below $10k, -0.3% for AGIs $10k-25k, 0.1% for AGIs $25k-50k, 0.3% for AGIs $50k-75k, 0.2% for AGIs $75k-100k, 6.8% for AGIs over 100k)
Profit/loss from business: +$1,721 (reported on 16.8% of returns)
Here:
+$1,721
State:
+$11,013
(% of AGI for various income ranges: 15.0% for AGIs below $10k, 3.5% for AGIs $10k-25k, -0.1% for AGIs $25k-50k, -0.4% for AGIs $50k-75k, 0.6% for AGIs $75k-100k, 0.1% for AGIs over 100k)
Total itemized deductions: $18,460 (22% of AGI, reported on 22.6% of returns)
Here:
$18,460
State:
$19,631
Here:
21.9% of AGI
State:
18.9% of AGI
(% of AGI for various income ranges: 6.1% for AGIs $10k-25k, 6.5% for AGIs $25k-50k, 10.9% for AGIs $50k-75k, 8.2% for AGIs $75k-100k, 13.0% for AGIs over 100k)
Charity contributions deductions: $3,929 (4% of AGI, reported on 17.9% of returns)
Here:
$3,929
State:
$4,753
Here:
4.3% of AGI
State:
4.2% of AGI
(% of AGI for various income ranges: 0.8% for AGIs $10k-25k, 1.1% for AGIs $25k-50k, 1.1% for AGIs $50k-75k, 1.7% for AGIs $75k-100k, 2.5% for AGIs over 100k)
Total tax: $5,841 (reported on 72.5% of returns)
77534:
$5,841
State:
$9,058
(% of AGI for various income ranges: 3.9% for AGIs below $10k, 3.4% for AGIs $10k-25k, 5.8% for AGIs $25k-50k, 8.0% for AGIs $50k-75k, 10.2% for AGIs $75k-100k, 15.3% for AGIs over 100k)
Earned income credit: $1,841 (reported on 17.6% of returns)
Here:
$1,841
State:
$2,024
Percentage of individuals using paid preparers for their 2004 taxes: 57.3%
Here:
57%
State:
57%
(% for various income ranges: 49.3% for AGIs below $10k, 59.3% for AGIs $10k-25k, 61.5% for AGIs $25k-50k, 54.4% for AGIs $50k-75k, 59.5% for AGIs $75k-100k, 60.2% for AGIs over 100k)
Household received Food Stamps/SNAP in the past 12 months: 25 Household did not receive Food Stamps/SNAP in the past 12 months: 949
Women who had a birth in the past 12 months: 45 (9 now married, 34 unmarried) Women who did not have a birth in the past 12 months: 835 (345 now married, 490 unmarried)
Housing units in zip code 77534 with a mortgage: 518 (8 second mortgage) Median monthly owner costs for units with a mortgage: $1,857 Median monthly owner costs for units without a mortgage: $713
Residents with income below the poverty level in 2022:
This zip code:
3.1%
Whole state:
14.0%
Residents with income below 50% of the poverty level in 2022:
This zip code:
2.2%
Whole state:
7.4%
Median number of rooms in houses and condos:
Here:
6.1
State:
6.3
Median number of rooms in apartments:
Here:
4.0
State:
4.0
Notable locations in this zip code not listed on our city pages
Lakes and reservoirs: Garrett Lakes (A), Peltier Lakes (B), McCullough Lake (C), Garrett Lake (D), Lazy C-Z Reservoir (E), Brown Lake (F), Reservoir Number 23 (G), Reservoir Number 18 (H). Display/hide their locations on the map
Size of family households: 278 2-persons, 166 3-persons, 159 4-persons, 150 5-persons, 26 6-persons, 31 7-or-more-persons
Size of nonfamily households: 156 1-person
767 married couples with children.
134 single-parent households (134 women).
90.4% of residents of 77534 zip code speak English at home.
8.8% of residents speak Spanish at home (64% very well, 22% well, 13% not well, 2% not at all).
0.3% of residents speak Asian or Pacific Island language at home (100% very well).
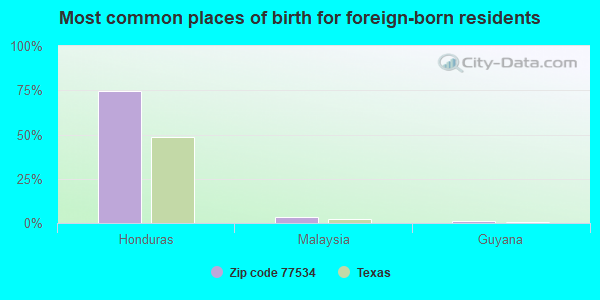
Foreign born population: 164 (5.0%) (83.1% of them are naturalized citizens)
This zip code:
5.0%
Whole state:
17.2%
75%Honduras
3%Malaysia
1%Guyana
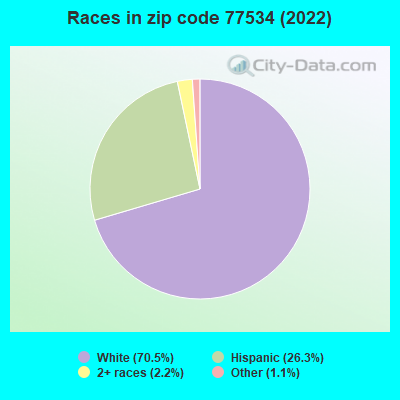
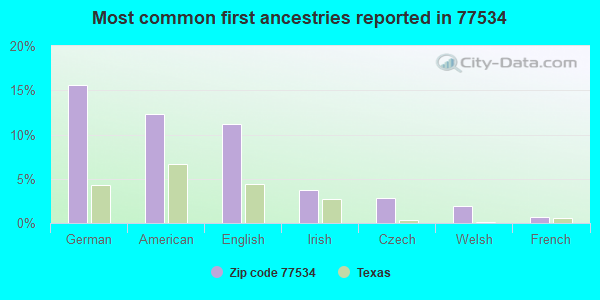
16%German
12%American
11%English
4%Irish
3%Czech
2%Welsh
1%French
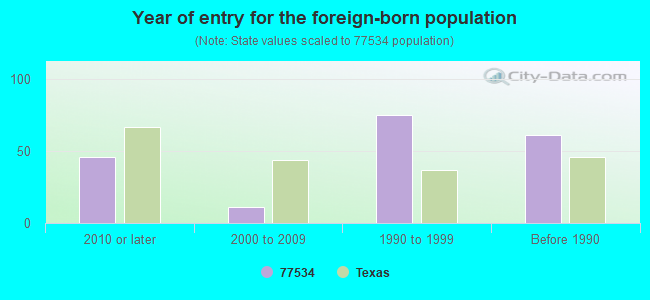
Year of entry for the foreign-born population
462010 or later
112000 to 2009
751990 to 1999
61Before 1990
Facilities with environmental interests located in this zip code:
AUTUMN SHADOWS WWTF (STHWY 35, 570FT EAST STHWY 35 in DANBURY, TX)
National Pollutant Discharge Elimination System NON-MAJOR (Tracking pollutant discharge elimination systems) - permit Business SIC classification: SEWERAGE SYSTEMS Organizations: 8 MILE PARK, L.P. (CONTACT/OWNER)
Alternative names: DTK EQUIPMENT INC., J.D.S. REALTY INC.
APACHE CORP. (APPROX .9 MI. FROM INTERSECTIO in DANBURY, TX)
AIR MAJOR (AIRS/AFS) CRITERIA AND HAZARDOUS AIR POLLUTANT INVENTORY (Inventory of air pollution sources) Business SIC classification: CRUDE PETROLEUM AND NATURAL GAS
Housing units lacking complete plumbing facilities: 4.6% Housing units lacking complete kitchen facilities: 2.3%
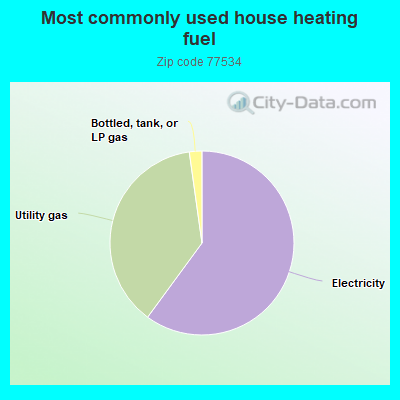
60.2%Electricity
37.8%Utility gas
2.2%Bottled, tank, or LP gas
Population in 1990: 2,522. Population change in the 1990s: +174 (+6.9%).
Place of birth for U.S.-born residents:
This state: 2,563
Northeast: 4
Midwest: 152
South: 244
West: 106
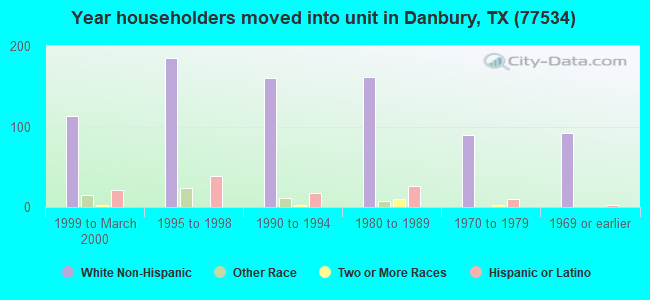
65% of the 77534 zip code residents lived in the same house 5 years ago. Out of people who lived in different houses, 78% lived in this county. Out of people who lived in different counties, 50% lived in Texas.
97% of the 77534 zip code residents lived in the same house 1 year ago. Out of people who lived in different houses, 100% moved from this county.
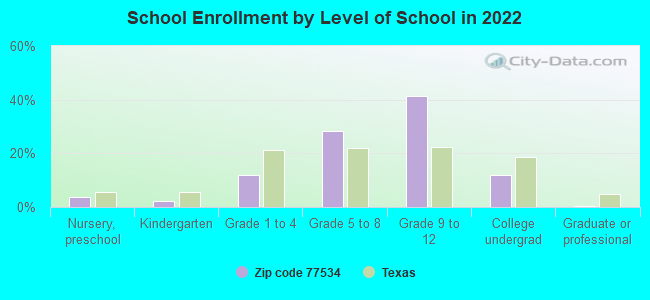
Private vs. public school enrollment:
Students in private schools in grades 1 to 8 (elementary and middle school): 11
Here:
2.5%
Texas:
8.8%
Students in private schools in grades 9 to 12 (high school): 3
Here:
0.7%
Texas:
8.0%
Students in private undergraduate colleges:
Here:
0.0%
Texas:
16.2%
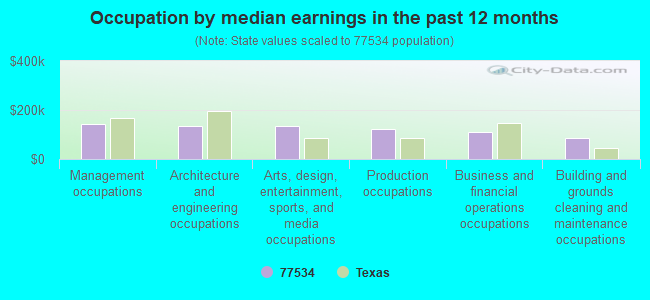
Occupation by median earnings in the past 12 months ($)
142,367Management occupations
135,208Architecture and engineering occupations
133,460Arts, design, entertainment, sports, and media occupations
123,928Production occupations
109,084Business and financial operations occupations
84,213Building and grounds cleaning and maintenance occupations
Top industries in this zip code by the number of employees in 2005:
Utilities: Electric Power Distribution (250-499 employees: 1 establishment, 20-49 employees: 1 establishment)
Health Care and Social Assistance: Offices of All Other Miscellaneous Health Practitioners (20-49: 1)
Other Services (except Public Administration): Religious Organizations (5-9: 2, 1-4: 1)
Health Care and Social Assistance: Child Day Care Services (10-19: 1)
Professional, Scientific, and Technical Services: Offices of Lawyers (10-19: 1)
Administrative and Support and Waste Management and Remediation Services: Security Guards and Patrol Services (10-19: 1)
Fatal accident statistics in 2010:
Fatal accident count: 1
Vehicles involved in fatal accidents: 2
Fatal accidents caused by drunken drivers: 1
Fatalities: 1
Persons involved in fatal accidents: 3
Pedestrians involved in fatal accidents: 0
Home Mortgage Disclosure Act Aggregated Statistics For Year 2009 (Based on 6 partial tracts)
A) FHA, FSA/RHS & VA Home Purchase Loans
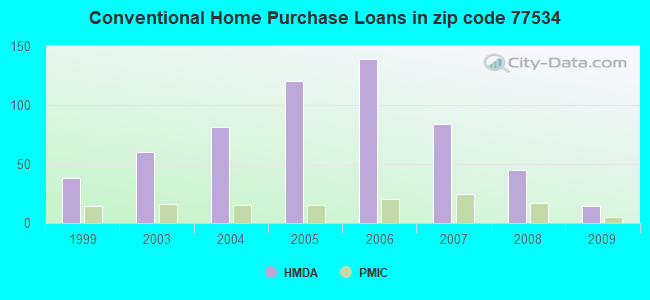
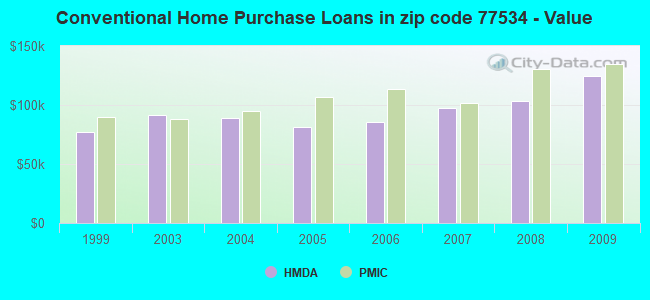
B) Conventional Home Purchase Loans
C) Refinancings
D) Home Improvement Loans
F) Non-occupant Loans on < 5 Family Dwellings (A B C & D)
G) Loans On Manufactured Home Dwelling (A B C & D)
Number
Average Value
Number
Average Value
Number
Average Value
Number
Average Value
Number
Average Value
Number
Average Value
LOANS ORIGINATED
41
$111,859
14
$124,757
45
$101,347
1
$13,040
1
$120,130
2
$87,000
APPLICATIONS APPROVED, NOT ACCEPTED
3
$115,833
1
$28,440
6
$114,570
1
$13,840
0
$0
2
$42,660
APPLICATIONS DENIED
7
$129,626
8
$141,841
16
$127,966
13
$36,873
2
$16,865
2
$64,980
APPLICATIONS WITHDRAWN
3
$98,607
26
$104,039
32
$131,265
4
$38,325
2
$45,620
2
$82,690
FILES CLOSED FOR INCOMPLETENESS
1
$117,540
0
$0
6
$86,305
0
$0
0
$0
1
$71,900
Aggregated Statistics For Year 2008 (Based on 6 partial tracts)
A) FHA, FSA/RHS & VA Home Purchase Loans
B) Conventional Home Purchase Loans
C) Refinancings
D) Home Improvement Loans
F) Non-occupant Loans on < 5 Family Dwellings (A B C & D)
G) Loans On Manufactured Home Dwelling (A B C & D)
Number
Average Value
Number
Average Value
Number
Average Value
Number
Average Value
Number
Average Value
Number
Average Value
LOANS ORIGINATED
33
$111,492
45
$103,687
36
$102,722
9
$113,529
9
$150,494
1
$59,000
APPLICATIONS APPROVED, NOT ACCEPTED
2
$124,495
4
$58,135
8
$108,341
4
$38,938
2
$40,970
2
$38,220
APPLICATIONS DENIED
6
$108,055
26
$104,116
33
$118,700
20
$32,060
4
$63,798
7
$40,086
APPLICATIONS WITHDRAWN
2
$143,360
26
$134,614
16
$103,856
4
$12,945
2
$64,515
0
$0
FILES CLOSED FOR INCOMPLETENESS
1
$108,650
1
$146,860
5
$125,390
1
$62,470
1
$123,780
0
$0
Aggregated Statistics For Year 2007 (Based on 6 partial tracts)
A) FHA, FSA/RHS & VA Home Purchase Loans
B) Conventional Home Purchase Loans
C) Refinancings
D) Home Improvement Loans
F) Non-occupant Loans on < 5 Family Dwellings (A B C & D)
G) Loans On Manufactured Home Dwelling (A B C & D)
Number
Average Value
Number
Average Value
Number
Average Value
Number
Average Value
Number
Average Value
Number
Average Value
LOANS ORIGINATED
22
$112,079
84
$97,190
77
$106,813
15
$48,337
17
$76,088
7
$60,666
APPLICATIONS APPROVED, NOT ACCEPTED
0
$0
5
$119,050
8
$110,510
3
$49,903
1
$143,160
1
$30,170
APPLICATIONS DENIED
2
$127,725
31
$91,521
72
$115,605
23
$33,192
6
$57,525
6
$45,225
APPLICATIONS WITHDRAWN
1
$184,390
32
$99,617
37
$116,095
4
$64,457
3
$95,573
0
$0
FILES CLOSED FOR INCOMPLETENESS
0
$0
1
$116,110
7
$131,979
0
$0
0
$0
0
$0
Aggregated Statistics For Year 2006 (Based on 6 partial tracts)
A) FHA, FSA/RHS & VA Home Purchase Loans
B) Conventional Home Purchase Loans
C) Refinancings
D) Home Improvement Loans
F) Non-occupant Loans on < 5 Family Dwellings (A B C & D)
G) Loans On Manufactured Home Dwelling (A B C & D)
Number
Average Value
Number
Average Value
Number
Average Value
Number
Average Value
Number
Average Value
Number
Average Value
LOANS ORIGINATED
23
$106,517
139
$85,182
80
$93,830
16
$43,579
14
$54,122
10
$58,213
APPLICATIONS APPROVED, NOT ACCEPTED
1
$164,760
18
$53,337
9
$94,369
2
$9,270
1
$44,570
5
$40,074
APPLICATIONS DENIED
2
$52,925
64
$85,638
77
$80,822
28
$37,571
12
$50,180
8
$51,451
APPLICATIONS WITHDRAWN
4
$69,168
30
$88,755
56
$88,238
5
$60,426
4
$58,888
1
$38,690
FILES CLOSED FOR INCOMPLETENESS
0
$0
8
$127,876
14
$106,166
1
$94,050
1
$69,020
0
$0
Aggregated Statistics For Year 2005 (Based on 6 partial tracts)
A) FHA, FSA/RHS & VA Home Purchase Loans
B) Conventional Home Purchase Loans
C) Refinancings
D) Home Improvement Loans
F) Non-occupant Loans on < 5 Family Dwellings (A B C & D)
G) Loans On Manufactured Home Dwelling (A B C & D)
Number
Average Value
Number
Average Value
Number
Average Value
Number
Average Value
Number
Average Value
Number
Average Value
LOANS ORIGINATED
11
$95,492
120
$80,953
80
$96,483
17
$57,931
15
$78,073
4
$67,430
APPLICATIONS APPROVED, NOT ACCEPTED
1
$45,770
21
$87,571
17
$90,648
3
$35,023
3
$89,947
3
$59,120
APPLICATIONS DENIED
1
$47,940
63
$78,711
79
$96,100
27
$32,802
9
$63,238
9
$58,914
APPLICATIONS WITHDRAWN
2
$119,095
15
$134,102
48
$131,343
8
$175,776
4
$156,148
2
$68,775
FILES CLOSED FOR INCOMPLETENESS
1
$100,790
5
$125,924
26
$105,635
1
$88,420
1
$45,590
0
$0
Aggregated Statistics For Year 2004 (Based on 6 partial tracts)
A) FHA, FSA/RHS & VA Home Purchase Loans
B) Conventional Home Purchase Loans
C) Refinancings
D) Home Improvement Loans
E) Loans on Dwellings For 5+ Families
F) Non-occupant Loans on < 5 Family Dwellings (A B C & D)
G) Loans On Manufactured Home Dwelling (A B C & D)
Number
Average Value
Number
Average Value
Number
Average Value
Number
Average Value
Number
Average Value
Number
Average Value
Number
Average Value
LOANS ORIGINATED
19
$102,640
81
$88,626
121
$84,812
14
$41,770
1
$358,870
17
$69,086
8
$78,216
APPLICATIONS APPROVED, NOT ACCEPTED
2
$77,805
13
$70,174
22
$90,412
5
$32,346
0
$0
1
$76,840
2
$41,055
APPLICATIONS DENIED
2
$70,980
27
$88,640
107
$76,396
20
$33,384
0
$0
8
$68,240
9
$80,907
APPLICATIONS WITHDRAWN
6
$96,740
12
$95,245
70
$85,694
8
$70,050
0
$0
3
$66,167
3
$131,610
FILES CLOSED FOR INCOMPLETENESS
0
$0
2
$65,130
30
$104,176
1
$28,980
0
$0
2
$74,185
0
$0
Aggregated Statistics For Year 2003 (Based on 6 partial tracts)
A) FHA, FSA/RHS & VA Home Purchase Loans
B) Conventional Home Purchase Loans
C) Refinancings
D) Home Improvement Loans
F) Non-occupant Loans on < 5 Family Dwellings (A B C & D)
Number
Average Value
Number
Average Value
Number
Average Value
Number
Average Value
Number
Average Value
LOANS ORIGINATED
25
$89,449
60
$91,591
186
$80,850
16
$27,580
20
$67,904
APPLICATIONS APPROVED, NOT ACCEPTED
0
$0
4
$73,252
12
$75,362
3
$19,967
1
$42,130
APPLICATIONS DENIED
4
$93,298
20
$85,284
101
$77,551
8
$28,328
3
$53,357
APPLICATIONS WITHDRAWN
2
$98,920
9
$78,212
67
$76,089
0
$0
3
$106,100
FILES CLOSED FOR INCOMPLETENESS
1
$81,140
4
$67,440
8
$81,754
1
$50,300
0
$0
Aggregated Statistics For Year 1999 (Based on 3 partial tracts)
A) FHA, FSA/RHS & VA Home Purchase Loans
B) Conventional Home Purchase Loans
C) Refinancings
D) Home Improvement Loans
E) Loans on Dwellings For 5+ Families
F) Non-occupant Loans on < 5 Family Dwellings (A B C & D)
2007 - 2018 National Fire Incident Reporting System (NFIRS) incidents
Based on the data from the years 2007 - 2018 the average number of fires per year is 21. The highest number of fires - 52 took place in 2011, and the least - 6 in 2007. The data has a rising trend.
When looking into fire subcategories, the most reports belonged to: Outside Fires (59.9%), and Structure Fires (20.6%).
Fire incident types reported to NFIRS in Zip Code 77534


 Nearest zip codes: 77577, 77515, 77511, 77531, 77541, 77583.


 Based on the data from the years 2007 - 2018 the average number of fires per year is 21. The highest number of fires - 52 took place in 2011, and the least - 6 in 2007. The data has a rising trend.
 When looking into fire subcategories, the most reports belonged to: Outside Fires (59.9%), and Structure Fires (20.6%).