Estimated zip code population in 2022: 26,686 Zip code population in 2010: 19,431 Zip code population in 2000: 6,721
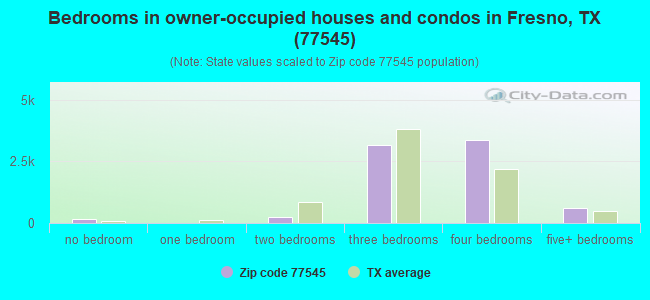
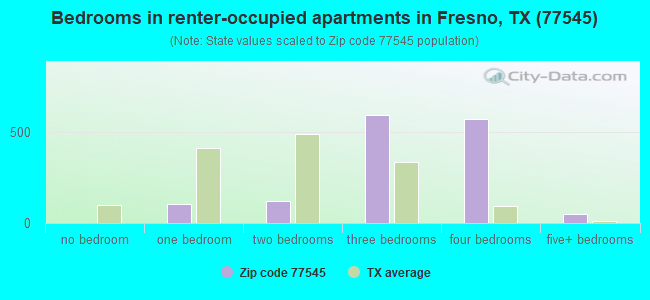
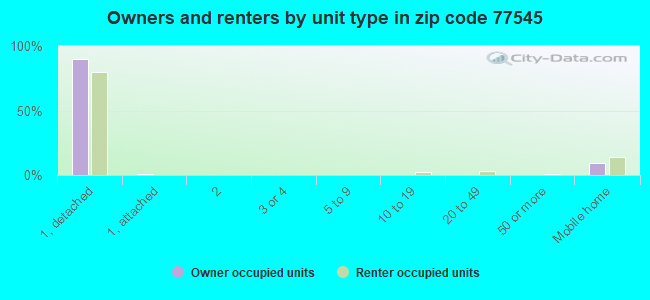
Houses and condos: 9,271 Renter-occupied apartments: 1,440
% of renters here:
16%
State:
38%
March 2022 cost of living index in zip code 77545: 98.1 (near average, U.S. average is 100)
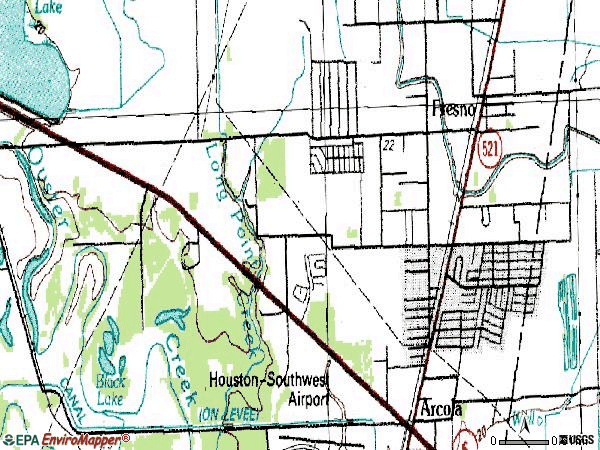
Land area: 12.2 sq. mi. Water area: 0.2 sq. mi.
Population density: 2,189 people per square mile
(low).
OSM Map
General Map
Google Map
MSN Map
OSM Map
General Map
Google Map
MSN Map
OSM Map
General Map
Google Map
MSN Map
OSM Map
General Map
Google Map
MSN Map
Please wait while loading the map...
Real estate property taxes paid for housing units in 2022:
This zip code:
1.8% ($4,896)
Texas:
1.5% ($4,050)
Median real estate property taxes paid for housing units with mortgages in 2022: $5,508 (1.9%) Median real estate property taxes paid for housing units with no mortgage in 2022: $3,200 (1.4%)
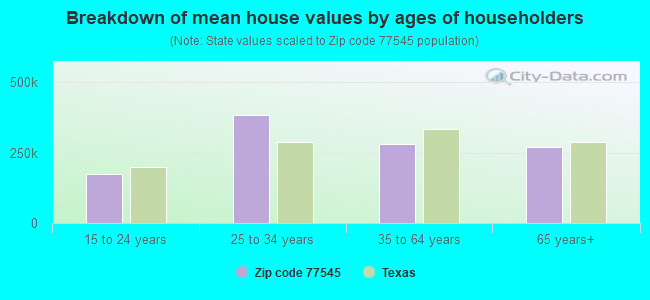
Estimated median house/condo value in 2022: $274,011
77545:
$274,011
Texas:
$275,400
According to our research of Texas and other state lists, there were 48 registered sex offenders living in 77545 zip code as of May 23, 2024. The ratio of all residents to sex offenders in zip code 77545 is 487 to 1. The ratio of registered sex offenders to all residents in this zip code is near the state average.
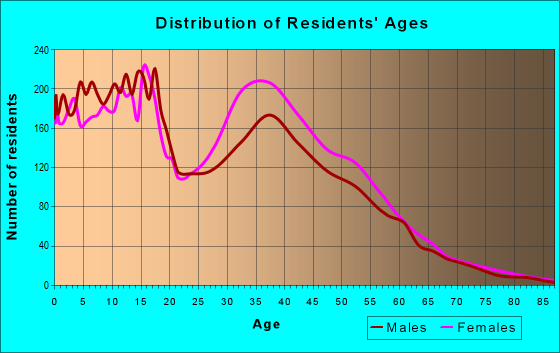
Median resident age:
This zip code:
37.5 years
Texas median age:
35.6 years
Average household size:
This zip code:
3.0 people
Texas:
2.6 people
Averages for the 2020 tax year for zip code 77545, filed in 2021:
Average Adjusted Gross Income (AGI) in 2020: $47,493 (Individual Income Tax Returns)
Here:
$47,493
State:
$77,054
Salary/wage: $48,044 (reported on 85.2% of returns)
Here:
$48,044
State:
$62,766
(% of AGI for various income ranges: 1335.1% for AGIs below $25k, 3903.5% for AGIs $25k-50k, 7074.8% for AGIs $50k-75k, 10146.4% for AGIs $75k-100k, 18352.4% for AGIs $100k-200k, 56174.0% for AGIs over 200k)
Taxable interest for individuals: $682 (reported on 9.2% of returns)
This zip code:
$682
Texas:
$2,665
(% of AGI for various income ranges: 1.8% for AGIs below $25k, 1.9% for AGIs $25k-50k, 4.7% for AGIs $50k-75k, 7.8% for AGIs $75k-100k, 28.6% for AGIs $100k-200k, 648.0% for AGIs over 200k)
Ordinary dividends: $1,843 (reported on 4.6% of returns)
Here:
$1,843
State:
$10,044
(% of AGI for various income ranges: 1.9% for AGIs below $25k, 5.4% for AGIs $25k-50k, 7.8% for AGIs $50k-75k, 3.9% for AGIs $75k-100k, 33.1% for AGIs $100k-200k, 892.0% for AGIs over 200k)
Net capital gain/loss in AGI: +$6,583 (reported on 4.7% of returns)
Here:
+$6,583
State:
+$39,590
(% of AGI for various income ranges: 1.1% for AGIs below $25k, 2.9% for AGIs $25k-50k, 15.4% for AGIs $50k-75k, 46.1% for AGIs $75k-100k, 88.3% for AGIs $100k-200k, 5016.0% for AGIs over 200k)
Taxable individual retirement arrangement distribution: $17,445 (reported on 3.2% of returns)
77545:
$17,445
Texas:
$24,740
(% of AGI for various income ranges: 10.9% for AGIs below $25k, 28.7% for AGIs $25k-50k, 77.8% for AGIs $50k-75k, 110.8% for AGIs $75k-100k, 501.0% for AGIs $100k-200k)
Total itemized deductions: $29,060 (reported on 11.8% of returns)
Here:
$29,060
State:
$40,428
(% of AGI for various income ranges: 39.3% for AGIs below $25k, 269.7% for AGIs $25k-50k, 720.3% for AGIs $50k-75k, 996.6% for AGIs $75k-100k, 1572.9% for AGIs $100k-200k, 6380.0% for AGIs over 200k)
Charity contributions: $10,329 (reported on 10.0% of returns)
Here:
$10,329
State:
$18,201
(% of AGI for various income ranges: 6.3% for AGIs below $25k, 64.9% for AGIs $25k-50k, 182.2% for AGIs $50k-75k, 287.0% for AGIs $75k-100k, 609.2% for AGIs $100k-200k, 2812.0% for AGIs over 200k)
Taxes paid: $7,170 (reported on 11.3% of returns)
77545:
$7,170
State:
$7,821
(% of AGI for various income ranges: 8.9% for AGIs below $25k, 63.2% for AGIs $25k-50k, 172.1% for AGIs $50k-75k, 260.1% for AGIs $75k-100k, 353.9% for AGIs $100k-200k, 1412.0% for AGIs over 200k)
Earned income credit: $2,630 (reported on 25.0% of returns)
Here:
$2,630
State:
$2,584
(% of AGI for various income ranges: 145.9% for AGIs below $25k, 95.6% for AGIs $25k-50k, 1.3% for AGIs $50k-75k)
Percentage of individuals using paid preparers for their 2020 taxes: 91.2%
Here:
91%
State:
92%
(% for various income ranges: 89.9% for AGIs below $25k, 92.6% for AGIs $25k-50k, 91.6% for AGIs $50k-75k, 91.6% for AGIs $75k-100k, 90.5% for AGIs $100k-200k, 92.9% for AGIs over 200k)
Averages for the 2012 tax year for zip code 77545, filed in 2013:
Average Adjusted Gross Income (AGI) in 2012: $45,474 (Individual Income Tax Returns)
Here:
$45,474
State:
$65,384
Salary/wage: $45,333 (reported on 90.0% of returns)
Here:
$45,333
State:
$52,524
(% of AGI for various income ranges: 82.9% for AGIs below $25k, 93.7% for AGIs $25k-50k, 93.3% for AGIs $50k-75k, 91.6% for AGIs $75k-100k, 90.0% for AGIs $100k-200k, 72.2% for AGIs over 200k)
Taxable interest for individuals: $556 (reported on 11.0% of returns)
This zip code:
$556
Texas:
$2,372
(% of AGI for various income ranges: 0.2% for AGIs below $25k, 0.3% for AGIs $75k-100k, 0.4% for AGIs over 200k)
Ordinary dividends: $3,044 (reported on 4.3% of returns)
Here:
$3,044
State:
$9,721
(% of AGI for various income ranges: 0.3% for AGIs below $25k, 0.3% for AGIs $25k-50k, 0.4% for AGIs $75k-100k, 0.2% for AGIs $100k-200k, 0.8% for AGIs over 200k)
Net capital gain/loss in AGI: +$5,607 (reported on 3.0% of returns)
Here:
+$5,607
State:
+$35,319
(% of AGI for various income ranges: 0.2% for AGIs $100k-200k, 4.5% for AGIs over 200k)
Profit/loss from business: +$4,151 (reported on 25.1% of returns)
Here:
+$4,151
State:
+$13,732
(% of AGI for various income ranges: 12.1% for AGIs below $25k, 1.0% for AGIs $25k-50k, 0.4% for AGIs $75k-100k, 1.5% for AGIs $100k-200k, 4.5% for AGIs over 200k)
Taxable individual retirement arrangement distribution: $12,547 (reported on 3.4% of returns)
77545:
$12,547
Texas:
$19,511
(% of AGI for various income ranges: 0.6% for AGIs below $25k, 0.5% for AGIs $25k-50k, 0.7% for AGIs $50k-75k, 1.0% for AGIs $75k-100k, 2.0% for AGIs $100k-200k)
Total itemized deductions: $20,323 (27% of AGI, reported on 35.9% of returns)
Here:
$20,323
State:
$24,724
Here:
27.3% of AGI
State:
15.9% of AGI
(% of AGI for various income ranges: 9.1% for AGIs below $25k, 15.7% for AGIs $25k-50k, 19.5% for AGIs $50k-75k, 17.3% for AGIs $75k-100k, 15.5% for AGIs $100k-200k, 16.8% for AGIs over 200k)
Charity contributions: $5,310 (reported on 29.9% of returns)
Here:
$5,310
State:
$6,808
(% of AGI for various income ranges: 1.3% for AGIs below $25k, 2.6% for AGIs $25k-50k, 3.9% for AGIs $50k-75k, 3.6% for AGIs $75k-100k, 4.1% for AGIs $100k-200k, 6.3% for AGIs over 200k)
Taxes paid: $4,985 (reported on 34.7% of returns)
77545:
$4,985
State:
$6,921
(% of AGI for various income ranges: 1.9% for AGIs below $25k, 3.6% for AGIs $25k-50k, 4.6% for AGIs $50k-75k, 4.2% for AGIs $75k-100k, 3.9% for AGIs $100k-200k, 4.1% for AGIs over 200k)
Earned income credit: $2,612 (reported on 27.2% of returns)
Here:
$2,612
State:
$2,570
(% of AGI for various income ranges: 10.6% for AGIs below $25k, 1.7% for AGIs $25k-50k)
Percentage of individuals using paid preparers for their 2012 taxes: 53.9%
Here:
54%
State:
51%
(% for various income ranges: 54.1% for AGIs below $25k, 54.6% for AGIs $25k-50k, 52.1% for AGIs $50k-75k, 51.2% for AGIs $75k-100k, 54.8% for AGIs $100k-200k, 75.0% for AGIs over 200k)
Averages for the 2004 tax year for zip code 77545, filed in 2005:
Average Adjusted Gross Income (AGI) in 2004: $39,169 (Individual Income Tax Returns)
Here:
$39,169
State:
$47,881
Salary/wage: $39,610 (reported on 90.1% of returns)
Here:
$39,610
State:
$41,947
(% of AGI for various income ranges: 89.0% for AGIs below $10k, 86.5% for AGIs $10k-25k, 95.0% for AGIs $25k-50k, 95.2% for AGIs $50k-75k, 93.5% for AGIs $75k-100k, 82.6% for AGIs over 100k)
Taxable interest for individuals: $562 (reported on 17.5% of returns)
This zip code:
$562
Texas:
$2,255
(% of AGI for various income ranges: 1.3% for AGIs below $10k, 0.3% for AGIs $10k-25k, 0.1% for AGIs $25k-50k, 0.2% for AGIs $50k-75k, 0.2% for AGIs $75k-100k, 0.5% for AGIs over 100k)
Taxable dividends: $889 (reported on 5.9% of returns)
Here:
$889
State:
$4,261
(% of AGI for various income ranges: 0.5% for AGIs below $10k, 0.1% for AGIs $10k-25k, 0.0% for AGIs $25k-50k, 0.1% for AGIs $50k-75k, 0.1% for AGIs $75k-100k, 0.4% for AGIs over 100k)
Net capital gain/loss: +$1,461 (reported on 4.2% of returns)
Here:
+$1,461
State:
+$16,110
(% of AGI for various income ranges: -0.5% for AGIs below $10k, -0.0% for AGIs $10k-25k, -0.1% for AGIs $25k-50k, -0.0% for AGIs $50k-75k, 0.1% for AGIs $75k-100k, 0.9% for AGIs over 100k)
Profit/loss from business: +$3,166 (reported on 21.6% of returns)
Here:
+$3,166
State:
+$11,013
(% of AGI for various income ranges: 6.5% for AGIs below $10k, 8.6% for AGIs $10k-25k, 1.4% for AGIs $25k-50k, -1.0% for AGIs $50k-75k, 0.0% for AGIs $75k-100k, 2.0% for AGIs over 100k)
IRA payment deduction: $2,750 (reported on 0.8% of returns)
77545:
$2,750
Texas:
$3,120
Total itemized deductions: $20,469 (31% of AGI, reported on 35.7% of returns)
Here:
$20,469
State:
$19,631
Here:
31.0% of AGI
State:
18.9% of AGI
(% of AGI for various income ranges: 8.9% for AGIs below $10k, 9.3% for AGIs $10k-25k, 17.6% for AGIs $25k-50k, 22.2% for AGIs $50k-75k, 24.5% for AGIs $75k-100k, 18.5% for AGIs over 100k)
Charity contributions deductions: $4,912 (7% of AGI, reported on 30.8% of returns)
Here:
$4,912
State:
$4,753
Here:
7.2% of AGI
State:
4.2% of AGI
(% of AGI for various income ranges: 0.6% for AGIs below $10k, 1.2% for AGIs $10k-25k, 3.1% for AGIs $25k-50k, 4.0% for AGIs $50k-75k, 4.2% for AGIs $75k-100k, 6.3% for AGIs over 100k)
Total tax: $4,836 (reported on 67.2% of returns)
77545:
$4,836
State:
$9,058
(% of AGI for various income ranges: 4.6% for AGIs below $10k, 3.6% for AGIs $10k-25k, 4.7% for AGIs $25k-50k, 7.1% for AGIs $50k-75k, 9.4% for AGIs $75k-100k, 16.7% for AGIs over 100k)
Earned income credit: $2,009 (reported on 27.5% of returns)
Here:
$2,009
State:
$2,024
Percentage of individuals using paid preparers for their 2004 taxes: 62.5%
Here:
62%
State:
57%
(% for various income ranges: 56.9% for AGIs below $10k, 68.3% for AGIs $10k-25k, 63.8% for AGIs $25k-50k, 58.9% for AGIs $50k-75k, 56.7% for AGIs $75k-100k, 60.2% for AGIs over 100k)
Likely homosexual households (counted as self-reported same-sex unmarried-partner households)
Lesbian couples: 0.1% of all households
Gay men: 0.4% of all households
Household received Food Stamps/SNAP in the past 12 months: 719 Household did not receive Food Stamps/SNAP in the past 12 months: 8,202
Women who had a birth in the past 12 months: 220 (224 now married, 0 unmarried) Women who did not have a birth in the past 12 months: 7,320 (2,979 now married, 4,348 unmarried)
Housing units in zip code 77545 with a mortgage: 5,766 (134 second mortgage, 34 both second mortgage and home equity loan) Median monthly owner costs for units with a mortgage: $2,070 Median monthly owner costs for units without a mortgage: $629
Residents with income below the poverty level in 2022:
This zip code:
5.2%
Whole state:
14.0%
Residents with income below 50% of the poverty level in 2022:
This zip code:
4.2%
Whole state:
7.4%
Median number of rooms in houses and condos:
Here:
6.7
State:
6.3
Median number of rooms in apartments:
Here:
5.3
State:
4.0
Notable locations in this zip code not listed on our city pages
In group quarters: 34 (-1 institutionalized population)
Size of family households: 2,681 2-persons, 1,636 3-persons, 1,182 4-persons, 1,267 5-persons, 203 6-persons, 168 7-or-more-persons
Size of nonfamily households: 1,470 1-person, 146 2-persons, 125 4-persons
3,445 married couples with children.
1,561 single-parent households (485 men, 1,076 women).
67.4% of residents of 77545 zip code speak English at home.
28.7% of residents speak Spanish at home (57% very well, 21% well, 19% not well, 3% not at all).
0.4% of residents speak other Indo-European language at home (69% very well, 23% well, 8% not well).
1.0% of residents speak Asian or Pacific Island language at home (21% very well, 69% well, 8% not well, 3% not at all).
1.6% of residents speak other language at home (87% very well, 9% well, 4% not well).
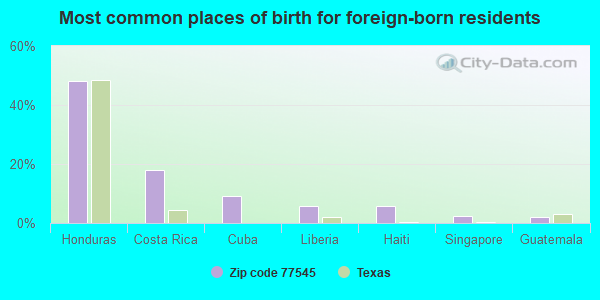
Foreign born population: 4,714 (17.7%) (46.4% of them are naturalized citizens)
This zip code:
17.7%
Whole state:
17.2%
48%Honduras
18%Costa Rica
9%Cuba
6%Liberia
6%Haiti
2%Singapore
2%Guatemala
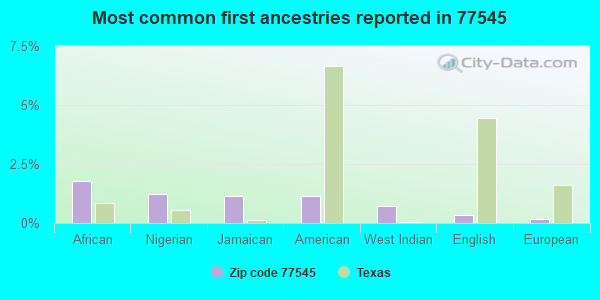
2%African
1%Nigerian
1%Jamaican
1%American
1%West Indian
0%English
0%European
Year of entry for the foreign-born population
6722010 or later
1,0312000 to 2009
1,4481990 to 1999
1,462Before 1990
Facilities with environmental interests located in this zip code:
AXXIOM MANUFACTURING INC (11927 S HIGHWAY 6 in FRESNO, TX)
(Resource Conservation and Recovery Act (tracking hazardous waste)) Organizations: SCHMIDT MANUFACTURING INC (CONTACT/OWNER)
Alternative names: US FILTER SCHMIDT
Housing units lacking complete plumbing facilities: 1.1% Housing units lacking complete kitchen facilities: 1.7%
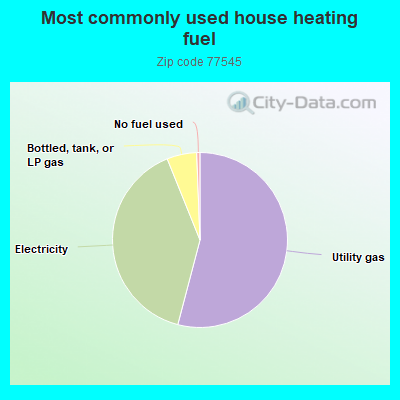
54.1%Utility gas
39.8%Electricity
5.5%Bottled, tank, or LP gas
0.6%No fuel used
Population in 1990: 3,144. Population change in the 1990s: +3,577 (+113.8%).
Place of birth for U.S.-born residents:
This state: 15,405
Northeast: 365
Midwest: 747
South: 4,616
West: 664
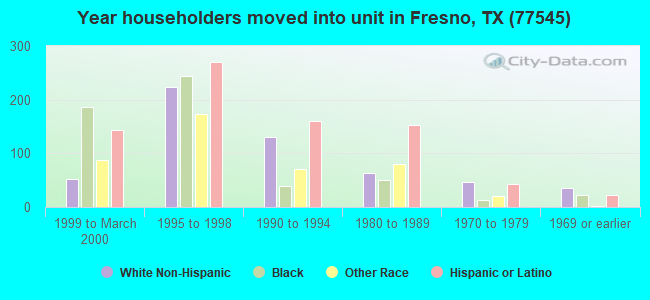
53% of the 77545 zip code residents lived in the same house 5 years ago. Out of people who lived in different houses, 29% lived in this county. Out of people who lived in different counties, 50% lived in Texas.
94% of the 77545 zip code residents lived in the same house 1 year ago. Out of people who lived in different houses, 27% moved from this county. Out of people who lived in different houses, 76% moved from different county within same state. Out of people who lived in different houses, 2% moved from different state.
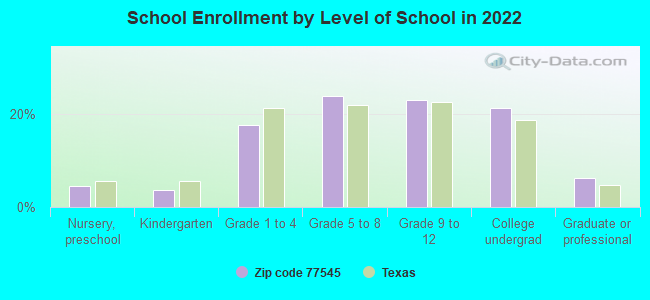
Private vs. public school enrollment:
Students in private schools in grades 1 to 8 (elementary and middle school): 83
Here:
3.0%
Texas:
8.8%
Students in private schools in grades 9 to 12 (high school):
Here:
0.0%
Texas:
8.0%
Students in private undergraduate colleges: 234
Here:
16.5%
Texas:
16.2%
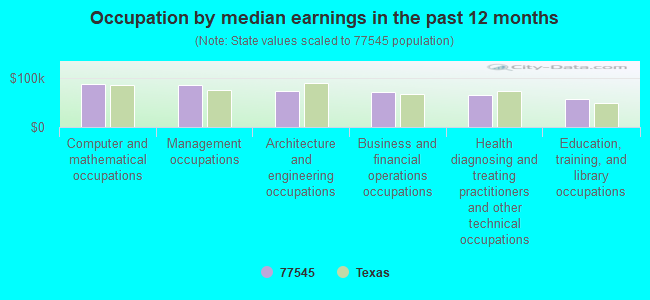
Occupation by median earnings in the past 12 months ($)
88,476Computer and mathematical occupations
84,666Management occupations
73,750Architecture and engineering occupations
71,932Business and financial operations occupations
65,198Health diagnosing and treating practitioners and other technical occupations
57,545Education, training, and library occupations
Companies with federal contracts located in this zip code:
COYLE GROUP, INC (4517 KANSAS ST in FRESNO, TX; small business)
$28,179 with U.S. Army Corps of Engineers - civil program financing only for Landscaping/Groundskeeping Services. Signed on 2003-05-30. Completion date: 2003-06-30.
Top industries in this zip code by the number of employees in 2005:
Health Care and Social Assistance: Child Day Care Services (20-49 employees: 1 establishment, 5-9 employees: 1 establishment, 1-4 employees: 1 establishment)
Administrative and Support and Waste Management and Remediation Services: Solid Waste Landfill (20-49: 1, 5-9: 1)
Accommodation and Food Services: Limited-Service Restaurants (20-49: 1, 1-4: 2)
Construction: Plumbing, Heating, and Air-Conditioning Contractors (20-49: 1, 1-4: 1)
Mining: Support Activities for Oil and Gas Operations (20-49: 1)
Health Care and Social Assistance: Homes for the Elderly (20-49: 1)
Construction: Commercial and Institutional Building Construction (20-49: 1)
People in group quarters in 2010:
9 people in group homes intended for adults
People in group quarters in 2000:
16 people in other noninstitutional group quarters
Fatal accident statistics in 2014:
Fatal accident count: 1
Vehicles involved in fatal accidents: 1
Fatal accidents caused by drunken drivers: 0
Fatalities: 1
Persons involved in fatal accidents: 1
Pedestrians involved in fatal accidents: 1
Fatal accident statistics in 2013:
Fatal accident count: 2
Vehicles involved in fatal accidents: 3
Fatal accidents caused by drunken drivers: 2
Fatalities: 2
Persons involved in fatal accidents: 3
Pedestrians involved in fatal accidents: 0
Home Mortgage Disclosure Act Aggregated Statistics For Year 2009 (Based on 4 partial tracts)
A) FHA, FSA/RHS & VA Home Purchase Loans
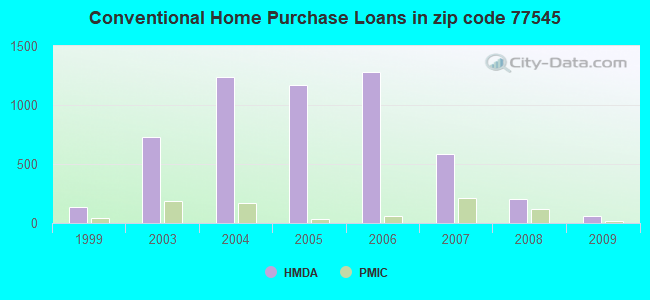
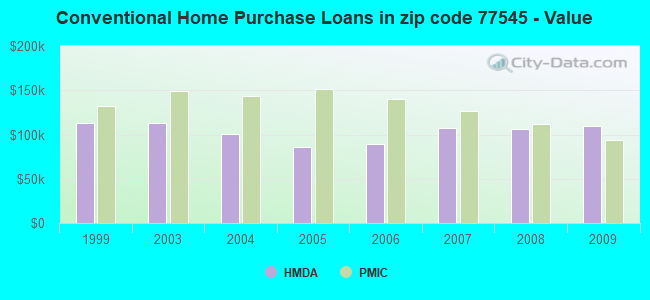
B) Conventional Home Purchase Loans
C) Refinancings
D) Home Improvement Loans
F) Non-occupant Loans on < 5 Family Dwellings (A B C & D)
G) Loans On Manufactured Home Dwelling (A B C & D)
Number
Average Value
Number
Average Value
Number
Average Value
Number
Average Value
Number
Average Value
Number
Average Value
LOANS ORIGINATED
220
$133,445
57
$109,257
117
$128,178
2
$12,060
31
$74,595
0
$0
APPLICATIONS APPROVED, NOT ACCEPTED
12
$114,654
7
$110,253
29
$110,853
2
$4,555
5
$66,104
0
$0
APPLICATIONS DENIED
87
$131,413
35
$84,391
113
$130,527
26
$38,562
17
$74,401
3
$93,140
APPLICATIONS WITHDRAWN
48
$129,394
4
$183,765
59
$121,866
5
$27,334
3
$87,890
2
$41,760
FILES CLOSED FOR INCOMPLETENESS
9
$124,188
6
$82,005
17
$132,546
2
$6,600
0
$0
2
$37,965
Aggregated Statistics For Year 2008 (Based on 4 partial tracts)
A) FHA, FSA/RHS & VA Home Purchase Loans
B) Conventional Home Purchase Loans
C) Refinancings
D) Home Improvement Loans
F) Non-occupant Loans on < 5 Family Dwellings (A B C & D)
G) Loans On Manufactured Home Dwelling (A B C & D)
Number
Average Value
Number
Average Value
Number
Average Value
Number
Average Value
Number
Average Value
Number
Average Value
LOANS ORIGINATED
216
$126,960
201
$105,789
90
$125,489
8
$29,028
80
$81,558
0
$0
APPLICATIONS APPROVED, NOT ACCEPTED
9
$157,260
44
$118,932
18
$102,144
3
$19,460
10
$87,919
7
$53,634
APPLICATIONS DENIED
78
$128,367
102
$111,802
281
$134,133
80
$26,612
35
$80,224
14
$56,514
APPLICATIONS WITHDRAWN
70
$139,314
34
$120,990
61
$117,345
3
$40,497
6
$68,148
2
$51,630
FILES CLOSED FOR INCOMPLETENESS
18
$123,133
34
$129,305
30
$135,635
8
$75,401
5
$97,744
0
$0
Aggregated Statistics For Year 2007 (Based on 4 partial tracts)
A) FHA, FSA/RHS & VA Home Purchase Loans
B) Conventional Home Purchase Loans
C) Refinancings
D) Home Improvement Loans
F) Non-occupant Loans on < 5 Family Dwellings (A B C & D)
G) Loans On Manufactured Home Dwelling (A B C & D)
Number
Average Value
Number
Average Value
Number
Average Value
Number
Average Value
Number
Average Value
Number
Average Value
LOANS ORIGINATED
167
$137,183
584
$107,896
151
$110,907
25
$52,731
102
$83,270
5
$81,094
APPLICATIONS APPROVED, NOT ACCEPTED
8
$110,479
110
$108,756
52
$130,107
2
$68,590
23
$92,476
0
$0
APPLICATIONS DENIED
65
$143,661
372
$116,169
599
$137,185
114
$49,504
92
$102,334
14
$83,029
APPLICATIONS WITHDRAWN
23
$145,740
145
$116,300
158
$130,612
8
$67,198
18
$142,741
2
$58,465
FILES CLOSED FOR INCOMPLETENESS
0
$0
52
$120,562
41
$138,429
2
$10,395
7
$111,889
0
$0
Aggregated Statistics For Year 2006 (Based on 4 partial tracts)
A) FHA, FSA/RHS & VA Home Purchase Loans
B) Conventional Home Purchase Loans
C) Refinancings
D) Home Improvement Loans
F) Non-occupant Loans on < 5 Family Dwellings (A B C & D)
G) Loans On Manufactured Home Dwelling (A B C & D)
Number
Average Value
Number
Average Value
Number
Average Value
Number
Average Value
Number
Average Value
Number
Average Value
LOANS ORIGINATED
134
$139,688
1,281
$89,627
235
$113,579
14
$26,059
191
$78,620
7
$53,811
APPLICATIONS APPROVED, NOT ACCEPTED
17
$147,751
291
$97,008
86
$113,761
3
$4,557
34
$70,375
8
$57,328
APPLICATIONS DENIED
34
$129,990
652
$97,672
527
$127,416
104
$27,467
88
$80,118
22
$48,438
APPLICATIONS WITHDRAWN
78
$133,476
287
$97,854
246
$125,213
8
$89,215
45
$77,357
2
$7,595
FILES CLOSED FOR INCOMPLETENESS
0
$0
64
$89,028
96
$130,540
0
$0
3
$72,323
0
$0
Aggregated Statistics For Year 2005 (Based on 4 partial tracts)
A) FHA, FSA/RHS & VA Home Purchase Loans
B) Conventional Home Purchase Loans
C) Refinancings
D) Home Improvement Loans
E) Loans on Dwellings For 5+ Families
F) Non-occupant Loans on < 5 Family Dwellings (A B C & D)
G) Loans On Manufactured Home Dwelling (A B C & D)
Number
Average Value
Number
Average Value
Number
Average Value
Number
Average Value
Number
Average Value
Number
Average Value
Number
Average Value
LOANS ORIGINATED
141
$128,714
1,171
$85,513
200
$107,945
26
$46,952
0
$0
101
$67,456
20
$45,178
APPLICATIONS APPROVED, NOT ACCEPTED
18
$133,314
324
$84,916
81
$109,242
2
$8,940
0
$0
14
$81,028
12
$34,928
APPLICATIONS DENIED
31
$131,387
618
$95,213
580
$129,724
98
$30,909
0
$0
81
$78,926
33
$50,414
APPLICATIONS WITHDRAWN
22
$141,458
244
$114,910
281
$159,878
37
$199,272
2
$102,505
35
$102,375
0
$0
FILES CLOSED FOR INCOMPLETENESS
0
$0
47
$101,165
55
$128,713
0
$0
0
$0
6
$96,685
0
$0
Aggregated Statistics For Year 2004 (Based on 4 partial tracts)
A) FHA, FSA/RHS & VA Home Purchase Loans
B) Conventional Home Purchase Loans
C) Refinancings
D) Home Improvement Loans
F) Non-occupant Loans on < 5 Family Dwellings (A B C & D)
G) Loans On Manufactured Home Dwelling (A B C & D)
Number
Average Value
Number
Average Value
Number
Average Value
Number
Average Value
Number
Average Value
Number
Average Value
LOANS ORIGINATED
337
$128,794
1,237
$100,447
285
$117,197
22
$40,387
49
$89,257
5
$53,630
APPLICATIONS APPROVED, NOT ACCEPTED
12
$121,248
492
$98,037
85
$113,543
7
$12,306
9
$95,332
5
$50,136
APPLICATIONS DENIED
69
$129,945
535
$100,757
582
$124,108
69
$35,975
29
$130,833
34
$50,300
APPLICATIONS WITHDRAWN
43
$125,267
245
$118,070
190
$119,877
8
$27,179
4
$121,100
6
$82,510
FILES CLOSED FOR INCOMPLETENESS
2
$109,485
45
$110,572
73
$130,527
0
$0
0
$0
0
$0
Aggregated Statistics For Year 2003 (Based on 4 partial tracts)
A) FHA, FSA/RHS & VA Home Purchase Loans
B) Conventional Home Purchase Loans
C) Refinancings
D) Home Improvement Loans
F) Non-occupant Loans on < 5 Family Dwellings (A B C & D)
Number
Average Value
Number
Average Value
Number
Average Value
Number
Average Value
Number
Average Value
LOANS ORIGINATED
202
$130,081
733
$113,394
421
$113,766
16
$21,256
15
$118,695
APPLICATIONS APPROVED, NOT ACCEPTED
20
$132,098
198
$118,160
106
$120,921
8
$17,431
5
$144,110
APPLICATIONS DENIED
34
$132,937
286
$124,576
410
$117,495
61
$18,006
15
$66,437
APPLICATIONS WITHDRAWN
29
$132,642
153
$110,029
203
$118,115
8
$18,495
8
$42,892
FILES CLOSED FOR INCOMPLETENESS
0
$0
63
$126,880
31
$119,500
2
$30,370
1
$40,580
Aggregated Statistics For Year 1999 (Based on 2 partial tracts)
A) FHA, FSA/RHS & VA Home Purchase Loans
B) Conventional Home Purchase Loans
C) Refinancings
D) Home Improvement Loans
F) Non-occupant Loans on < 5 Family Dwellings (A B C & D)
Detailed PMIC statistics for the following Tracts:6707.00
, 6708.00
2002 - 2018 National Fire Incident Reporting System (NFIRS) incidents
According to the data from the years 2002 - 2018 the average number of fires per year is 49. The highest number of fires - 107 took place in 2014, and the least - 7 in 2013. The data has a decreasing trend.
When looking into fire subcategories, the most incidents belonged to: Outside Fires (46.9%), and Structure Fires (39.9%).
Fire incident types reported to NFIRS in Zip Code 77545
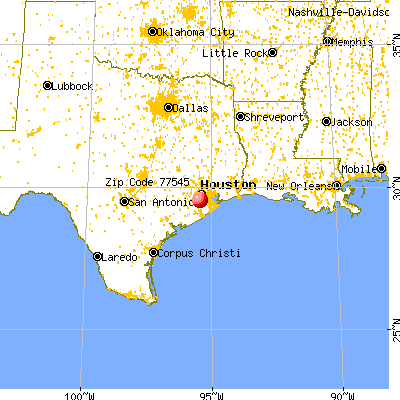


 Nearest zip codes: 77053, 77459, 77489, 77085, 77481, 77045.


 According to the data from the years 2002 - 2018 the average number of fires per year is 49. The highest number of fires - 107 took place in 2014, and the least - 7 in 2013. The data has a decreasing trend.
 When looking into fire subcategories, the most incidents belonged to: Outside Fires (46.9%), and Structure Fires (39.9%).