Estimated zip code population in 2022: 9,587 Zip code population in 2010: 9,735 Zip code population in 2000: 9,494
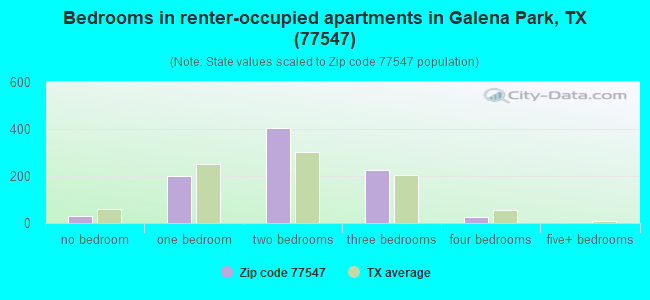
Houses and condos: 2,821 Renter-occupied apartments: 892
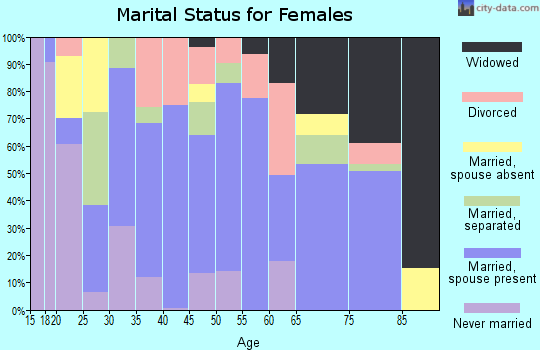
% of renters here:
33%
State:
38%
March 2022 cost of living index in zip code 77547: 94.9 (less than average, U.S. average is 100)
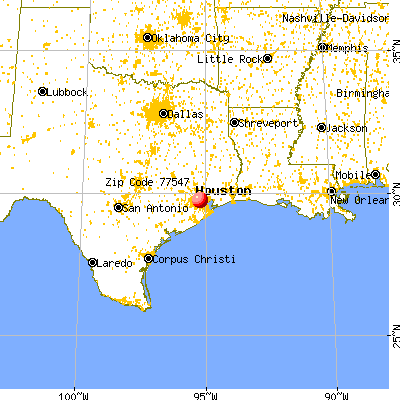
Land area: 2.7 sq. mi. Water area: 0.2 sq. mi.
Population density: 3,596 people per square mile
(average).
OSM Map
General Map
Google Map
MSN Map
OSM Map
General Map
Google Map
MSN Map
OSM Map
General Map
Google Map
MSN Map
OSM Map
General Map
Google Map
MSN Map
Please wait while loading the map...
Real estate property taxes paid for housing units in 2022:
This zip code:
1.9% ($2,180)
Texas:
1.5% ($4,050)
Median real estate property taxes paid for housing units with mortgages in 2022: $2,517 (1.7%) Median real estate property taxes paid for housing units with no mortgage in 2022: $1,971 (1.8%)
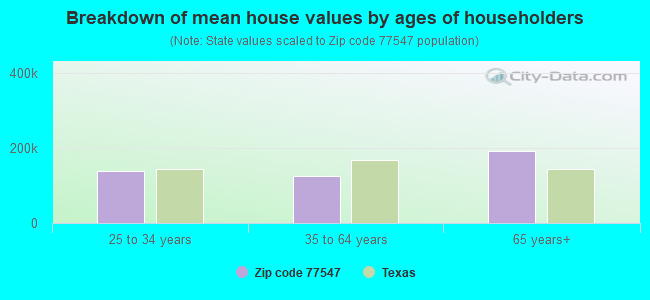
Estimated median house/condo value in 2022: $112,706
77547:
$112,706
Texas:
$275,400
According to our research of Texas and other state lists, there were 22 registered sex offenders living in 77547 zip code as of May 17, 2024. The ratio of all residents to sex offenders in zip code 77547 is 461 to 1. The ratio of registered sex offenders to all residents in this zip code is near the state average.
Median resident age:
This zip code:
27.6 years
Texas median age:
35.6 years
Average household size:
This zip code:
3.5 people
Texas:
2.6 people
Averages for the 2020 tax year for zip code 77547, filed in 2021:
Average Adjusted Gross Income (AGI) in 2020: $36,932 (Individual Income Tax Returns)
Here:
$36,932
State:
$77,054
Salary/wage: $36,813 (reported on 83.1% of returns)
Here:
$36,813
State:
$62,766
(% of AGI for various income ranges: 1182.1% for AGIs below $25k, 3757.7% for AGIs $25k-50k, 6721.6% for AGIs $50k-75k, 9226.8% for AGIs $75k-100k, 14040.0% for AGIs $100k-200k)
Taxable interest for individuals: $379 (reported on 9.1% of returns)
This zip code:
$379
Texas:
$2,665
(% of AGI for various income ranges: 2.1% for AGIs below $25k, 5.4% for AGIs $25k-50k, 4.9% for AGIs $50k-75k, 10.0% for AGIs $75k-100k, 8.5% for AGIs $100k-200k)
Ordinary dividends: $1,291 (reported on 2.6% of returns)
Here:
$1,291
State:
$10,044
(% of AGI for various income ranges: 2.6% for AGIs below $25k, 5.0% for AGIs $25k-50k, 26.8% for AGIs $75k-100k)
Net capital gain/loss in AGI: +$4,060 (reported on 2.4% of returns)
Here:
+$4,060
State:
+$39,590
(% of AGI for various income ranges: 3.0% for AGIs below $25k, 3.1% for AGIs $25k-50k, 174.2% for AGIs $75k-100k)
Profit/loss from business: +$4,561 (reported on 23.9% of returns)
Here:
+$4,561
State:
+$10,888
(% of AGI for various income ranges: 263.8% for AGIs below $25k, 67.9% for AGIs $25k-50k, 7.6% for AGIs $50k-75k, 106.8% for AGIs $75k-100k)
Taxable individual retirement arrangement distribution: $10,330 (reported on 2.4% of returns)
77547:
$10,330
Texas:
$24,740
(% of AGI for various income ranges: 6.7% for AGIs below $25k, 37.6% for AGIs $25k-50k, 274.7% for AGIs $75k-100k)
Total itemized deductions: $36,554 (reported on 3.1% of returns)
Here:
$36,554
State:
$40,428
(% of AGI for various income ranges: 137.9% for AGIs $25k-50k, 409.0% for AGIs $50k-75k, 863.1% for AGIs $100k-200k)
Charity contributions: $11,675 (reported on 1.9% of returns)
Here:
$11,675
State:
$18,201
(% of AGI for various income ranges: 28.5% for AGIs $25k-50k, 57.1% for AGIs $50k-75k, 170.5% for AGIs $75k-100k)
Taxes paid: $6,909 (reported on 2.6% of returns)
77547:
$6,909
State:
$7,821
(% of AGI for various income ranges: 24.6% for AGIs $25k-50k, 63.7% for AGIs $50k-75k, 122.3% for AGIs $100k-200k)
Earned income credit: $2,848 (reported on 29.4% of returns)
Here:
$2,848
State:
$2,584
(% of AGI for various income ranges: 179.5% for AGIs below $25k, 95.1% for AGIs $25k-50k, 2.9% for AGIs $50k-75k)
Percentage of individuals using paid preparers for their 2020 taxes: 86.2%
Here:
86%
State:
92%
(% for various income ranges: 85.3% for AGIs below $25k, 88.3% for AGIs $25k-50k, 82.8% for AGIs $50k-75k, 87.5% for AGIs $75k-100k, 88.2% for AGIs $100k-200k)
Averages for the 2012 tax year for zip code 77547, filed in 2013:
Average Adjusted Gross Income (AGI) in 2012: $36,105 (Individual Income Tax Returns)
Here:
$36,105
State:
$65,384
Salary/wage: $34,202 (reported on 87.1% of returns)
Here:
$34,202
State:
$52,524
(% of AGI for various income ranges: 76.7% for AGIs below $25k, 90.9% for AGIs $25k-50k, 91.6% for AGIs $50k-75k, 90.9% for AGIs $75k-100k, 52.6% for AGIs $100k-200k)
Taxable interest for individuals: $757 (reported on 9.4% of returns)
This zip code:
$757
Texas:
$2,372
(% of AGI for various income ranges: 0.2% for AGIs below $25k, 0.2% for AGIs $25k-50k, 0.1% for AGIs $50k-75k, 0.2% for AGIs $75k-100k, 0.2% for AGIs $100k-200k)
Ordinary dividends: $3,640 (reported on 2.5% of returns)
Here:
$3,640
State:
$9,721
(% of AGI for various income ranges: 0.3% for AGIs $25k-50k, 1.5% for AGIs $75k-100k)
Net capital gain/loss in AGI: +$9,283 (reported on 1.5% of returns)
Here:
+$9,283
State:
+$35,319
Profit/loss from business: +$8,437 (reported on 18.0% of returns)
Here:
+$8,437
State:
+$13,732
(% of AGI for various income ranges: 15.8% for AGIs below $25k, 3.3% for AGIs $25k-50k, 0.8% for AGIs $50k-75k, 2.4% for AGIs $75k-100k)
Taxable individual retirement arrangement distribution: $9,300 (reported on 2.8% of returns)
77547:
$9,300
Texas:
$19,511
(% of AGI for various income ranges: 0.6% for AGIs below $25k, 0.4% for AGIs $25k-50k, 1.2% for AGIs $50k-75k, 1.9% for AGIs $75k-100k)
Total itemized deductions: $18,653 (30% of AGI, reported on 11.9% of returns)
Here:
$18,653
State:
$24,724
Here:
29.9% of AGI
State:
15.9% of AGI
(% of AGI for various income ranges: 2.9% for AGIs below $25k, 6.3% for AGIs $25k-50k, 7.4% for AGIs $50k-75k, 7.8% for AGIs $75k-100k, 6.2% for AGIs $100k-200k)
Charity contributions: $3,675 (reported on 8.1% of returns)
Here:
$3,675
State:
$6,808
(% of AGI for various income ranges: 0.2% for AGIs below $25k, 0.7% for AGIs $25k-50k, 0.8% for AGIs $50k-75k, 1.1% for AGIs $75k-100k, 1.6% for AGIs $100k-200k)
Taxes paid: $3,414 (reported on 10.6% of returns)
77547:
$3,414
State:
$6,921
(% of AGI for various income ranges: 0.3% for AGIs below $25k, 1.0% for AGIs $25k-50k, 1.2% for AGIs $50k-75k, 1.4% for AGIs $75k-100k, 1.3% for AGIs $100k-200k)
Earned income credit: $2,690 (reported on 31.4% of returns)
Here:
$2,690
State:
$2,570
(% of AGI for various income ranges: 10.4% for AGIs below $25k, 1.8% for AGIs $25k-50k)
Percentage of individuals using paid preparers for their 2012 taxes: 71.1%
Here:
71%
State:
51%
(% for various income ranges: 70.6% for AGIs below $25k, 71.1% for AGIs $25k-50k, 75.0% for AGIs $50k-75k, 68.4% for AGIs $75k-100k, 66.7% for AGIs $100k-200k)
Averages for the 2004 tax year for zip code 77547, filed in 2005:
Average Adjusted Gross Income (AGI) in 2004: $27,485 (Individual Income Tax Returns)
Here:
$27,485
State:
$47,881
Salary/wage: $27,423 (reported on 87.7% of returns)
Here:
$27,423
State:
$41,947
(% of AGI for various income ranges: 88.2% for AGIs below $10k, 82.6% for AGIs $10k-25k, 91.6% for AGIs $25k-50k, 88.5% for AGIs $50k-75k, 87.1% for AGIs $75k-100k, 72.2% for AGIs over 100k)
Taxable interest for individuals: $817 (reported on 18.4% of returns)
This zip code:
$817
Texas:
$2,255
(% of AGI for various income ranges: 1.5% for AGIs below $10k, 0.6% for AGIs $10k-25k, 0.3% for AGIs $25k-50k, 0.5% for AGIs $50k-75k, 0.4% for AGIs $75k-100k, 1.6% for AGIs over 100k)
Taxable dividends: $1,561 (reported on 4.4% of returns)
Here:
$1,561
State:
$4,261
(% of AGI for various income ranges: 0.7% for AGIs below $10k, 0.3% for AGIs $10k-25k, 0.1% for AGIs $25k-50k, 0.2% for AGIs $50k-75k, 0.1% for AGIs $75k-100k, 1.3% for AGIs over 100k)
Net capital gain/loss: +$1,336 (reported on 2.9% of returns)
Here:
+$1,336
State:
+$16,110
(% of AGI for various income ranges: 0.0% for AGIs below $10k, 0.1% for AGIs $10k-25k, 0.1% for AGIs $25k-50k, -0.0% for AGIs $50k-75k, 0.7% for AGIs $75k-100k, 0.8% for AGIs over 100k)
Profit/loss from business: +$6,230 (reported on 14.3% of returns)
Here:
+$6,230
State:
+$11,013
(% of AGI for various income ranges: 12.3% for AGIs below $10k, 8.5% for AGIs $10k-25k, 1.6% for AGIs $25k-50k, 1.1% for AGIs $50k-75k, 0.9% for AGIs $75k-100k)
IRA payment deduction: $2,353 (reported on 0.5% of returns)
77547:
$2,353
Texas:
$3,120
Total itemized deductions: $14,844 (30% of AGI, reported on 7.9% of returns)
Here:
$14,844
State:
$19,631
Here:
29.6% of AGI
State:
18.9% of AGI
(% of AGI for various income ranges: 3.1% for AGIs $10k-25k, 4.2% for AGIs $25k-50k, 4.8% for AGIs $50k-75k, 6.2% for AGIs $75k-100k, 7.1% for AGIs over 100k)
Charity contributions deductions: $3,888 (7% of AGI, reported on 6.0% of returns)
Here:
$3,888
State:
$4,753
Here:
7.2% of AGI
State:
4.2% of AGI
(% of AGI for various income ranges: 0.3% for AGIs $10k-25k, 0.7% for AGIs $25k-50k, 1.2% for AGIs $50k-75k, 1.6% for AGIs $75k-100k, 2.7% for AGIs over 100k)
Total tax: $2,817 (reported on 58.9% of returns)
77547:
$2,817
State:
$9,058
(% of AGI for various income ranges: 3.1% for AGIs below $10k, 3.1% for AGIs $10k-25k, 4.6% for AGIs $25k-50k, 8.0% for AGIs $50k-75k, 10.9% for AGIs $75k-100k, 17.0% for AGIs over 100k)
Earned income credit: $2,052 (reported on 31.7% of returns)
Here:
$2,052
State:
$2,024
Percentage of individuals using paid preparers for their 2004 taxes: 71.7%
Here:
72%
State:
57%
(% for various income ranges: 65.4% for AGIs below $10k, 75.2% for AGIs $10k-25k, 73.4% for AGIs $25k-50k, 71.8% for AGIs $50k-75k, 53.8% for AGIs $75k-100k, 67.4% for AGIs over 100k)
Likely homosexual households (counted as self-reported same-sex unmarried-partner households)
Lesbian couples: 0.4% of all households
Gay men: 0.0% of all households
Household received Food Stamps/SNAP in the past 12 months: 703 Household did not receive Food Stamps/SNAP in the past 12 months: 2,031
Women who had a birth in the past 12 months: 171 (76 now married, 92 unmarried) Women who did not have a birth in the past 12 months: 2,117 (864 now married, 1,254 unmarried)
Housing units in zip code 77547 with a mortgage: 522 (8 second mortgage, 9 both second mortgage and home equity loan) Median monthly owner costs for units with a mortgage: $1,262 Median monthly owner costs for units without a mortgage: $516
Residents with income below the poverty level in 2022:
This zip code:
32.8%
Whole state:
14.0%
Residents with income below 50% of the poverty level in 2022:
This zip code:
17.5%
Whole state:
7.4%
Median number of rooms in houses and condos:
Here:
5.6
State:
6.3
Median number of rooms in apartments:
Here:
4.0
State:
4.0
Notable locations in this zip code not listed on our city pages
Notable locations in zip code 77547: Galena Park Fire Department Station 1 Headquarters (A), Galena Park Police Department (B), Galena Park City Hall (C), Galena Park Fire Station (D), Galena Park Library (E), Galena Park Police Station (F), Port of Houston Authority Fire Department Station 1 (G). Display/hide their locations on the map
Churches in zip code 77547 include: First Baptist Church of Galena Park (A), Holland Avenue Baptist Church (B), Galena Park Church of the Nazarene (C), Galena Park Church of Christ (D), New Beginnings Church of God (E), Galena Park Methodist Church (F), Galena Park Church of God Seventh Day (G), Galena Park Assembly of God Church (H). Display/hide their locations on the map
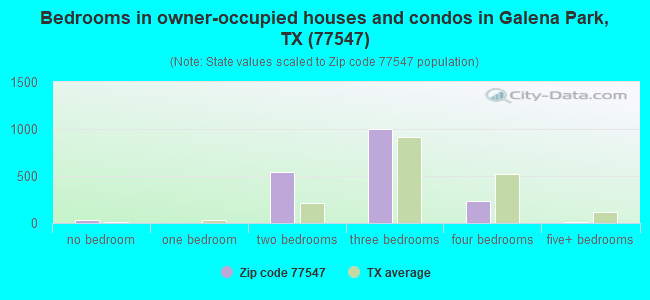
Size of family households: 566 2-persons, 412 3-persons, 770 4-persons, 232 5-persons, 167 6-persons, 84 7-or-more-persons
Size of nonfamily households: 338 1-person, 47 2-persons, 61 4-persons
1,253 married couples with children.
1,339 single-parent households (206 men, 1,133 women).
19.2% of residents of 77547 zip code speak English at home.
79.7% of residents speak Spanish at home (58% very well, 13% well, 14% not well, 15% not at all).
0.3% of residents speak other language at home (41% very well, 59% not well).
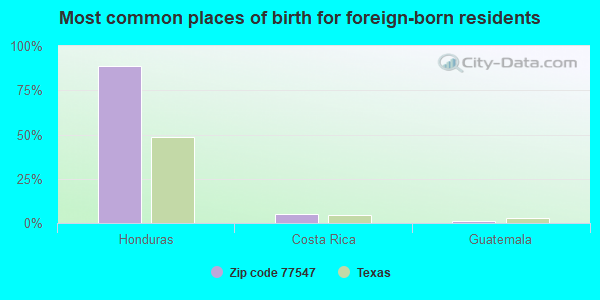
Foreign born population: 2,960 (30.9%) (37.3% of them are naturalized citizens)
This zip code:
30.9%
Whole state:
17.2%
88%Honduras
5%Costa Rica
1%Guatemala
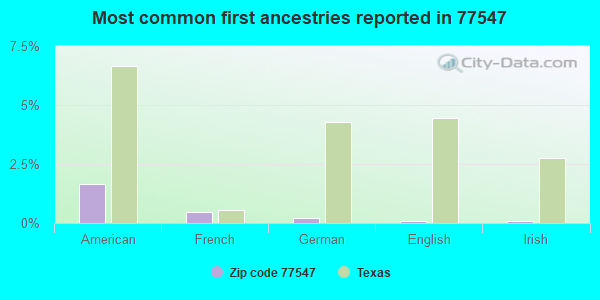
1%France
2%American
0%French
0%German
0%English
0%Irish
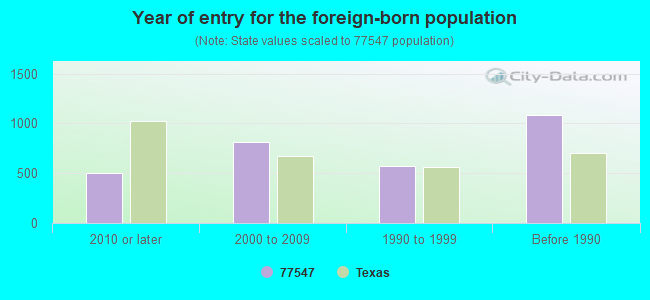
Year of entry for the foreign-born population
4992010 or later
8112000 to 2009
5711990 to 1999
1,085Before 1990
Facilities with environmental interests located in this zip code:
AMERICAN PLANT FOOD CORPORATION (903 MAYO SHELL RD. in GALENA PARK, TX)
(Integrated Compliance Information System) - ICIS-06-1989-0650, FORMAL ENFORCEMENT ACTION (Integrated Compliance Information System) - ICIS-06-2004-4367, FORMAL ENFORCEMENT ACTION COMPLIANCE ACTIVITY (Tracking inspections of insecticide, fungicide, and rodenticide, and toxic substances) (Resource Conservation and Recovery Act (tracking hazardous waste)) TRI REPORTER (Tracking of toxic chemicals releasing facilities) Business SIC classification: NITROGENOUS FERTILIZERS; PHOSPHATIC FERTILIZERS; FERTILIZERS, MIXING ONLY
AMERADA HESS CORP (FIRST STREET & BAITZEL AVENUE in PORT ST JOE, FL)
(Resource Conservation and Recovery Act (tracking hazardous waste)) Organizations: A A ZIZINIA, VICE PRESIDENT (CONTACT/OWNER)
Housing units lacking complete plumbing facilities: 2.2% Housing units lacking complete kitchen facilities: 2.7%
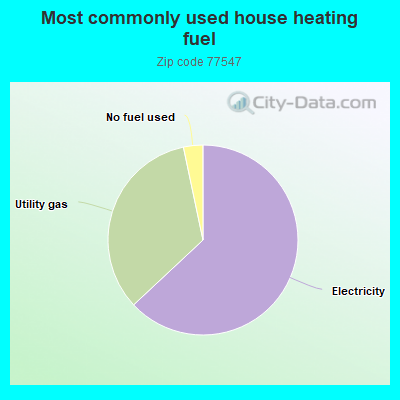
63.1%Electricity
33.7%Utility gas
3.3%No fuel used
Population in 1990: 9,306. Population change in the 1990s: +188 (+2.0%).
Place of birth for U.S.-born residents:
This state: 5,582
Northeast: 40
Midwest: 187
South: 310
West: 348
63% of the 77547 zip code residents lived in the same house 5 years ago. Out of people who lived in different houses, 89% lived in this county. Out of people who lived in different counties, 50% lived in Texas.
89% of the 77547 zip code residents lived in the same house 1 year ago. Out of people who lived in different houses, 60% moved from this county. Out of people who lived in different houses, 6% moved from different county within same state. Out of people who lived in different houses, 9% moved from different state. Out of people who lived in different houses, 25% moved from abroad.
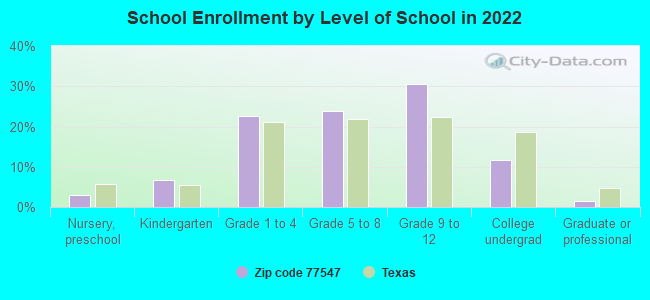
Private vs. public school enrollment:
Students in private schools in grades 1 to 8 (elementary and middle school): 107
Here:
8.4%
Texas:
8.8%
Students in private schools in grades 9 to 12 (high school):
Here:
0.0%
Texas:
8.0%
Students in private undergraduate colleges:
Here:
0.0%
Texas:
16.2%
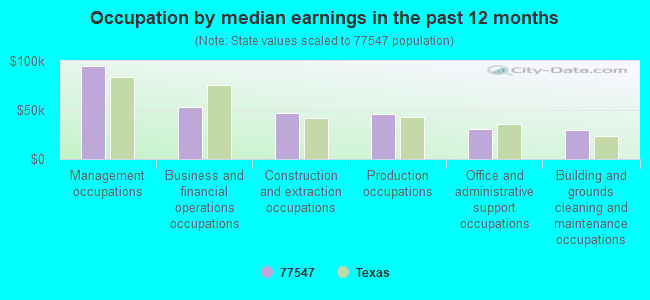
Occupation by median earnings in the past 12 months ($)
94,637Management occupations
53,183Business and financial operations occupations
47,288Construction and extraction occupations
46,316Production occupations
30,946Office and administrative support occupations
30,098Building and grounds cleaning and maintenance occupations
Companies with federal contracts located in this zip code:
AMERADA HESS CORPORATION (12901 AMERICAN PETROLEUM R in GALENA PARK, TX) : $24,519,827 in 10 contractsfrom 1999 to 2006
Contracts for Lease or Rental of Facilities -- Fuel Storage Buildings, Fuel Oils by Defense Logistics Agency Signed by year:2000: $1,783,579; 2001: $13,769,649; 2002: $2,192,051; 2003: $0; 2004: $636,000; 2005: $0; 2006: $2,280,600.
Biggest contracts:
$13,496,832 with Defense Logistics Agency for Lease or Rental of Facilities -- Fuel Storage Buildings. Signed on 2001-02-01. Completion date: 2002-01-31.
$2,747,748, same as above.Signed on 1999-11-30. Completion date: 2000-01-21.
$2,280,600 with Defense Logistics Agency for Lease or Rental of Facilities -- Fuel Storage Buildings. Taking place in GA. Signed on 2006-06-29. Completion date: 2007-04-30.
$2,191,600, same as above.Signed on 2002-03-15. Completion date: 2003-04-30.
WILLIAMS ENERGY PARTNERS L P (12901 AMERICAN PETROLEUM R in GALENA PARK, OK) : $18,451,500 in 6 contractsfrom 2001 to 2005
Contracts for Lease or Rental of Facilities -- Fuel Storage Buildings by Defense Logistics Agency Signed by year:2000: $0; 2001: $4,581,500; 2002: $120,000; 2003: $4,583,000; 2004: $4,583,000; 2005: $4,584,000; 2006: $0.
Biggest contracts:
$4,583,000 with Defense Logistics Agency for Lease or Rental of Facilities -- Fuel Storage Buildings. Signed on 2004-10-12. Completion date: 2006-01-31.
$4,583,000, same as above.Signed on 2005-08-17. Completion date: 2007-01-31.
$4,583,000, same as above.Signed on 2003-10-22. Completion date: 2005-01-31.
$4,581,500, same as above.Signed on 2001-12-07. Completion date: 2007-01-31.
BURBANK BARREL & DRUM, INC (1402 CLINTON DR in GALENA PARK, TX; small business)
$5,340 with Army for Drums and Cans. Signed on 2003-07-10. Completion date: 2003-07-10.
Top industries in this zip code by the number of employees in 2005:
Construction: Plumbing, Heating, and Air-Conditioning Contractors (100-249: 1)
Other Services (except Public Administration): Commercial and Industrial Machinery and Equipment (except Automotive and Electronic) Repair and Maintenance (50-99: 2, 1-4: 1)
People in group quarters in 2000:
3 people in religious group quarters
Fatal accident statistics in 2012:
Fatal accident count: 1
Vehicles involved in fatal accidents: 2
Fatal accidents caused by drunken drivers: 1
Fatalities: 1
Persons involved in fatal accidents: 6
Pedestrians involved in fatal accidents: 0
Fatal accident statistics in 2010:
Fatal accident count: 1
Vehicles involved in fatal accidents: 3
Fatal accidents caused by drunken drivers: 0
Fatalities: 1
Persons involved in fatal accidents: 4
Pedestrians involved in fatal accidents: 0
Home Mortgage Disclosure Act Aggregated Statistics For Year 2009 (Based on 2 partial tracts)
A) FHA, FSA/RHS & VA Home Purchase Loans
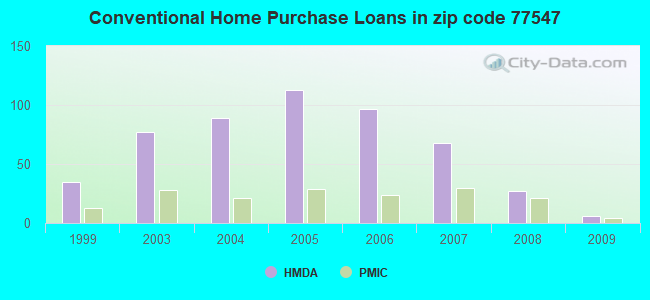
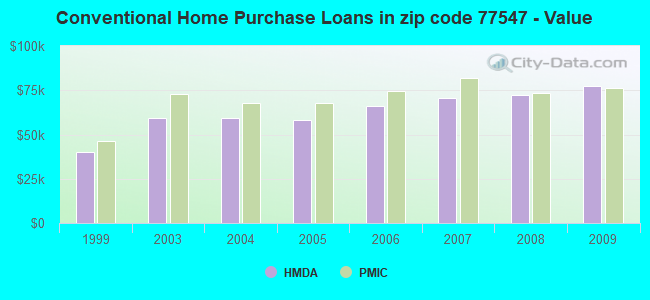
B) Conventional Home Purchase Loans
C) Refinancings
D) Home Improvement Loans
F) Non-occupant Loans on < 5 Family Dwellings (A B C & D)
G) Loans On Manufactured Home Dwelling (A B C & D)
Number
Average Value
Number
Average Value
Number
Average Value
Number
Average Value
Number
Average Value
Number
Average Value
LOANS ORIGINATED
20
$81,578
6
$77,628
30
$48,187
6
$39,187
2
$41,125
1
$42,910
APPLICATIONS APPROVED, NOT ACCEPTED
1
$60,790
2
$72,415
3
$80,460
0
$0
0
$0
0
$0
APPLICATIONS DENIED
7
$94,126
4
$86,270
33
$65,722
17
$27,661
4
$48,722
0
$0
APPLICATIONS WITHDRAWN
4
$73,308
2
$24,585
5
$82,606
4
$33,525
0
$0
0
$0
FILES CLOSED FOR INCOMPLETENESS
0
$0
2
$39,335
3
$89,697
1
$50,960
0
$0
0
$0
Aggregated Statistics For Year 2008 (Based on 2 partial tracts)
A) FHA, FSA/RHS & VA Home Purchase Loans
B) Conventional Home Purchase Loans
C) Refinancings
D) Home Improvement Loans
F) Non-occupant Loans on < 5 Family Dwellings (A B C & D)
Number
Average Value
Number
Average Value
Number
Average Value
Number
Average Value
Number
Average Value
LOANS ORIGINATED
11
$82,573
27
$72,215
35
$57,574
14
$39,974
10
$52,657
APPLICATIONS APPROVED, NOT ACCEPTED
1
$101,020
1
$44,700
8
$60,569
0
$0
0
$0
APPLICATIONS DENIED
4
$94,540
20
$77,331
49
$66,904
25
$34,044
5
$46,666
APPLICATIONS WITHDRAWN
1
$59,000
3
$91,187
13
$96,896
4
$55,652
3
$61,983
FILES CLOSED FOR INCOMPLETENESS
0
$0
2
$105,490
4
$75,768
0
$0
0
$0
Aggregated Statistics For Year 2007 (Based on 2 partial tracts)
A) FHA, FSA/RHS & VA Home Purchase Loans
B) Conventional Home Purchase Loans
C) Refinancings
D) Home Improvement Loans
F) Non-occupant Loans on < 5 Family Dwellings (A B C & D)
G) Loans On Manufactured Home Dwelling (A B C & D)
Number
Average Value
Number
Average Value
Number
Average Value
Number
Average Value
Number
Average Value
Number
Average Value
LOANS ORIGINATED
1
$64,370
68
$70,758
61
$59,532
13
$46,901
27
$57,944
0
$0
APPLICATIONS APPROVED, NOT ACCEPTED
0
$0
9
$66,256
11
$68,188
4
$18,998
6
$64,517
0
$0
APPLICATIONS DENIED
0
$0
35
$66,539
76
$61,098
35
$36,501
21
$55,470
2
$48,275
APPLICATIONS WITHDRAWN
0
$0
10
$53,104
23
$71,248
4
$56,992
5
$78,314
0
$0
FILES CLOSED FOR INCOMPLETENESS
0
$0
9
$67,348
16
$69,397
1
$26,820
4
$60,792
0
$0
Aggregated Statistics For Year 2006 (Based on 2 partial tracts)
A) FHA, FSA/RHS & VA Home Purchase Loans
B) Conventional Home Purchase Loans
C) Refinancings
D) Home Improvement Loans
F) Non-occupant Loans on < 5 Family Dwellings (A B C & D)
G) Loans On Manufactured Home Dwelling (A B C & D)
Number
Average Value
Number
Average Value
Number
Average Value
Number
Average Value
Number
Average Value
Number
Average Value
LOANS ORIGINATED
7
$79,694
97
$66,018
62
$63,287
15
$34,151
22
$46,447
0
$0
APPLICATIONS APPROVED, NOT ACCEPTED
1
$66,160
15
$65,799
12
$64,442
4
$31,738
3
$42,913
0
$0
APPLICATIONS DENIED
1
$75,990
39
$73,056
94
$62,238
38
$25,150
19
$56,652
0
$0
APPLICATIONS WITHDRAWN
2
$103,705
14
$65,517
37
$65,673
3
$44,103
8
$49,059
1
$118,900
FILES CLOSED FOR INCOMPLETENESS
0
$0
9
$75,592
15
$69,673
1
$17,880
4
$79,120
0
$0
Aggregated Statistics For Year 2005 (Based on 2 partial tracts)
A) FHA, FSA/RHS & VA Home Purchase Loans
B) Conventional Home Purchase Loans
C) Refinancings
D) Home Improvement Loans
E) Loans on Dwellings For 5+ Families
F) Non-occupant Loans on < 5 Family Dwellings (A B C & D)
G) Loans On Manufactured Home Dwelling (A B C & D)
Number
Average Value
Number
Average Value
Number
Average Value
Number
Average Value
Number
Average Value
Number
Average Value
Number
Average Value
LOANS ORIGINATED
5
$69,554
113
$58,458
89
$62,570
18
$43,061
2
$91,190
23
$48,743
0
$0
APPLICATIONS APPROVED, NOT ACCEPTED
1
$66,160
17
$46,541
13
$58,385
4
$41,795
0
$0
3
$37,250
1
$21,460
APPLICATIONS DENIED
1
$79,570
43
$55,012
148
$58,877
46
$27,325
1
$94,760
19
$50,111
1
$30,400
APPLICATIONS WITHDRAWN
1
$79,570
21
$217,880
63
$82,901
18
$124,862
0
$0
6
$341,062
0
$0
FILES CLOSED FOR INCOMPLETENESS
0
$0
3
$42,613
30
$70,596
0
$0
0
$0
1
$59,900
0
$0
Aggregated Statistics For Year 2004 (Based on 2 partial tracts)
A) FHA, FSA/RHS & VA Home Purchase Loans
B) Conventional Home Purchase Loans
C) Refinancings
D) Home Improvement Loans
E) Loans on Dwellings For 5+ Families
F) Non-occupant Loans on < 5 Family Dwellings (A B C & D)
G) Loans On Manufactured Home Dwelling (A B C & D)
Number
Average Value
Number
Average Value
Number
Average Value
Number
Average Value
Number
Average Value
Number
Average Value
Number
Average Value
LOANS ORIGINATED
8
$71,520
89
$59,336
117
$55,841
19
$40,465
1
$519,410
25
$50,565
0
$0
APPLICATIONS APPROVED, NOT ACCEPTED
1
$76,880
38
$52,817
19
$55,852
4
$49,170
0
$0
5
$52,210
3
$39,633
APPLICATIONS DENIED
4
$66,828
30
$58,557
111
$55,581
28
$32,791
0
$0
14
$65,517
5
$32,900
APPLICATIONS WITHDRAWN
0
$0
12
$63,921
63
$57,003
4
$45,595
0
$0
4
$52,522
0
$0
FILES CLOSED FOR INCOMPLETENESS
1
$65,260
5
$66,156
19
$79,613
0
$0
0
$0
1
$58,110
0
$0
Aggregated Statistics For Year 2003 (Based on 2 partial tracts)
A) FHA, FSA/RHS & VA Home Purchase Loans
B) Conventional Home Purchase Loans
C) Refinancings
D) Home Improvement Loans
F) Non-occupant Loans on < 5 Family Dwellings (A B C & D)
Number
Average Value
Number
Average Value
Number
Average Value
Number
Average Value
Number
Average Value
LOANS ORIGINATED
16
$75,040
77
$59,585
123
$48,981
11
$14,710
18
$45,246
APPLICATIONS APPROVED, NOT ACCEPTED
1
$59,000
15
$52,865
16
$58,724
3
$9,237
3
$59,600
APPLICATIONS DENIED
1
$67,940
30
$54,147
112
$51,509
11
$26,007
4
$59,450
APPLICATIONS WITHDRAWN
2
$66,155
15
$60,971
48
$57,738
4
$37,995
3
$60,793
FILES CLOSED FOR INCOMPLETENESS
0
$0
9
$59,202
4
$44,252
0
$0
1
$65,260
Aggregated Statistics For Year 1999 (Based on 1 partial tract)
A) FHA, FSA/RHS & VA Home Purchase Loans
B) Conventional Home Purchase Loans
C) Refinancings
D) Home Improvement Loans
F) Non-occupant Loans on < 5 Family Dwellings (A B C & D)
Detailed PMIC statistics for the following Tracts:2337.00
2002 - 2018 National Fire Incident Reporting System (NFIRS) incidents
According to the data from the years 2002 - 2018 the average number of fire incidents per year is 23. The highest number of fires - 51 took place in 2005, and the least - 2 in 2002. The data has an increasing trend.
When looking into fire subcategories, the most reports belonged to: Structure Fires (45.6%), and Outside Fires (27.5%).
Fire incident types reported to NFIRS in Zip Code 77547


 Nearest zip codes: 77029, 77012, 77506, 77017, 77013, 77502.


 According to the data from the years 2002 - 2018 the average number of fire incidents per year is 23. The highest number of fires - 51 took place in 2005, and the least - 2 in 2002. The data has an increasing trend.
 When looking into fire subcategories, the most reports belonged to: Structure Fires (45.6%), and Outside Fires (27.5%).