Averages for the 2020 tax year for zip code 77655, filed in 2021:
Average Adjusted Gross Income (AGI) in 2020: $62,606 (Individual Income Tax Returns)
Here:
$62,606
State:
$77,054
Salary/wage: $54,393 (reported on 87.5% of returns)
Here:
$54,393
State:
$62,766
(% of AGI for various income ranges: 1393.3% for AGIs below $25k, 3322.5% for AGIs $25k-50k, 10780.0% for AGIs $50k-75k, 12373.3% for AGIs $100k-200k)
Taxable interest for individuals: $100 (reported on 18.8% of returns)
This zip code:
$100
Texas:
$2,665
(% of AGI for various income ranges: 15.0% for AGIs $50k-75k)
Earned income credit: $1,400 (reported on 18.8% of returns)
Here:
$1,400
State:
$2,584
(% of AGI for various income ranges: 140.0% for AGIs below $25k)
Percentage of individuals using paid preparers for their 2020 taxes: 93.8%
Here:
94%
State:
92%
(% for various income ranges: 100.0% for AGIs below $25k, 100.0% for AGIs $25k-50k, 100.0% for AGIs $50k-75k, 75.0% for AGIs $100k-200k)
Averages for the 2012 tax year for zip code 77655, filed in 2013:
Average Adjusted Gross Income (AGI) in 2012: $48,900 (Individual Income Tax Returns)
Here:
$48,900
State:
$65,384
Salary/wage: $48,008 (reported on 86.7% of returns)
Here:
$48,008
State:
$52,524
(% of AGI for various income ranges: 67.3% for AGIs below $25k, 94.4% for AGIs $25k-50k, 79.2% for AGIs $50k-75k, 89.0% for AGIs $75k-100k)
Taxable interest for individuals: $175 (reported on 26.7% of returns)
This zip code:
$175
Texas:
$2,372
Earned income credit: $2,000 (reported on 20.0% of returns)
Here:
$2,000
State:
$2,570
(% of AGI for various income ranges: 7.8% for AGIs below $25k)
Percentage of individuals using paid preparers for their 2012 taxes: 60.0%
Here:
60%
State:
51%
Averages for the 2004 tax year for zip code 77655, filed in 2005:
Average Adjusted Gross Income (AGI) in 2004: $38,563 (Individual Income Tax Returns)
Here:
$38,563
State:
$47,881
Salary/wage: $34,045 (reported on 87.7% of returns)
Here:
$34,045
State:
$41,947
(% of AGI for various income ranges: 71.9% for AGIs below $10k, 83.9% for AGIs $10k-25k, 85.5% for AGIs $25k-50k, 81.0% for AGIs $50k-75k, 98.0% for AGIs $75k-100k, 52.9% for AGIs over 100k)
Taxable interest for individuals: $635 (reported on 29.4% of returns)
This zip code:
$635
Texas:
$2,255
(% of AGI for various income ranges: 1.8% for AGIs below $10k, 0.8% for AGIs $10k-25k, 0.1% for AGIs $25k-50k, 0.3% for AGIs $50k-75k, 1.1% for AGIs over 100k)
Taxable dividends: $920 (reported on 9.9% of returns)
Here:
$920
State:
$4,261
Total itemized deductions: $16,500 (39% of AGI, reported on 8.7% of returns)
Here:
$16,500
State:
$19,631
Here:
39.1% of AGI
State:
18.9% of AGI
Charity contributions deductions: $3,786 (8% of AGI, reported on 5.6% of returns)
Here:
$3,786
State:
$4,753
Here:
8.2% of AGI
State:
4.2% of AGI
Total tax: $4,492 (reported on 70.2% of returns)
77655:
$4,492
State:
$9,058
(% of AGI for various income ranges: 3.1% for AGIs below $10k, 3.6% for AGIs $10k-25k, 6.1% for AGIs $25k-50k, 9.0% for AGIs $50k-75k, 11.1% for AGIs $75k-100k, 11.1% for AGIs over 100k)
Earned income credit: $1,321 (reported on 21.0% of returns)
Here:
$1,321
State:
$2,024
Percentage of individuals using paid preparers for their 2004 taxes: 59.9%
Here:
60%
State:
57%
(% for various income ranges: 57.1% for AGIs below $10k, 60.9% for AGIs $10k-25k, 56.6% for AGIs $25k-50k, 57.1% for AGIs $50k-75k, 84.6% for AGIs $75k-100k, 66.7% for AGIs over 100k)
Household received Food Stamps/SNAP in the past 12 months: 9 Household did not receive Food Stamps/SNAP in the past 12 months: 170
Women who did not have a birth in the past 12 months: 38 (15 now married, 22 unmarried)
Housing units in zip code 77655 with a mortgage: 39 Median monthly owner costs for units with a mortgage: $1,708 Median monthly owner costs for units without a mortgage: $457
Residents with income below the poverty level in 2022:
This zip code:
3.6%
Whole state:
14.0%
Residents with income below 50% of the poverty level in 2022:
This zip code:
1.7%
Whole state:
7.4%
Median number of rooms in houses and condos:
Here:
4.9
State:
6.3
Notable locations in this zip code not listed on our city pages
Lakes: Fence Lake (A), Little Fence Lake (B), Salt Lake (C), Dipping Vat Ponds (D), Knight Lake (E), Pole Lake (F), Mud Lake (G). Display/hide their locations on the map
Parks in zip code 77655 include: Sea Rim State Park (1), Sabine Pass Battleground State Historical Park (2), Texas Point National Wildlife Refuge (3), Sabine Pass Battleground State Historical Park (4). Display/hide their locations on the map
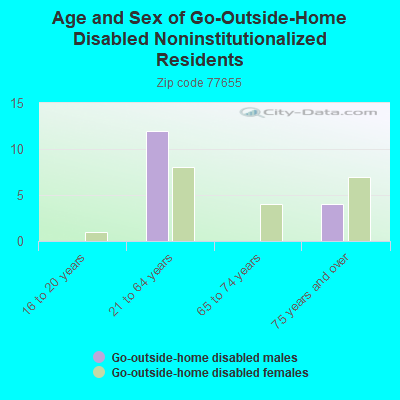
In group quarters: 15 (-1 institutionalized population)
Size of family households: 63 2-persons, 20 3-persons, 3 5-persons
Size of nonfamily households: 90 1-person, 5 2-persons
4 married couples with children.
10 single-parent households (10 women).
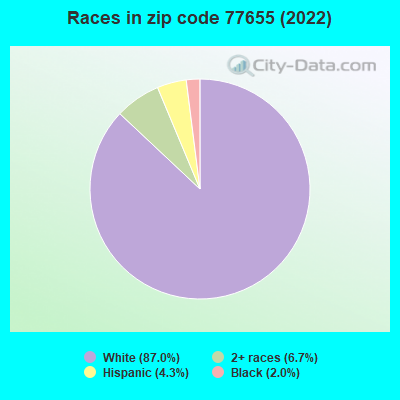
96.3% of residents of 77655 zip code speak English at home.
4.0% of residents speak Spanish at home (8% very well, 33% well, 58% not well).
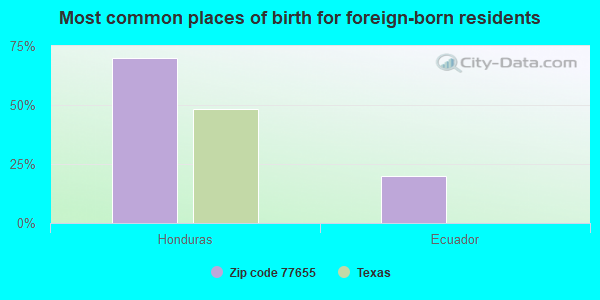
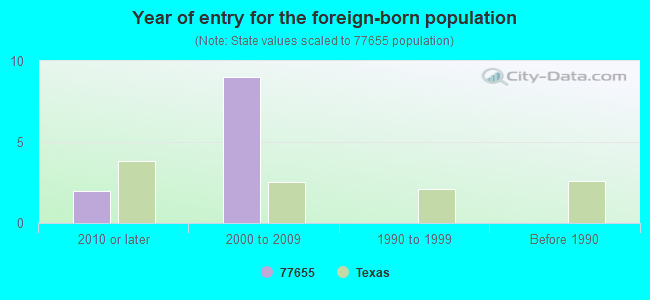
Foreign born population: 10 (3.4%) (21.8% of them are naturalized citizens)
This zip code:
3.4%
Whole state:
17.2%
70%Honduras
20%Ecuador
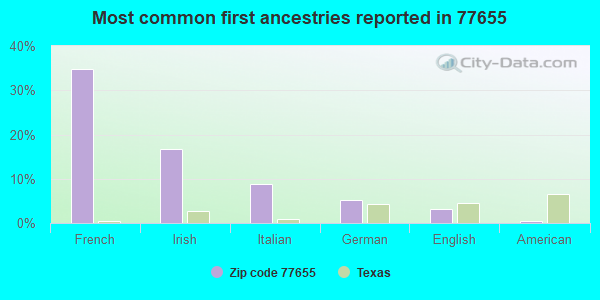
35%French
17%Irish
9%Italian
5%German
3%English
1%American
Year of entry for the foreign-born population
22010 or later
92000 to 2009
01990 to 1999
0Before 1990
Facilities with environmental interests located in this zip code:
AIR LOGISTICS (7700 S GULFWAY in SABINE PASS, TX)
Conditionally Exempt Small Quantity Generators, less than 100 kg/month of hazardous waste (Resource Conservation and Recovery Act (tracking hazardous waste)) - notification Business NAICS classification: NONSCHEDULED CHARTERED PASSENGER AIR TRANSPORTATION.
ANR PIPELINE COMPANY (7912 S 1ST AVE in SABINE PASS, TX)
Conditionally Exempt Small Quantity Generators, less than 100 kg/month of hazardous waste (Resource Conservation and Recovery Act (tracking hazardous waste)) Business NAICS classification: SUPPORT ACTIVITIES FOR OIL AND GAS OPERATIONS. Organizations: HIGH ISLAND OFFSHORE SYSTEM LLC (CONTACT/OWNER)
Housing units lacking complete plumbing facilities: 2.3% Housing units lacking complete kitchen facilities: 2.2%
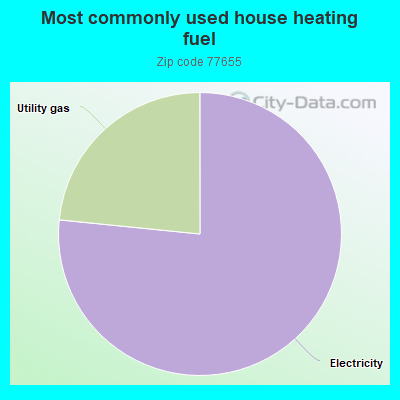
76.9%Electricity
23.5%Utility gas
Place of birth for U.S.-born residents:
This state: 204
Northeast: 10
Midwest: 15
South: 49
West: 7
62% of the 77655 zip code residents lived in the same house 5 years ago. Out of people who lived in different houses, 48% lived in this county. Out of people who lived in different counties, 50% lived in Texas.
97% of the 77655 zip code residents lived in the same house 1 year ago. Out of people who lived in different houses, 100% moved from this county.
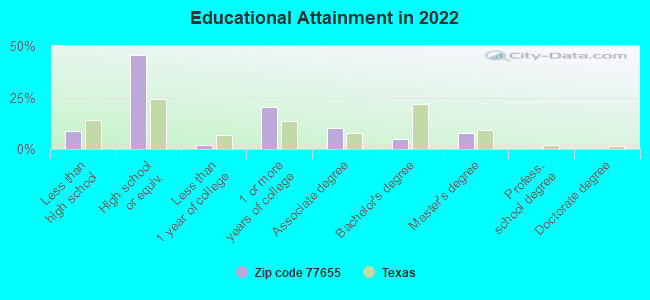
Private vs. public school enrollment:
Students in private schools in grades 1 to 8 (elementary and middle school):
Here:
0.0%
Texas:
8.8%
Students in private schools in grades 9 to 12 (high school):
Here:
0.0%
Texas:
8.0%
Students in private undergraduate colleges:
Here:
0.0%
Texas:
16.2%
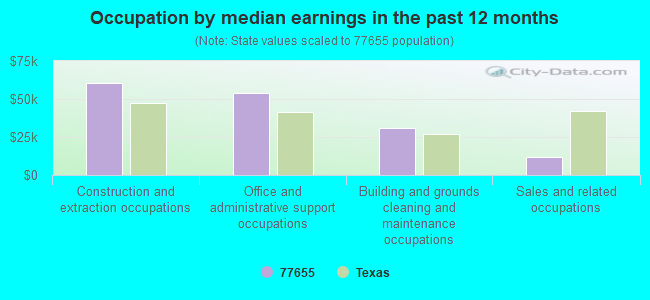
Occupation by median earnings in the past 12 months ($)
60,311Construction and extraction occupations
53,994Office and administrative support occupations
30,932Building and grounds cleaning and maintenance occupations
12,097Sales and related occupations
Companies with federal contracts located in this zip code:
R L ELDRIDGE CONSTRUCTION INC (5121 S 1ST AVE in SABINE PASS, TX; small business) 50 employees, $15657320 revenue. : $38,000 in 2 contractsfrom 2001 to 2002
$32,000 with U.S. Army Corps of Engineers - civil program financing only for Maintenance, Repair or Alteration of Real Property -- Dredging. Signed on 2001-12-14. Completion date: 2002-04-29.
$6,000 with United States Coast Guard (disused code: now 7008) for Maintenance, Repair or Alteration of Real Property -- Other Non-Building Facilities. Signed on 2002-06-15. Completion date: 2002-07-15.
Top industries in this zip code by the number of employees in 2005:
Construction: Other Heavy and Civil Engineering Construction (50-99 employees: 1 establishment)
Mining: Support Activities for Oil and Gas Operations (50-99: 1)
Wholesale Trade: Petroleum and Petroleum Products Merchant Wholesalers (except Bulk Stations and Terminals) (10-19: 1)
Construction: Other Building Equipment Contractors (10-19: 1)
People in group quarters in 2010:
4 people in military barracks and dormitories (nondisciplinary)
People in group quarters in 2000:
8 people in other workers' dormitories
6 people in unknown juvenile institutions
Home Mortgage Disclosure Act Aggregated Statistics For Year 2009 (Based on 2 partial tracts)
A) FHA, FSA/RHS & VA Home Purchase Loans
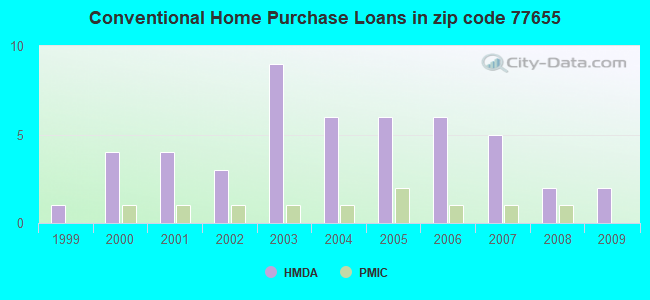
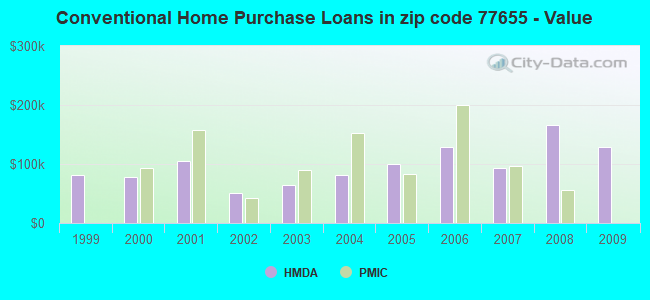
B) Conventional Home Purchase Loans
C) Refinancings
D) Home Improvement Loans
G) Loans On Manufactured Home Dwelling (A B C & D)
Number
Average Value
Number
Average Value
Number
Average Value
Number
Average Value
Number
Average Value
LOANS ORIGINATED
2
$160,540
2
$128,740
5
$108,958
2
$80,900
1
$42,490
APPLICATIONS APPROVED, NOT ACCEPTED
0
$0
1
$107,210
1
$70,630
0
$0
2
$61,625
APPLICATIONS DENIED
1
$95,680
2
$95,255
2
$120,860
1
$31,800
1
$63,310
APPLICATIONS WITHDRAWN
0
$0
1
$61,910
1
$39,960
0
$0
0
$0
FILES CLOSED FOR INCOMPLETENESS
0
$0
0
$0
1
$81,890
0
$0
0
$0
Aggregated Statistics For Year 2008 (Based on 2 partial tracts)
A) FHA, FSA/RHS & VA Home Purchase Loans
B) Conventional Home Purchase Loans
C) Refinancings
D) Home Improvement Loans
F) Non-occupant Loans on < 5 Family Dwellings (A B C & D)
G) Loans On Manufactured Home Dwelling (A B C & D)
Number
Average Value
Number
Average Value
Number
Average Value
Number
Average Value
Number
Average Value
Number
Average Value
LOANS ORIGINATED
2
$105,245
2
$166,165
3
$125,973
3
$65,283
1
$254,670
1
$55,440
APPLICATIONS APPROVED, NOT ACCEPTED
0
$0
2
$45,870
1
$78,230
0
$0
0
$0
1
$75,980
APPLICATIONS DENIED
1
$104,120
2
$111,155
5
$105,412
3
$28,983
0
$0
1
$95,960
APPLICATIONS WITHDRAWN
0
$0
1
$157,870
1
$81,890
0
$0
0
$0
0
$0
FILES CLOSED FOR INCOMPLETENESS
0
$0
0
$0
0
$0
0
$0
0
$0
0
$0
Aggregated Statistics For Year 2007 (Based on 2 partial tracts)
B) Conventional Home Purchase Loans
C) Refinancings
D) Home Improvement Loans
F) Non-occupant Loans on < 5 Family Dwellings (A B C & D)
G) Loans On Manufactured Home Dwelling (A B C & D)
Number
Average Value
Number
Average Value
Number
Average Value
Number
Average Value
Number
Average Value
LOANS ORIGINATED
5
$92,694
4
$117,908
4
$23,990
0
$0
1
$30,670
APPLICATIONS APPROVED, NOT ACCEPTED
1
$137,600
1
$43,900
1
$56,840
1
$21,110
1
$25,040
APPLICATIONS DENIED
3
$97,270
4
$88,640
3
$33,300
0
$0
2
$45,585
APPLICATIONS WITHDRAWN
1
$132,820
3
$87,140
0
$0
0
$0
0
$0
FILES CLOSED FOR INCOMPLETENESS
0
$0
0
$0
0
$0
0
$0
0
$0
Aggregated Statistics For Year 2006 (Based on 2 partial tracts)
B) Conventional Home Purchase Loans
C) Refinancings
D) Home Improvement Loans
F) Non-occupant Loans on < 5 Family Dwellings (A B C & D)
G) Loans On Manufactured Home Dwelling (A B C & D)
Number
Average Value
Number
Average Value
Number
Average Value
Number
Average Value
Number
Average Value
LOANS ORIGINATED
6
$128,318
2
$93,705
3
$27,013
1
$215,550
1
$52,340
APPLICATIONS APPROVED, NOT ACCEPTED
3
$54,780
1
$117,060
0
$0
0
$0
3
$41,647
APPLICATIONS DENIED
4
$84,210
5
$82,394
3
$21,857
0
$0
2
$36,020
APPLICATIONS WITHDRAWN
2
$85,125
4
$101,022
1
$35,170
0
$0
1
$32,640
FILES CLOSED FOR INCOMPLETENESS
0
$0
1
$91,170
0
$0
0
$0
0
$0
Aggregated Statistics For Year 2005 (Based on 2 partial tracts)
A) FHA, FSA/RHS & VA Home Purchase Loans
B) Conventional Home Purchase Loans
C) Refinancings
D) Home Improvement Loans
F) Non-occupant Loans on < 5 Family Dwellings (A B C & D)
G) Loans On Manufactured Home Dwelling (A B C & D)
Number
Average Value
Number
Average Value
Number
Average Value
Number
Average Value
Number
Average Value
Number
Average Value
LOANS ORIGINATED
1
$84,700
6
$99,475
8
$102,781
2
$16,885
0
$0
2
$55,575
APPLICATIONS APPROVED, NOT ACCEPTED
0
$0
3
$63,597
2
$77,805
0
$0
0
$0
2
$39,820
APPLICATIONS DENIED
0
$0
5
$52,622
9
$69,506
5
$28,366
1
$42,770
3
$46,900
APPLICATIONS WITHDRAWN
0
$0
2
$71,900
6
$83,763
1
$129,730
0
$0
0
$0
FILES CLOSED FOR INCOMPLETENESS
0
$0
1
$133,380
1
$131,410
0
$0
0
$0
0
$0
Aggregated Statistics For Year 2004 (Based on 2 partial tracts)
A) FHA, FSA/RHS & VA Home Purchase Loans
B) Conventional Home Purchase Loans
C) Refinancings
D) Home Improvement Loans
F) Non-occupant Loans on < 5 Family Dwellings (A B C & D)
G) Loans On Manufactured Home Dwelling (A B C & D)
Number
Average Value
Number
Average Value
Number
Average Value
Number
Average Value
Number
Average Value
Number
Average Value
LOANS ORIGINATED
0
$0
6
$81,278
7
$118,831
3
$38,270
2
$68,660
2
$32,080
APPLICATIONS APPROVED, NOT ACCEPTED
1
$54,030
2
$46,430
2
$56,700
0
$0
0
$0
1
$75,420
APPLICATIONS DENIED
0
$0
5
$32,136
12
$88,500
3
$36,207
1
$32,080
5
$29,940
APPLICATIONS WITHDRAWN
0
$0
2
$124,660
5
$85,264
1
$59,090
0
$0
0
$0
FILES CLOSED FOR INCOMPLETENESS
0
$0
0
$0
2
$69,365
0
$0
0
$0
0
$0
Aggregated Statistics For Year 2003 (Based on 2 partial tracts)
A) FHA, FSA/RHS & VA Home Purchase Loans
B) Conventional Home Purchase Loans
C) Refinancings
D) Home Improvement Loans
F) Non-occupant Loans on < 5 Family Dwellings (A B C & D)
Number
Average Value
Number
Average Value
Number
Average Value
Number
Average Value
Number
Average Value
LOANS ORIGINATED
0
$0
9
$65,160
14
$87,495
2
$7,740
1
$214,990
APPLICATIONS APPROVED, NOT ACCEPTED
0
$0
3
$46,523
4
$72,952
1
$9,850
0
$0
APPLICATIONS DENIED
1
$16,320
7
$42,250
12
$67,278
3
$28,703
1
$14,350
APPLICATIONS WITHDRAWN
0
$0
2
$108,900
4
$100,952
0
$0
0
$0
FILES CLOSED FOR INCOMPLETENESS
0
$0
0
$0
1
$41,080
0
$0
0
$0
Aggregated Statistics For Year 2002 (Based on 2 partial tracts)
B) Conventional Home Purchase Loans
C) Refinancings
D) Home Improvement Loans
F) Non-occupant Loans on < 5 Family Dwellings (A B C & D)
Number
Average Value
Number
Average Value
Number
Average Value
Number
Average Value
LOANS ORIGINATED
3
$51,310
5
$66,860
2
$19,135
0
$0
APPLICATIONS APPROVED, NOT ACCEPTED
1
$101,020
1
$126,910
0
$0
0
$0
APPLICATIONS DENIED
5
$35,794
5
$50,990
2
$12,520
1
$25,890
APPLICATIONS WITHDRAWN
1
$83,860
1
$120,720
0
$0
0
$0
FILES CLOSED FOR INCOMPLETENESS
0
$0
0
$0
0
$0
0
$0
Aggregated Statistics For Year 2001 (Based on 2 partial tracts)
A) FHA, FSA/RHS & VA Home Purchase Loans
B) Conventional Home Purchase Loans
C) Refinancings
D) Home Improvement Loans
Number
Average Value
Number
Average Value
Number
Average Value
Number
Average Value
LOANS ORIGINATED
1
$88,360
4
$105,455
3
$93,893
1
$30,950
APPLICATIONS APPROVED, NOT ACCEPTED
0
$0
1
$74,570
1
$26,730
0
$0
APPLICATIONS DENIED
0
$0
4
$54,592
3
$44,553
1
$19,700
APPLICATIONS WITHDRAWN
0
$0
1
$7,880
1
$142,110
0
$0
FILES CLOSED FOR INCOMPLETENESS
0
$0
0
$0
1
$40,800
0
$0
Aggregated Statistics For Year 2000 (Based on 2 partial tracts)
A) FHA, FSA/RHS & VA Home Purchase Loans
B) Conventional Home Purchase Loans
C) Refinancings
D) Home Improvement Loans
F) Non-occupant Loans on < 5 Family Dwellings (A B C & D)
Number
Average Value
Number
Average Value
Number
Average Value
Number
Average Value
Number
Average Value
LOANS ORIGINATED
1
$54,310
4
$77,595
1
$46,990
1
$12,380
0
$0
APPLICATIONS APPROVED, NOT ACCEPTED
0
$0
5
$43,224
0
$0
0
$0
0
$0
APPLICATIONS DENIED
0
$0
8
$38,762
3
$36,207
2
$6,895
1
$35,740
APPLICATIONS WITHDRAWN
0
$0
1
$50,370
1
$25,040
0
$0
0
$0
FILES CLOSED FOR INCOMPLETENESS
0
$0
0
$0
0
$0
0
$0
0
$0
Aggregated Statistics For Year 1999 (Based on 1 partial tract)


 Nearest zip codes: 77640, 77619, 77642, 77651, 77627, 77705.