Estimated zip code population in 2022: 6,474 Zip code population in 2010: 4,910 Zip code population in 2000: 4,576
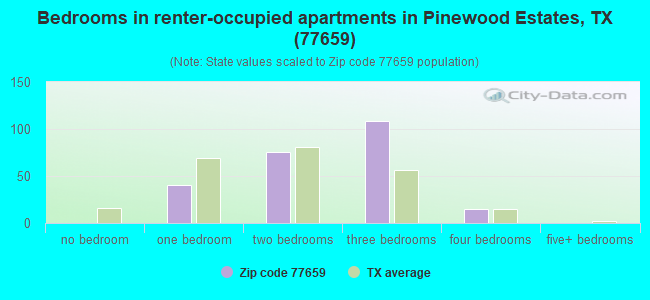
Houses and condos: 2,237 Renter-occupied apartments: 243
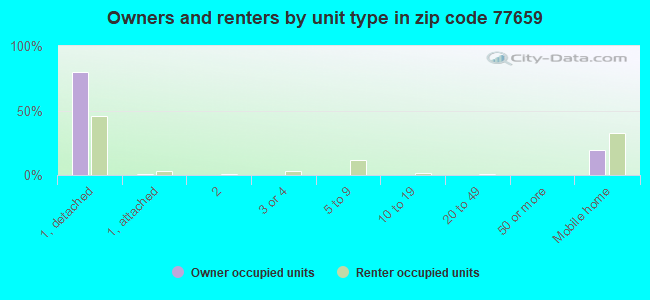
% of renters here:
12%
State:
38%
March 2022 cost of living index in zip code 77659: 79.7 (low, U.S. average is 100)
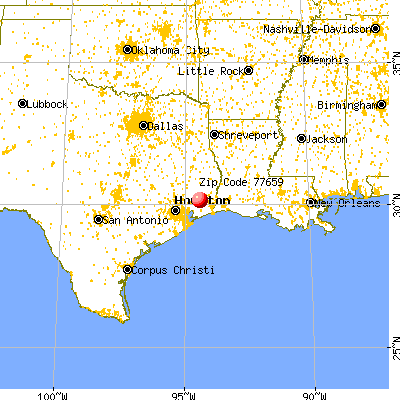
Land area: 116.5 sq. mi. Water area: 1.1 sq. mi.
Population density: 56 people per square mile
(very low).
OSM Map
General Map
Google Map
MSN Map
OSM Map
General Map
Google Map
MSN Map
OSM Map
General Map
Google Map
MSN Map
OSM Map
General Map
Google Map
MSN Map
Please wait while loading the map...
Real estate property taxes paid for housing units in 2022:
This zip code:
1.0% ($2,194)
Texas:
1.5% ($4,050)
Median real estate property taxes paid for housing units with mortgages in 2022: $2,955 (1.2%) Median real estate property taxes paid for housing units with no mortgage in 2022: $1,429 (1.0%)
Business Search- 14 Million verified businesses
Males: 3,443
(53.2%)
Females: 3,030
(46.8%)
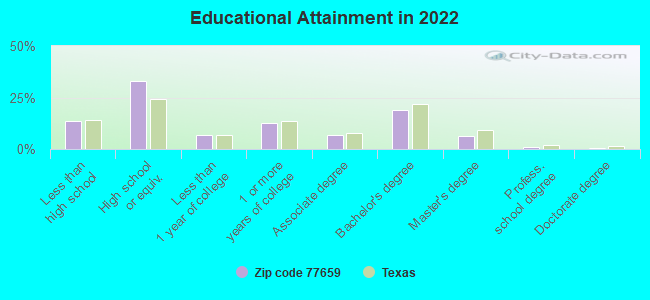
For population 25 years and over in 77659:
High school or higher: 85.1%
Bachelor's degree or higher: 26.4%
Graduate or professional degree: 7.7%
Unemployed: 5.4%
Mean travel time to work (commute): 29.9 minutes
For population 15 years and over in 77659:
Never married: 25.3%
Now married: 60.0%
Separated: 1.8%
Widowed: 4.4%
Divorced: 8.6%
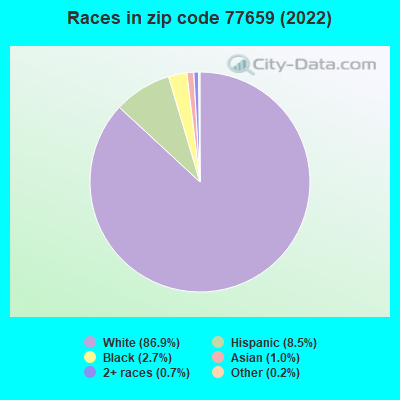
Zip code 77659 compared to state average:
Black race population percentage significantly below state average.
Hispanic race population percentage significantly below state average.
Foreign-born population percentage significantly below state average.
Renting percentage significantly below state average.
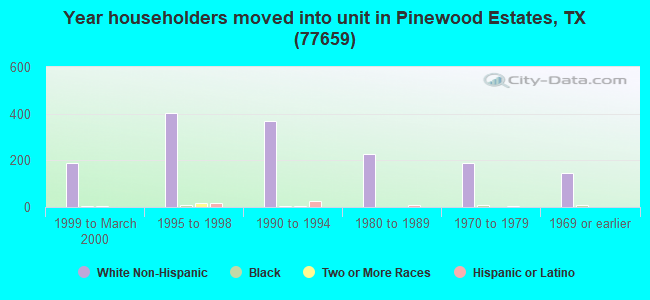
Length of stay since moving in above state average.
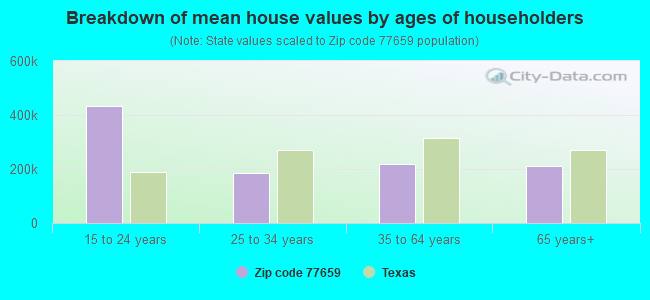
Estimated median house/condo value in 2022: $217,080
77659:
$217,080
Texas:
$275,400
According to our research of Texas and other state lists, there were 11 registered sex offenders living in 77659 zip code as of May 23, 2024. The ratio of all residents to sex offenders in zip code 77659 is 438 to 1. The ratio of registered sex offenders to all residents in this zip code is near the state average.
Median resident age:
This zip code:
33.9 years
Texas median age:
35.6 years
Average household size:
This zip code:
3.2 people
Texas:
2.6 people
Averages for the 2020 tax year for zip code 77659, filed in 2021:
Average Adjusted Gross Income (AGI) in 2020: $77,226 (Individual Income Tax Returns)
Here:
$77,226
State:
$77,054
Salary/wage: $67,504 (reported on 83.7% of returns)
Here:
$67,504
State:
$62,766
(% of AGI for various income ranges: 1253.9% for AGIs below $25k, 3239.2% for AGIs $25k-50k, 6437.9% for AGIs $50k-75k, 8398.4% for AGIs $75k-100k, 16934.4% for AGIs $100k-200k, 49710.0% for AGIs over 200k)
Taxable interest for individuals: $1,525 (reported on 33.9% of returns)
This zip code:
$1,525
Texas:
$2,665
(% of AGI for various income ranges: 14.5% for AGIs below $25k, 40.3% for AGIs $25k-50k, 27.1% for AGIs $50k-75k, 17.4% for AGIs $75k-100k, 86.2% for AGIs $100k-200k, 1168.0% for AGIs over 200k)
Ordinary dividends: $6,295 (reported on 16.3% of returns)
Here:
$6,295
State:
$10,044
(% of AGI for various income ranges: 23.9% for AGIs below $25k, 34.2% for AGIs $25k-50k, 94.2% for AGIs $50k-75k, 71.6% for AGIs $75k-100k, 160.0% for AGIs $100k-200k, 2430.0% for AGIs over 200k)
Net capital gain/loss in AGI: +$18,587 (reported on 16.7% of returns)
Here:
+$18,587
State:
+$39,590
(% of AGI for various income ranges: 24.9% for AGIs below $25k, 41.7% for AGIs $25k-50k, 77.5% for AGIs $50k-75k, 112.6% for AGIs $75k-100k, 322.2% for AGIs $100k-200k, 10720.0% for AGIs over 200k)
Profit/loss from business: +$6,453 (reported on 18.9% of returns)
Here:
+$6,453
State:
+$10,888
(% of AGI for various income ranges: 15.3% for AGIs below $25k, 162.5% for AGIs $25k-50k, 34.2% for AGIs $75k-100k, 348.1% for AGIs $100k-200k, 1976.0% for AGIs over 200k)
Taxable individual retirement arrangement distribution: $26,826 (reported on 10.1% of returns)
77659:
$26,826
Texas:
$24,740
(% of AGI for various income ranges: 65.1% for AGIs below $25k, 141.7% for AGIs $25k-50k, 323.8% for AGIs $50k-75k, 632.1% for AGIs $75k-100k, 1050.9% for AGIs $100k-200k)
Total itemized deductions: $42,178 (reported on 7.9% of returns)
Here:
$42,178
State:
$40,428
(% of AGI for various income ranges: 162.4% for AGIs below $25k, 440.4% for AGIs $50k-75k, 366.8% for AGIs $75k-100k, 666.2% for AGIs $100k-200k, 5820.0% for AGIs over 200k)
Charity contributions: $14,838 (reported on 5.7% of returns)
Here:
$14,838
State:
$18,201
(% of AGI for various income ranges: 56.1% for AGIs $25k-50k, 72.6% for AGIs $75k-100k, 117.2% for AGIs $100k-200k, 2428.0% for AGIs over 200k)
Taxes paid: $5,635 (reported on 7.5% of returns)
77659:
$5,635
State:
$7,821
(% of AGI for various income ranges: 13.1% for AGIs below $25k, 51.2% for AGIs $50k-75k, 68.4% for AGIs $75k-100k, 102.8% for AGIs $100k-200k, 624.0% for AGIs over 200k)
Earned income credit: $2,430 (reported on 14.5% of returns)
Here:
$2,430
State:
$2,584
(% of AGI for various income ranges: 100.8% for AGIs below $25k, 85.6% for AGIs $25k-50k)
Percentage of individuals using paid preparers for their 2020 taxes: 93.0%
Here:
93%
State:
92%
(% for various income ranges: 92.4% for AGIs below $25k, 91.1% for AGIs $25k-50k, 93.8% for AGIs $50k-75k, 95.8% for AGIs $75k-100k, 93.8% for AGIs $100k-200k, 91.7% for AGIs over 200k)
Averages for the 2012 tax year for zip code 77659, filed in 2013:
Average Adjusted Gross Income (AGI) in 2012: $75,740 (Individual Income Tax Returns)
Here:
$75,740
State:
$65,384
Salary/wage: $63,127 (reported on 84.1% of returns)
Here:
$63,127
State:
$52,524
(% of AGI for various income ranges: 68.7% for AGIs below $25k, 78.0% for AGIs $25k-50k, 81.5% for AGIs $50k-75k, 81.6% for AGIs $75k-100k, 82.8% for AGIs $100k-200k, 44.8% for AGIs over 200k)
Taxable interest for individuals: $2,015 (reported on 35.5% of returns)
This zip code:
$2,015
Texas:
$2,372
(% of AGI for various income ranges: 1.7% for AGIs below $25k, 0.8% for AGIs $25k-50k, 0.4% for AGIs $50k-75k, 0.5% for AGIs $75k-100k, 0.6% for AGIs $100k-200k, 1.7% for AGIs over 200k)
Ordinary dividends: $9,609 (reported on 20.0% of returns)
Here:
$9,609
State:
$9,721
(% of AGI for various income ranges: 3.0% for AGIs below $25k, 0.7% for AGIs $25k-50k, 1.1% for AGIs $50k-75k, 0.9% for AGIs $75k-100k, 0.8% for AGIs $100k-200k, 6.2% for AGIs over 200k)
Net capital gain/loss in AGI: +$12,977 (reported on 15.9% of returns)
Here:
+$12,977
State:
+$35,319
(% of AGI for various income ranges: 0.2% for AGIs $25k-50k, 0.5% for AGIs $75k-100k, 1.2% for AGIs $100k-200k, 7.8% for AGIs over 200k)
Profit/loss from business: +$15,079 (reported on 19.1% of returns)
Here:
+$15,079
State:
+$13,732
(% of AGI for various income ranges: 5.1% for AGIs below $25k, 2.9% for AGIs $25k-50k, 2.0% for AGIs $50k-75k, 2.3% for AGIs $75k-100k, 2.1% for AGIs $100k-200k, 7.0% for AGIs over 200k)
Taxable individual retirement arrangement distribution: $20,289 (reported on 12.3% of returns)
77659:
$20,289
Texas:
$19,511
(% of AGI for various income ranges: 4.2% for AGIs below $25k, 4.7% for AGIs $25k-50k, 3.9% for AGIs $50k-75k, 4.3% for AGIs $75k-100k, 3.5% for AGIs $100k-200k, 1.7% for AGIs over 200k)
Total itemized deductions: $24,160 (16% of AGI, reported on 27.3% of returns)
Here:
$24,160
State:
$24,724
Here:
16.0% of AGI
State:
15.9% of AGI
(% of AGI for various income ranges: 8.0% for AGIs below $25k, 7.9% for AGIs $25k-50k, 8.2% for AGIs $50k-75k, 10.4% for AGIs $75k-100k, 9.2% for AGIs $100k-200k, 7.9% for AGIs over 200k)
Charity contributions: $6,096 (reported on 22.3% of returns)
Here:
$6,096
State:
$6,808
(% of AGI for various income ranges: 0.8% for AGIs below $25k, 1.1% for AGIs $25k-50k, 1.4% for AGIs $50k-75k, 1.6% for AGIs $75k-100k, 1.8% for AGIs $100k-200k, 2.4% for AGIs over 200k)
Taxes paid: $5,712 (reported on 25.9% of returns)
77659:
$5,712
State:
$6,921
(% of AGI for various income ranges: 1.1% for AGIs below $25k, 1.1% for AGIs $25k-50k, 1.7% for AGIs $50k-75k, 2.2% for AGIs $75k-100k, 2.5% for AGIs $100k-200k, 1.9% for AGIs over 200k)
Earned income credit: $2,166 (reported on 14.5% of returns)
Here:
$2,166
State:
$2,570
(% of AGI for various income ranges: 6.0% for AGIs below $25k, 1.2% for AGIs $25k-50k)
Percentage of individuals using paid preparers for their 2012 taxes: 50.0%
Here:
50%
State:
51%
(% for various income ranges: 41.7% for AGIs below $25k, 50.0% for AGIs $25k-50k, 54.5% for AGIs $50k-75k, 53.6% for AGIs $75k-100k, 54.1% for AGIs $100k-200k, 70.0% for AGIs over 200k)
Averages for the 2004 tax year for zip code 77659, filed in 2005:
Average Adjusted Gross Income (AGI) in 2004: $49,429 (Individual Income Tax Returns)
Here:
$49,429
State:
$47,881
Salary/wage: $44,354 (reported on 85.3% of returns)
Here:
$44,354
State:
$41,947
(% of AGI for various income ranges: 97.8% for AGIs below $10k, 74.3% for AGIs $10k-25k, 80.5% for AGIs $25k-50k, 83.4% for AGIs $50k-75k, 85.4% for AGIs $75k-100k, 66.1% for AGIs over 100k)
Taxable interest for individuals: $1,853 (reported on 43.4% of returns)
This zip code:
$1,853
Texas:
$2,255
(% of AGI for various income ranges: 4.5% for AGIs below $10k, 1.9% for AGIs $10k-25k, 1.7% for AGIs $25k-50k, 1.2% for AGIs $50k-75k, 0.8% for AGIs $75k-100k, 2.0% for AGIs over 100k)
Taxable dividends: $2,198 (reported on 22.0% of returns)
Here:
$2,198
State:
$4,261
(% of AGI for various income ranges: 3.1% for AGIs below $10k, 1.1% for AGIs $10k-25k, 0.8% for AGIs $25k-50k, 0.6% for AGIs $50k-75k, 0.4% for AGIs $75k-100k, 1.4% for AGIs over 100k)
Net capital gain/loss: +$8,305 (reported on 18.1% of returns)
Here:
+$8,305
State:
+$16,110
(% of AGI for various income ranges: -1.0% for AGIs below $10k, -0.3% for AGIs $10k-25k, 0.3% for AGIs $25k-50k, 0.3% for AGIs $50k-75k, 0.4% for AGIs $75k-100k, 7.8% for AGIs over 100k)
Profit/loss from business: +$10,361 (reported on 18.1% of returns)
Here:
+$10,361
State:
+$11,013
(% of AGI for various income ranges: 13.1% for AGIs below $10k, 6.2% for AGIs $10k-25k, 3.2% for AGIs $25k-50k, 0.2% for AGIs $50k-75k, 4.6% for AGIs $75k-100k, 4.4% for AGIs over 100k)
IRA payment deduction: $3,976 (reported on 2.0% of returns)
77659:
$3,976
Texas:
$3,120
Total itemized deductions: $18,793 (20% of AGI, reported on 24.1% of returns)
Here:
$18,793
State:
$19,631
Here:
20.5% of AGI
State:
18.9% of AGI
(% of AGI for various income ranges: 7.4% for AGIs $10k-25k, 9.8% for AGIs $25k-50k, 10.0% for AGIs $50k-75k, 10.3% for AGIs $75k-100k, 8.6% for AGIs over 100k)
Charity contributions deductions: $4,615 (5% of AGI, reported on 20.7% of returns)
Here:
$4,615
State:
$4,753
Here:
4.7% of AGI
State:
4.2% of AGI
(% of AGI for various income ranges: 1.2% for AGIs $10k-25k, 1.6% for AGIs $25k-50k, 1.9% for AGIs $50k-75k, 1.9% for AGIs $75k-100k, 2.4% for AGIs over 100k)
Total tax: $7,840 (reported on 74.9% of returns)
77659:
$7,840
State:
$9,058
(% of AGI for various income ranges: 3.1% for AGIs below $10k, 4.0% for AGIs $10k-25k, 6.1% for AGIs $25k-50k, 8.0% for AGIs $50k-75k, 11.0% for AGIs $75k-100k, 18.7% for AGIs over 100k)
Earned income credit: $1,597 (reported on 14.7% of returns)
Here:
$1,597
State:
$2,024
Percentage of individuals using paid preparers for their 2004 taxes: 52.4%
Here:
52%
State:
57%
(% for various income ranges: 42.1% for AGIs below $10k, 56.6% for AGIs $10k-25k, 53.7% for AGIs $25k-50k, 57.8% for AGIs $50k-75k, 52.1% for AGIs $75k-100k, 57.6% for AGIs over 100k)
Household received Food Stamps/SNAP in the past 12 months: 307 Household did not receive Food Stamps/SNAP in the past 12 months: 1,725
Women who had a birth in the past 12 months: 63 (55 now married, 7 unmarried) Women who did not have a birth in the past 12 months: 1,414 (820 now married, 587 unmarried)
Housing units in zip code 77659 with a mortgage: 698 (16 second mortgage, 2 both second mortgage and home equity loan) Median monthly owner costs for units with a mortgage: $1,870 Median monthly owner costs for units without a mortgage: $580
Residents with income below the poverty level in 2022:
This zip code:
15.3%
Whole state:
14.0%
Residents with income below 50% of the poverty level in 2022:
This zip code:
11.3%
Whole state:
7.4%
Median number of rooms in houses and condos:
Here:
6.4
State:
6.3
Median number of rooms in apartments:
Here:
4.6
State:
4.0
Notable locations in this zip code not listed on our city pages
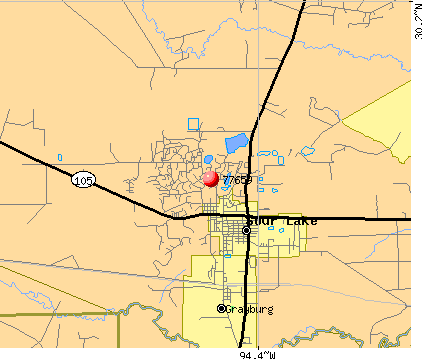
Notable locations in zip code 77659: Lost Dog Cabin (A), Taylor Camp (B), The Forks (C), Sour Lake Volunteer Fire Department / Hardin County Emergency Services District 5 (D), Pinewood Volunteer Fire Department (E), Sour Lake Police Department (F). Display/hide their locations on the map
Lakes, reservoirs, and swamps: The Sour Lakes (A), Fralise Pond (B), Grassy Lake (C), Bushy Lake (D), Jerome Slough (E). Display/hide their locations on the map
Streams, rivers, and creeks: Yearling Tick Branch (A), Six-Ten Slough (B), Mayhaw Creek (C), Jackson Creek (D), Little Pine Island Bayou (E). Display/hide their locations on the map
Size of family households: 463 2-persons, 245 3-persons, 640 4-persons, 200 5-persons, 52 6-persons, 29 7-or-more-persons
Size of nonfamily households: 354 1-person, 14 2-persons
1,502 married couples with children.
410 single-parent households (147 men, 263 women).
93.8% of residents of 77659 zip code speak English at home.
5.1% of residents speak Spanish at home (67% very well, 13% well, 20% not well).
0.7% of residents speak Asian or Pacific Island language at home (23% very well, 41% well, 25% not well, 11% not at all).
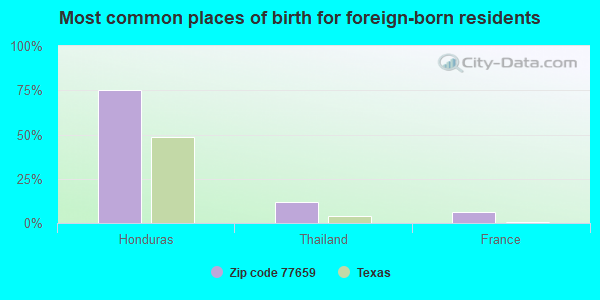
Foreign born population: 163 (2.5%) (37.0% of them are naturalized citizens)
This zip code:
2.5%
Whole state:
17.2%
75%Honduras
12%Thailand
6%France
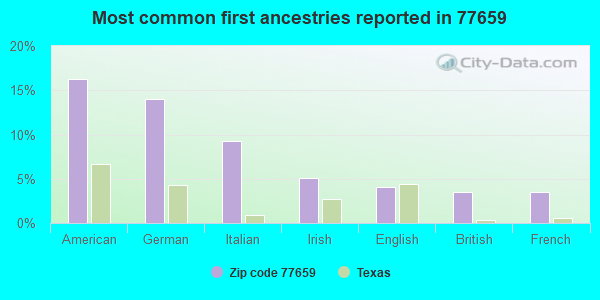
16%American
14%German
9%Italian
5%Irish
4%English
4%British
3%French
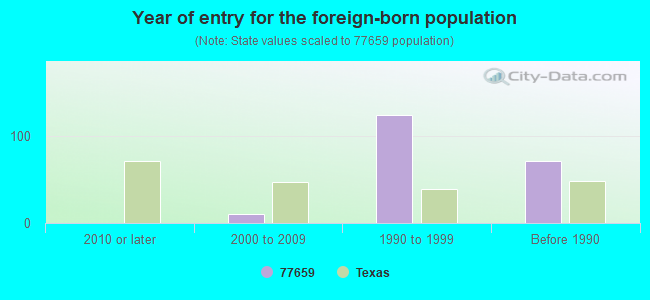
Year of entry for the foreign-born population
02010 or later
102000 to 2009
1241990 to 1999
71Before 1990
Facilities with environmental interests located in this zip code:
BAILEY LEASE RRC ID NO. 03936 - RADLEY ELECTRIC (145 W 6TH ST in SOUR LAKE, TX)
(Integrated Compliance Information System) - ICIS-06-2000-1004, FORMAL ENFORCEMENT ACTION, ICIS-06-2000-0923, (Integrated Compliance Information System) - ICIS-06-2000-0926, FORMAL ENFORCEMENT ACTION Business SIC classification: CRUDE PETROLEUM AND NATURAL GAS Alternative names: FITCHE, ASHE RRC ID NO. 03864, RRC ID NO. 03863
BAILEY LEASE, RRC 03936 (ON FANNIN 3/4M S OF HWY 105 in SOUR LAKE, TX)
(Integrated Compliance Information System) - ICIS-06-1997-0553, FORMAL ENFORCEMENT ACTION Business SIC classification: OIL AND GAS FIELD SERVICES; ELECTRICAL WORK; CONSTRUCTION AND MINING (EXCEPT PETROLEUM) MACHINERY AND EQUIPMENT
BALUFF AND MERCHANT 'A', RRC ID NO. 11110 (IN HARDIN COUNTY in SOUR LAKE, TX)
(Integrated Compliance Information System) - ICIS-06-2000-0925, FORMAL ENFORCEMENT ACTION Business SIC classification: CRUDE PETROLEUM AND NATURAL GAS
621 GRAYBURG STATION (16400 ATLANTIC RD in SOURLAKE, TX)
HAZARDOUS WASTE BIENNIAL REPORTER (Resource Conservation and Recovery Act (tracking hazardous waste)) Large Quantity Generators, more that 1000 kg of hazardous waste/month (Resource Conservation and Recovery Act (tracking hazardous waste)) Business NAICS classification: SUPPORT ACTIVITIES FOR OIL AND GAS OPERATIONS.
APAC - TEXAS, INCORPORATED (SH 326 & MISSOURI PACIFIC RAIL in SOUR LAKE, TX)
AIR MAJOR (AIRS/AFS) Business SIC classification: ASPHALT PAVING MIXTURES AND BLOCKS
Housing units lacking complete plumbing facilities: 2.3% Housing units lacking complete kitchen facilities: 4.4%
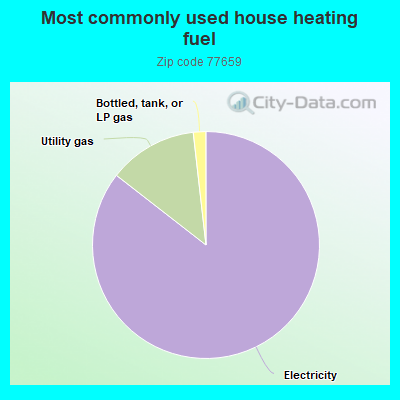
85.7%Electricity
12.7%Utility gas
1.8%Bottled, tank, or LP gas
Population in 1990: 4,138. Population change in the 1990s: +438 (+10.6%).
Place of birth for U.S.-born residents:
This state: 5,186
Northeast: 42
Midwest: 223
South: 469
West: 284
66% of the 77659 zip code residents lived in the same house 5 years ago. Out of people who lived in different houses, 43% lived in this county. Out of people who lived in different counties, 50% lived in Texas.
95% of the 77659 zip code residents lived in the same house 1 year ago. Out of people who lived in different houses, 13% moved from this county. Out of people who lived in different houses, 81% moved from different county within same state. Out of people who lived in different houses, 14% moved from different state.
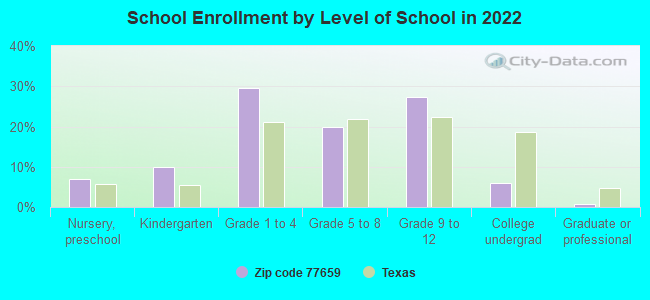
Private vs. public school enrollment:
Students in private schools in grades 1 to 8 (elementary and middle school): 106
Here:
10.8%
Texas:
8.8%
Students in private schools in grades 9 to 12 (high school): 144
Here:
26.2%
Texas:
8.0%
Students in private undergraduate colleges: 19
Here:
16.4%
Texas:
16.2%
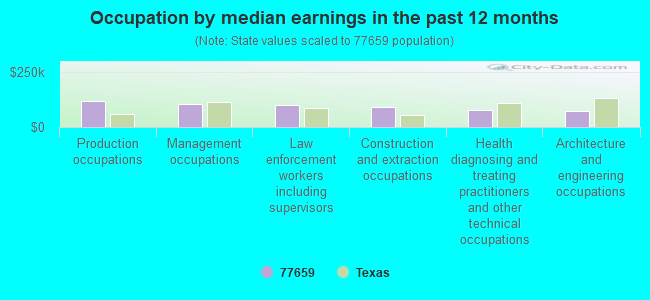
Occupation by median earnings in the past 12 months ($)
116,241Production occupations
102,504Management occupations
101,533Law enforcement workers including supervisors
89,328Construction and extraction occupations
75,938Health diagnosing and treating practitioners and other technical occupations
72,111Architecture and engineering occupations
Companies with federal contracts located in this zip code:
HARVEY, NORMA (365 MITCHELL in SOUR LAKE, TX) : $22,401 in 5 contractsfrom 2004 to 2005
Contracts for Recreation Site Maintenance Services (non-construction) by Army, U.S. Army Corps of Engineers - civil program financing only Signed by year:2000: $0; 2001: $0; 2002: $0; 2003: $0; 2004: $20,584; 2005: $1,817; 2006: $0.
Biggest contracts:
$18,600 with Army for Recreation Site Maintenance Services (non-construction). Signed on 2004-02-19. Completion date: 2004-02-05.
$1,966 with U.S. Army Corps of Engineers - civil program financing only for Recreation Site Maintenance Services (non-construction). Signed on 2004-12-16. Completion date: 2004-08-10.
$1,817, same as above.Signed on 2005-01-26. Completion date: 2004-08-10.
$9, same as above.Signed on 2004-11-05. Completion date: 2004-08-10.
Top industries in this zip code by the number of employees in 2005:
Arts, Entertainment, and Recreation: Golf Courses and Country Clubs (20-49 employees: 1 establishment)
Mining: Drilling Oil and Gas Wells (20-49: 1)
Other Services (except Public Administration): Religious Organizations (10-19: 1, 5-9: 2, 1-4: 1)
Mining: Support Activities for Oil and Gas Operations (10-19: 1, 5-9: 2)
Health Care and Social Assistance: Child Day Care Services (10-19: 1, 5-9: 1)
Construction: Site Preparation Contractors (10-19: 1, 1-4: 3)
Fatal accident statistics in 2012:
Fatal accident count: 1
Vehicles involved in fatal accidents: 1
Fatal accidents caused by drunken drivers: 0
Fatalities: 1
Persons involved in fatal accidents: 3
Pedestrians involved in fatal accidents: 1
Fatal accident statistics in 2011:
Fatal accident count: 2
Vehicles involved in fatal accidents: 3
Fatal accidents caused by drunken drivers: 1
Fatalities: 2
Persons involved in fatal accidents: 3
Pedestrians involved in fatal accidents: 0
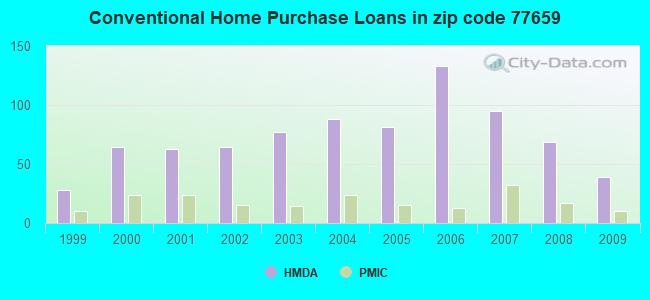
Home Mortgage Disclosure Act Aggregated Statistics For Year 2009 (Based on 2 partial tracts)
A) FHA, FSA/RHS & VA Home Purchase Loans
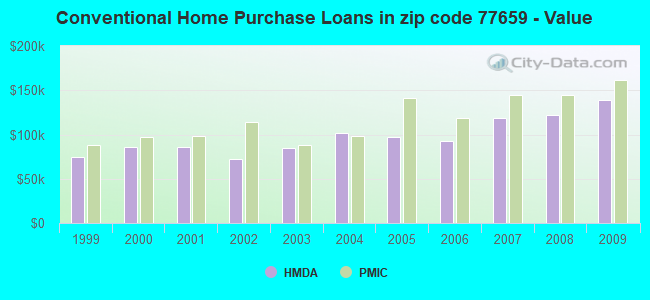
B) Conventional Home Purchase Loans
C) Refinancings
D) Home Improvement Loans
F) Non-occupant Loans on < 5 Family Dwellings (A B C & D)
G) Loans On Manufactured Home Dwelling (A B C & D)
Number
Average Value
Number
Average Value
Number
Average Value
Number
Average Value
Number
Average Value
Number
Average Value
LOANS ORIGINATED
31
$145,222
39
$139,474
59
$155,523
10
$54,437
1
$221,110
11
$50,124
APPLICATIONS APPROVED, NOT ACCEPTED
6
$81,865
13
$100,003
7
$185,320
8
$43,731
0
$0
8
$61,574
APPLICATIONS DENIED
7
$132,943
25
$101,484
25
$171,510
15
$47,300
1
$62,970
13
$45,965
APPLICATIONS WITHDRAWN
3
$146,937
3
$77,900
17
$127,839
1
$159,530
4
$75,918
0
$0
FILES CLOSED FOR INCOMPLETENESS
1
$187,520
4
$148,688
7
$151,336
0
$0
1
$183,320
0
$0
Aggregated Statistics For Year 2008 (Based on 2 partial tracts)
A) FHA, FSA/RHS & VA Home Purchase Loans
B) Conventional Home Purchase Loans
C) Refinancings
D) Home Improvement Loans
F) Non-occupant Loans on < 5 Family Dwellings (A B C & D)
G) Loans On Manufactured Home Dwelling (A B C & D)
Number
Average Value
Number
Average Value
Number
Average Value
Number
Average Value
Number
Average Value
Number
Average Value
LOANS ORIGINATED
15
$148,057
69
$121,565
56
$116,625
25
$37,056
3
$83,963
14
$45,980
APPLICATIONS APPROVED, NOT ACCEPTED
4
$120,698
14
$89,861
14
$123,147
1
$89,560
0
$0
11
$74,932
APPLICATIONS DENIED
6
$187,753
34
$97,217
45
$101,286
34
$34,656
4
$86,062
21
$52,977
APPLICATIONS WITHDRAWN
1
$96,560
4
$204,312
15
$128,092
4
$68,220
3
$62,973
3
$58,310
FILES CLOSED FOR INCOMPLETENESS
1
$159,530
4
$229,852
4
$128,745
0
$0
0
$0
0
$0
Aggregated Statistics For Year 2007 (Based on 2 partial tracts)
A) FHA, FSA/RHS & VA Home Purchase Loans
B) Conventional Home Purchase Loans
C) Refinancings
D) Home Improvement Loans
F) Non-occupant Loans on < 5 Family Dwellings (A B C & D)
G) Loans On Manufactured Home Dwelling (A B C & D)
Number
Average Value
Number
Average Value
Number
Average Value
Number
Average Value
Number
Average Value
Number
Average Value
LOANS ORIGINATED
4
$67,170
95
$118,728
38
$126,314
32
$51,253
3
$44,780
20
$50,938
APPLICATIONS APPROVED, NOT ACCEPTED
0
$0
15
$85,550
10
$89,981
6
$18,658
0
$0
13
$71,908
APPLICATIONS DENIED
0
$0
36
$64,644
71
$121,630
38
$57,154
1
$82,560
35
$41,542
APPLICATIONS WITHDRAWN
0
$0
6
$94,693
27
$113,921
1
$230,900
0
$0
3
$57,377
FILES CLOSED FOR INCOMPLETENESS
0
$0
7
$119,149
4
$143,438
3
$78,367
1
$69,970
0
$0
Aggregated Statistics For Year 2006 (Based on 2 partial tracts)
A) FHA, FSA/RHS & VA Home Purchase Loans
B) Conventional Home Purchase Loans
C) Refinancings
D) Home Improvement Loans
F) Non-occupant Loans on < 5 Family Dwellings (A B C & D)
G) Loans On Manufactured Home Dwelling (A B C & D)
Number
Average Value
Number
Average Value
Number
Average Value
Number
Average Value
Number
Average Value
Number
Average Value
LOANS ORIGINATED
10
$130,704
133
$92,865
49
$122,148
25
$40,079
14
$81,665
11
$37,021
APPLICATIONS APPROVED, NOT ACCEPTED
0
$0
20
$73,258
6
$93,760
7
$22,190
0
$0
8
$58,075
APPLICATIONS DENIED
1
$125,950
46
$79,705
43
$119,860
25
$47,636
3
$34,987
15
$44,035
APPLICATIONS WITHDRAWN
1
$72,770
8
$154,809
49
$113,237
6
$67,172
0
$0
0
$0
FILES CLOSED FOR INCOMPLETENESS
0
$0
6
$51,778
8
$139,590
0
$0
1
$55,980
0
$0
Aggregated Statistics For Year 2005 (Based on 2 partial tracts)
A) FHA, FSA/RHS & VA Home Purchase Loans
B) Conventional Home Purchase Loans
C) Refinancings
D) Home Improvement Loans
F) Non-occupant Loans on < 5 Family Dwellings (A B C & D)
G) Loans On Manufactured Home Dwelling (A B C & D)
Number
Average Value
Number
Average Value
Number
Average Value
Number
Average Value
Number
Average Value
Number
Average Value
LOANS ORIGINATED
10
$82,425
81
$96,887
63
$108,864
22
$47,580
4
$119,648
10
$39,043
APPLICATIONS APPROVED, NOT ACCEPTED
3
$76,967
22
$85,300
15
$82,658
6
$20,525
1
$16,790
7
$35,784
APPLICATIONS DENIED
1
$100,760
46
$47,488
52
$119,487
29
$47,290
0
$0
39
$44,853
APPLICATIONS WITHDRAWN
0
$0
10
$70,110
28
$153,184
10
$114,611
4
$79,065
0
$0
FILES CLOSED FOR INCOMPLETENESS
0
$0
11
$102,411
13
$112,490
4
$29,738
0
$0
0
$0
Aggregated Statistics For Year 2004 (Based on 2 partial tracts)
A) FHA, FSA/RHS & VA Home Purchase Loans
B) Conventional Home Purchase Loans
C) Refinancings
D) Home Improvement Loans
F) Non-occupant Loans on < 5 Family Dwellings (A B C & D)
G) Loans On Manufactured Home Dwelling (A B C & D)
Number
Average Value
Number
Average Value
Number
Average Value
Number
Average Value
Number
Average Value
Number
Average Value
LOANS ORIGINATED
8
$93,935
88
$102,236
101
$91,834
39
$32,437
13
$53,177
11
$52,923
APPLICATIONS APPROVED, NOT ACCEPTED
1
$145,540
18
$59,552
20
$95,229
4
$45,130
3
$48,980
7
$36,584
APPLICATIONS DENIED
1
$142,740
39
$70,472
52
$116,446
41
$24,097
8
$62,274
24
$44,081
APPLICATIONS WITHDRAWN
0
$0
8
$103,905
50
$92,053
7
$79,566
3
$86,763
0
$0
FILES CLOSED FOR INCOMPLETENESS
0
$0
4
$90,610
32
$120,392
6
$37,317
1
$90,960
0
$0
Aggregated Statistics For Year 2003 (Based on 2 partial tracts)
A) FHA, FSA/RHS & VA Home Purchase Loans
B) Conventional Home Purchase Loans
C) Refinancings
D) Home Improvement Loans
F) Non-occupant Loans on < 5 Family Dwellings (A B C & D)
Number
Average Value
Number
Average Value
Number
Average Value
Number
Average Value
Number
Average Value
LOANS ORIGINATED
15
$91,614
77
$84,473
178
$93,996
32
$32,448
3
$41,983
APPLICATIONS APPROVED, NOT ACCEPTED
1
$174,930
21
$61,507
27
$107,754
4
$54,228
3
$87,230
APPLICATIONS DENIED
7
$106,354
46
$46,697
122
$97,591
22
$22,709
4
$58,775
APPLICATIONS WITHDRAWN
3
$105,887
0
$0
45
$86,452
7
$22,990
0
$0
FILES CLOSED FOR INCOMPLETENESS
0
$0
1
$104,960
8
$69,970
0
$0
1
$104,960
Aggregated Statistics For Year 2002 (Based on 2 partial tracts)
A) FHA, FSA/RHS & VA Home Purchase Loans
B) Conventional Home Purchase Loans
C) Refinancings
D) Home Improvement Loans
F) Non-occupant Loans on < 5 Family Dwellings (A B C & D)
Number
Average Value
Number
Average Value
Number
Average Value
Number
Average Value
Number
Average Value
LOANS ORIGINATED
15
$78,833
64
$72,528
91
$102,664
20
$24,280
6
$81,165
APPLICATIONS APPROVED, NOT ACCEPTED
0
$0
27
$42,137
15
$69,503
6
$28,222
1
$39,180
APPLICATIONS DENIED
1
$36,380
50
$46,236
70
$64,352
18
$14,072
3
$36,383
APPLICATIONS WITHDRAWN
0
$0
4
$87,462
24
$87,579
0
$0
0
$0
FILES CLOSED FOR INCOMPLETENESS
1
$103,560
4
$97,958
11
$63,100
0
$0
0
$0
Aggregated Statistics For Year 2001 (Based on 2 partial tracts)
A) FHA, FSA/RHS & VA Home Purchase Loans
B) Conventional Home Purchase Loans
C) Refinancings
D) Home Improvement Loans
F) Non-occupant Loans on < 5 Family Dwellings (A B C & D)
Number
Average Value
Number
Average Value
Number
Average Value
Number
Average Value
Number
Average Value
LOANS ORIGINATED
3
$101,690
63
$85,985
78
$90,728
15
$19,591
4
$95,160
APPLICATIONS APPROVED, NOT ACCEPTED
0
$0
13
$73,199
13
$88,485
1
$53,180
0
$0
APPLICATIONS DENIED
1
$209,910
32
$46,005
28
$63,023
7
$11,794
1
$40,580
APPLICATIONS WITHDRAWN
0
$0
6
$67,638
24
$81,865
0
$0
1
$44,780
FILES CLOSED FOR INCOMPLETENESS
0
$0
1
$146,940
6
$56,442
0
$0
0
$0
Aggregated Statistics For Year 2000 (Based on 2 partial tracts)
A) FHA, FSA/RHS & VA Home Purchase Loans
B) Conventional Home Purchase Loans
C) Refinancings
D) Home Improvement Loans
F) Non-occupant Loans on < 5 Family Dwellings (A B C & D)
Number
Average Value
Number
Average Value
Number
Average Value
Number
Average Value
Number
Average Value
LOANS ORIGINATED
8
$80,116
64
$86,369
31
$94,888
22
$18,574
4
$72,770
APPLICATIONS APPROVED, NOT ACCEPTED
1
$48,980
8
$47,055
7
$107,554
3
$11,197
3
$22,857
APPLICATIONS DENIED
0
$0
46
$42,651
10
$54,717
17
$10,866
3
$41,517
APPLICATIONS WITHDRAWN
0
$0
6
$82,098
14
$49,779
0
$0
0
$0
FILES CLOSED FOR INCOMPLETENESS
0
$0
6
$37,317
1
$251,890
1
$23,790
0
$0
Aggregated Statistics For Year 1999 (Based on 1 partial tract)
A) FHA, FSA/RHS & VA Home Purchase Loans
B) Conventional Home Purchase Loans
C) Refinancings
D) Home Improvement Loans
F) Non-occupant Loans on < 5 Family Dwellings (A B C & D)
Detailed PMIC statistics for the following Tracts:0302.00
2002 - 2018 National Fire Incident Reporting System (NFIRS) incidents
According to the data from the years 2002 - 2018 the average number of fire incidents per year is 22. The highest number of reported fire incidents - 49 took place in 2011, and the least - 1 in 2017. The data has a rising trend.
When looking into fire subcategories, the most incidents belonged to: Outside Fires (56.9%), and Structure Fires (27.5%).
Fire incident types reported to NFIRS in Zip Code 77659


 Nearest zip codes: 77613, 77585, 77519, 77533, 77629, 77713.


 According to the data from the years 2002 - 2018 the average number of fire incidents per year is 22. The highest number of reported fire incidents - 49 took place in 2011, and the least - 1 in 2017. The data has a rising trend.
 When looking into fire subcategories, the most incidents belonged to: Outside Fires (56.9%), and Structure Fires (27.5%).