Estimated zip code population in 2022: 2,890 Zip code population in 2010: 2,534 Zip code population in 2000: 2,290
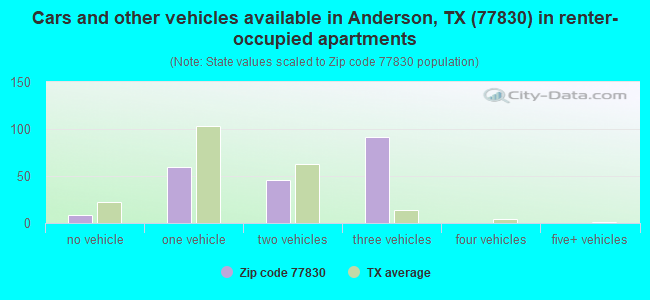
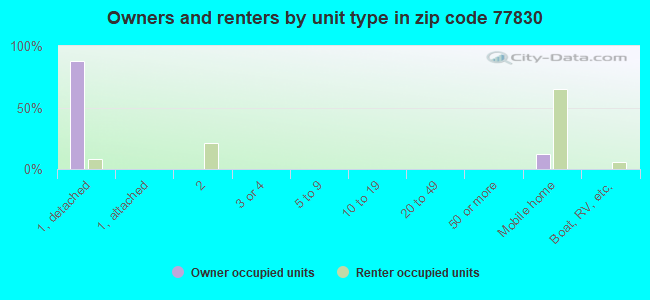
Houses and condos: 1,316 Renter-occupied apartments: 210
% of renters here:
18%
State:
38%
March 2022 cost of living index in zip code 77830: 80.1 (low, U.S. average is 100)
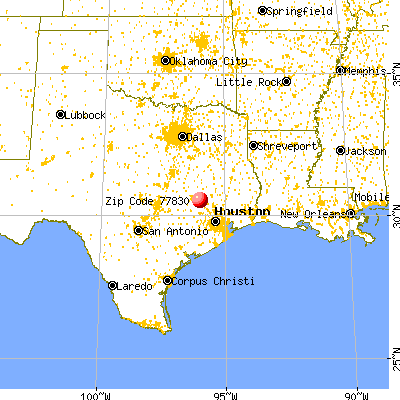
Land area: 188.6 sq. mi. Water area: 4.9 sq. mi.
Population density: 15 people per square mile
(very low).
OSM Map
General Map
Google Map
MSN Map
OSM Map
General Map
Google Map
MSN Map
OSM Map
General Map
Google Map
MSN Map
OSM Map
General Map
Google Map
MSN Map
Please wait while loading the map...
Real estate property taxes paid for housing units in 2022:
This zip code:
1.1% ($3,728)
Texas:
1.5% ($4,050)
Median real estate property taxes paid for housing units with mortgages in 2022: $4,884 (1.2%) Median real estate property taxes paid for housing units with no mortgage in 2022: $3,287 (1.0%)
Business Search- 14 Million verified businesses
Males: 1,407
(48.7%)
Females: 1,483
(51.3%)
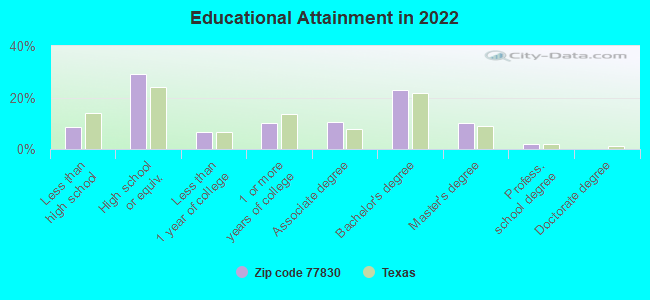
For population 25 years and over in 77830:
High school or higher: 92.0%
Bachelor's degree or higher: 35.4%
Graduate or professional degree: 12.3%
Unemployed: 1.2%
Mean travel time to work (commute): 33.4 minutes
For population 15 years and over in 77830:
Never married: 31.4%
Now married: 58.3%
Separated: 0.2%
Widowed: 3.0%
Divorced: 7.1%
Zip code 77830 compared to state average:
Unemployed percentage significantly below state average.
Black race population percentage significantly below state average.
Hispanic race population percentage significantly below state average.
Median age above state average.
Foreign-born population percentage significantly below state average.
Renting percentage below state average.
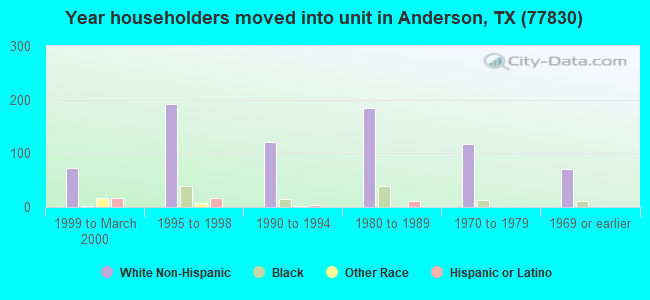
Length of stay since moving in significantly above state average.
Estimated median house/condo value in 2022: $352,234
77830:
$352,234
Texas:
$275,400
According to our research of Texas and other state lists, there were 5 registered sex offenders living in 77830 zip code as of May 23, 2024. The ratio of all residents to sex offenders in zip code 77830 is 596 to 1. The ratio of registered sex offenders to all residents in this zip code is lower than the state average.
Median resident age:
This zip code:
41.4 years
Texas median age:
35.6 years
Average household size:
This zip code:
2.5 people
Texas:
2.6 people
Averages for the 2020 tax year for zip code 77830, filed in 2021:
Average Adjusted Gross Income (AGI) in 2020: $76,033 (Individual Income Tax Returns)
Here:
$76,033
State:
$77,054
Salary/wage: $62,584 (reported on 77.3% of returns)
Here:
$62,584
State:
$62,766
(% of AGI for various income ranges: 1201.6% for AGIs below $25k, 3610.8% for AGIs $25k-50k, 6885.3% for AGIs $50k-75k, 8929.1% for AGIs $75k-100k, 15836.0% for AGIs $100k-200k, 54343.3% for AGIs over 200k)
Taxable interest for individuals: $1,483 (reported on 36.0% of returns)
This zip code:
$1,483
Texas:
$2,665
(% of AGI for various income ranges: 26.1% for AGIs below $25k, 32.1% for AGIs $25k-50k, 140.7% for AGIs $50k-75k, 73.6% for AGIs $75k-100k, 95.3% for AGIs $100k-200k, 693.3% for AGIs over 200k)
Ordinary dividends: $7,815 (reported on 17.3% of returns)
Here:
$7,815
State:
$10,044
(% of AGI for various income ranges: 20.6% for AGIs below $25k, 37.9% for AGIs $25k-50k, 97.3% for AGIs $50k-75k, 98.2% for AGIs $75k-100k, 165.3% for AGIs $100k-200k, 4583.3% for AGIs over 200k)
Net capital gain/loss in AGI: +$51,096 (reported on 16.7% of returns)
Here:
+$51,096
State:
+$39,590
(% of AGI for various income ranges: 6.5% for AGIs below $25k, 55.8% for AGIs $25k-50k, 82.7% for AGIs $50k-75k, 160.0% for AGIs $75k-100k, 613.3% for AGIs $100k-200k, 38000.0% for AGIs over 200k)
Profit/loss from business: +$6,853 (reported on 22.7% of returns)
Here:
+$6,853
State:
+$10,888
(% of AGI for various income ranges: 133.2% for AGIs below $25k, 185.4% for AGIs $25k-50k, 162.0% for AGIs $50k-75k, 380.9% for AGIs $75k-100k, 346.0% for AGIs $100k-200k, 970.0% for AGIs over 200k)
Taxable individual retirement arrangement distribution: $31,688 (reported on 11.3% of returns)
77830:
$31,688
Texas:
$24,740
(% of AGI for various income ranges: 57.4% for AGIs below $25k, 162.1% for AGIs $25k-50k, 260.0% for AGIs $50k-75k, 769.1% for AGIs $75k-100k, 1295.3% for AGIs $100k-200k, 5470.0% for AGIs over 200k)
Total itemized deductions: $38,850 (reported on 6.7% of returns)
Here:
$38,850
State:
$40,428
(% of AGI for various income ranges: 804.0% for AGIs $50k-75k, 642.0% for AGIs $100k-200k, 5720.0% for AGIs over 200k)
Charity contributions: $9,457 (reported on 4.7% of returns)
Here:
$9,457
State:
$18,201
(% of AGI for various income ranges: 241.8% for AGIs $75k-100k, 1320.0% for AGIs over 200k)
Taxes paid: $7,510 (reported on 6.7% of returns)
77830:
$7,510
State:
$7,821
(% of AGI for various income ranges: 152.7% for AGIs $50k-75k, 119.3% for AGIs $100k-200k, 1143.3% for AGIs over 200k)
Earned income credit: $2,150 (reported on 13.3% of returns)
Here:
$2,150
State:
$2,584
(% of AGI for various income ranges: 87.1% for AGIs below $25k, 66.7% for AGIs $25k-50k)
Percentage of individuals using paid preparers for their 2020 taxes: 90.0%
Here:
90%
State:
92%
(% for various income ranges: 87.5% for AGIs below $25k, 90.3% for AGIs $25k-50k, 91.3% for AGIs $50k-75k, 93.3% for AGIs $75k-100k, 87.5% for AGIs $100k-200k, 100.0% for AGIs over 200k)
Averages for the 2012 tax year for zip code 77830, filed in 2013:
Average Adjusted Gross Income (AGI) in 2012: $57,985 (Individual Income Tax Returns)
Here:
$57,985
State:
$65,384
Salary/wage: $50,395 (reported on 82.3% of returns)
Here:
$50,395
State:
$52,524
(% of AGI for various income ranges: 76.7% for AGIs below $25k, 82.3% for AGIs $25k-50k, 73.3% for AGIs $50k-75k, 80.9% for AGIs $75k-100k, 75.9% for AGIs $100k-200k, 46.4% for AGIs over 200k)
Taxable interest for individuals: $1,920 (reported on 36.3% of returns)
This zip code:
$1,920
Texas:
$2,372
(% of AGI for various income ranges: 2.1% for AGIs below $25k, 0.8% for AGIs $25k-50k, 3.9% for AGIs $50k-75k, 0.8% for AGIs $75k-100k, 0.4% for AGIs $100k-200k, 0.7% for AGIs over 200k)
Ordinary dividends: $4,795 (reported on 16.9% of returns)
Here:
$4,795
State:
$9,721
(% of AGI for various income ranges: 1.7% for AGIs below $25k, 1.3% for AGIs $25k-50k, 0.6% for AGIs $50k-75k, 0.1% for AGIs $75k-100k, 1.4% for AGIs $100k-200k, 3.0% for AGIs over 200k)
Net capital gain/loss in AGI: +$11,511 (reported on 15.3% of returns)
Here:
+$11,511
State:
+$35,319
(% of AGI for various income ranges: 0.2% for AGIs below $25k, 1.4% for AGIs $25k-50k, 0.8% for AGIs $50k-75k, 4.8% for AGIs $100k-200k, 7.2% for AGIs over 200k)
Profit/loss from business: +$10,979 (reported on 19.4% of returns)
Here:
+$10,979
State:
+$13,732
(% of AGI for various income ranges: 5.1% for AGIs below $25k, 3.5% for AGIs $25k-50k, 3.9% for AGIs $50k-75k, 2.3% for AGIs $75k-100k, 6.8% for AGIs $100k-200k)
Taxable individual retirement arrangement distribution: $17,500 (reported on 10.5% of returns)
77830:
$17,500
Texas:
$19,511
(% of AGI for various income ranges: 2.1% for AGIs below $25k, 2.6% for AGIs $25k-50k, 2.1% for AGIs $50k-75k, 4.2% for AGIs $75k-100k, 6.2% for AGIs $100k-200k)
Total itemized deductions: $19,984 (17% of AGI, reported on 20.2% of returns)
Here:
$19,984
State:
$24,724
Here:
16.9% of AGI
State:
15.9% of AGI
(% of AGI for various income ranges: 5.2% for AGIs below $25k, 5.5% for AGIs $25k-50k, 8.2% for AGIs $50k-75k, 6.5% for AGIs $75k-100k, 7.8% for AGIs $100k-200k, 7.1% for AGIs over 200k)
Charity contributions: $4,111 (reported on 14.5% of returns)
Here:
$4,111
State:
$6,808
(% of AGI for various income ranges: 1.1% for AGIs $25k-50k, 0.8% for AGIs $50k-75k, 1.2% for AGIs $75k-100k, 1.2% for AGIs $100k-200k, 1.2% for AGIs over 200k)
Taxes paid: $4,750 (reported on 19.4% of returns)
77830:
$4,750
State:
$6,921
(% of AGI for various income ranges: 0.8% for AGIs below $25k, 1.0% for AGIs $25k-50k, 1.6% for AGIs $50k-75k, 1.5% for AGIs $75k-100k, 2.1% for AGIs $100k-200k, 1.7% for AGIs over 200k)
Earned income credit: $2,090 (reported on 16.9% of returns)
Here:
$2,090
State:
$2,570
(% of AGI for various income ranges: 5.5% for AGIs below $25k, 1.1% for AGIs $25k-50k)
Percentage of individuals using paid preparers for their 2012 taxes: 58.9%
Here:
59%
State:
51%
(% for various income ranges: 56.5% for AGIs below $25k, 54.8% for AGIs $25k-50k, 52.9% for AGIs $50k-75k, 61.5% for AGIs $75k-100k, 71.4% for AGIs $100k-200k, 100.0% for AGIs over 200k)
Averages for the 2004 tax year for zip code 77830, filed in 2005:
Average Adjusted Gross Income (AGI) in 2004: $42,818 (Individual Income Tax Returns)
Here:
$42,818
State:
$47,881
Salary/wage: $33,215 (reported on 76.8% of returns)
Here:
$33,215
State:
$41,947
(% of AGI for various income ranges: 105.1% for AGIs below $10k, 77.5% for AGIs $10k-25k, 82.7% for AGIs $25k-50k, 76.3% for AGIs $50k-75k, 74.0% for AGIs $75k-100k, 25.8% for AGIs over 100k)
Taxable interest for individuals: $3,314 (reported on 41.5% of returns)
This zip code:
$3,314
Texas:
$2,255
(% of AGI for various income ranges: 11.5% for AGIs below $10k, 2.7% for AGIs $10k-25k, 0.9% for AGIs $25k-50k, 2.7% for AGIs $50k-75k, 1.3% for AGIs $75k-100k, 5.2% for AGIs over 100k)
Taxable dividends: $4,601 (reported on 18.1% of returns)
Here:
$4,601
State:
$4,261
(% of AGI for various income ranges: 5.4% for AGIs below $10k, 2.0% for AGIs $10k-25k, 1.2% for AGIs $25k-50k, 0.3% for AGIs $50k-75k, 0.6% for AGIs $75k-100k, 3.5% for AGIs over 100k)
Net capital gain/loss: +$11,039 (reported on 19.4% of returns)
Here:
+$11,039
State:
+$16,110
(% of AGI for various income ranges: -1.3% for AGIs below $10k, 0.7% for AGIs $10k-25k, 0.5% for AGIs $25k-50k, 1.1% for AGIs $50k-75k, 0.5% for AGIs $75k-100k, 12.6% for AGIs over 100k)
Profit/loss from business: +$8,982 (reported on 20.5% of returns)
Here:
+$8,982
State:
+$11,013
(% of AGI for various income ranges: 14.2% for AGIs below $10k, 6.7% for AGIs $10k-25k, 1.7% for AGIs $25k-50k, 2.8% for AGIs $50k-75k, 3.9% for AGIs $75k-100k, 5.5% for AGIs over 100k)
IRA payment deduction: $2,333 (reported on 1.7% of returns)
77830:
$2,333
Texas:
$3,120
Total itemized deductions: $17,245 (24% of AGI, reported on 17.3% of returns)
Here:
$17,245
State:
$19,631
Here:
23.9% of AGI
State:
18.9% of AGI
(% of AGI for various income ranges: 30.9% for AGIs below $10k, 8.5% for AGIs $10k-25k, 7.0% for AGIs $25k-50k, 5.7% for AGIs $50k-75k, 7.9% for AGIs $75k-100k, 5.6% for AGIs over 100k)
Charity contributions deductions: $3,013 (4% of AGI, reported on 14.1% of returns)
Here:
$3,013
State:
$4,753
Here:
3.9% of AGI
State:
4.2% of AGI
(% of AGI for various income ranges: 1.0% for AGIs $10k-25k, 1.1% for AGIs $25k-50k, 0.8% for AGIs $50k-75k, 1.4% for AGIs $75k-100k, 0.9% for AGIs over 100k)
Total tax: $5,736 (reported on 72.8% of returns)
77830:
$5,736
State:
$9,058
(% of AGI for various income ranges: 5.4% for AGIs below $10k, 4.0% for AGIs $10k-25k, 6.4% for AGIs $25k-50k, 9.1% for AGIs $50k-75k, 11.5% for AGIs $75k-100k, 13.1% for AGIs over 100k)
Earned income credit: $1,791 (reported on 17.1% of returns)
Here:
$1,791
State:
$2,024
Percentage of individuals using paid preparers for their 2004 taxes: 65.6%
Here:
66%
State:
57%
(% for various income ranges: 59.7% for AGIs below $10k, 63.0% for AGIs $10k-25k, 66.5% for AGIs $25k-50k, 64.5% for AGIs $50k-75k, 82.4% for AGIs $75k-100k, 79.4% for AGIs over 100k)
Household received Food Stamps/SNAP in the past 12 months: 65 Household did not receive Food Stamps/SNAP in the past 12 months: 1,084
Women who had a birth in the past 12 months: 24 (17 now married, 6 unmarried) Women who did not have a birth in the past 12 months: 703 (354 now married, 347 unmarried)
Housing units in zip code 77830 with a mortgage: 277 (3 second mortgage, 4 both second mortgage and home equity loan) Houses without a mortgage: 15
Median monthly owner costs for units with a mortgage: $2,061 Median monthly owner costs for units without a mortgage: $665
Residents with income below the poverty level in 2022:
This zip code:
5.8%
Whole state:
14.0%
Residents with income below 50% of the poverty level in 2022:
This zip code:
2.9%
Whole state:
7.4%
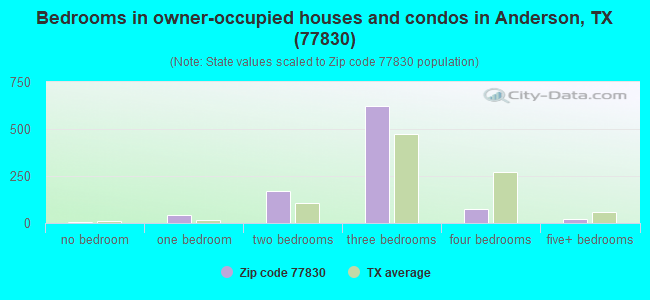
Median number of rooms in houses and condos:
Here:
5.8
State:
6.3
Median number of rooms in apartments:
Here:
3.9
State:
4.0
Notable locations in this zip code not listed on our city pages
Churches in zip code 77830 include: Anderson Grove Church (A), Arbor Chapel (B), Bethlehem Church (C), Blue Lake Church (D), Saint Stanislaus Church (E), Robinson Hill Church (F). Display/hide their locations on the map
Cemeteries: Berryman Cemetery (1), Mason Cemetery (2), Allen Cemetery (3), Erwin Cemetery (4), Little Flock Cemetery (5), Pine Grove Cemetery (6), Kennard Cemetery (7). Display/hide their locations on the map
Lakes and reservoirs: Blue Lake (A), Hideaway Lake (B), Moody Lake (C), Farm Lake (D), Waltrip Lake (E), Wichman Lake (F), Carlos Lake (G), Gibbons Creek Reservoir (H). Display/hide their locations on the map
Streams, rivers, and creeks: Big Branch (A), Alum Creek (B), Geter Creek (C), Spring Branch (D), Sulphur Branch (E), Sulphur Creek (F), Tanyard Branch (G), Thomas Creek (H), Turkey Creek (I). Display/hide their locations on the map
In group quarters: 10 (-1 institutionalized population)
Size of family households: 376 2-persons, 234 3-persons, 153 4-persons, 43 5-persons, 1 6-persons
Size of nonfamily households: 211 1-person, 35 2-persons, 92 3-persons
405 married couples with children.
259 single-parent households (256 men, 3 women).
92.5% of residents of 77830 zip code speak English at home.
4.8% of residents speak Spanish at home (76% very well, 24% not well).
2.6% of residents speak other Indo-European language at home (60% very well, 40% well).
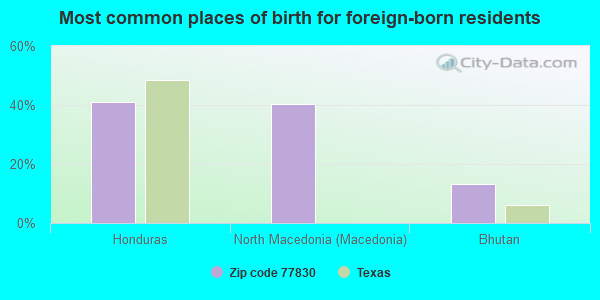
Foreign born population: 131 (4.5%) (55.4% of them are naturalized citizens)
This zip code:
4.5%
Whole state:
17.2%
41%Honduras
40%North Macedonia (Macedonia)
13%Bhutan
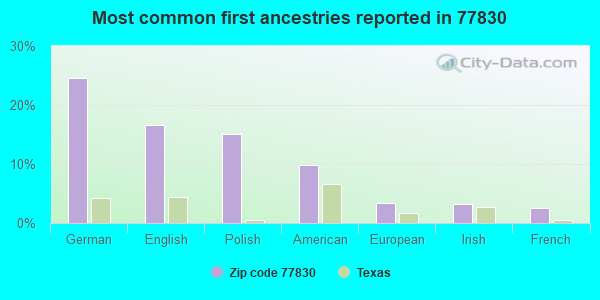
25%German
17%English
15%Polish
10%American
3%European
3%Irish
3%French
Year of entry for the foreign-born population
02010 or later
482000 to 2009
231990 to 1999
47Before 1990
Facilities with environmental interests located in this zip code:
ANDERSON-SHIRO ELEMENTARY (1139 HWY 90 N in ANDERSON, TX)
(National Center for Education Statistics) - STATE ID-093901101 Organizations: ANDERSON-SHIRO CONS (SCHOOL DISTRICT)
ANDERSON-SHIRO JR/SR HIGH SCHO (1139 HWY 90 N in ANDERSON, TX)
(National Center for Education Statistics) - STATE ID-093901001 Organizations: ANDERSON-SHIRO CONS ISD (SCHOOL DISTRICT)
ANDERSON GAS TREATING FACILITY (FM 1774, APPROX. 5 MILE SOUTH OF ANDERSON in ANDERSON, TX)
(Integrated Compliance Information System) - ICIS-06-2002-1838, FORMAL ENFORCEMENT ACTION, Business SIC classification: CRUDE PETROLEUM AND NATURAL GAS
ANDERSON PIPELINE CONST PROJECT (NEAR TOWN OF ANDERSON in ANDERSON, TX)
(Integrated Compliance Information System) - ICIS-06-1996-0260, FORMAL ENFORCEMENT ACTION Business SIC classification: NATURAL GAS DISTRIBUTION
ANDERSON TREATING FACILITY (F.M. 1774 5 MI. S. OF ANDERSON in ANDERSON, TX)
AIR MAJOR (AIRS/AFS) CRITERIA AND HAZARDOUS AIR POLLUTANT INVENTORY (Inventory of air pollution sources) Business SIC classification: CRUDE PETROLEUM AND NATURAL GAS Alternative names: MITCHELL GAS SERVICES, L.P., SOUTHWEST GAS PIPELINE INC.
Housing units lacking complete plumbing facilities: 8.4% Housing units lacking complete kitchen facilities: 5.4%
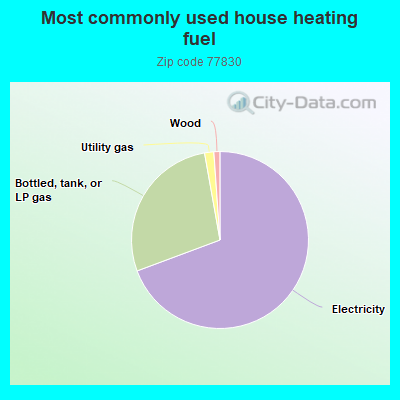
69.4%Electricity
27.9%Bottled, tank, or LP gas
1.7%Utility gas
1.1%Wood
Population in 1990: 1,792. Population change in the 1990s: +498 (+27.8%).
Place of birth for U.S.-born residents:
This state: 2,368
Northeast: 35
Midwest: 113
South: 169
West: 48
68% of the 77830 zip code residents lived in the same house 5 years ago. Out of people who lived in different houses, 45% lived in this county. Out of people who lived in different counties, 50% lived in Texas.
97% of the 77830 zip code residents lived in the same house 1 year ago. Out of people who lived in different houses, 2% moved from this county. Out of people who lived in different houses, 106% moved from different county within same state. Out of people who lived in different houses, 7% moved from different state.
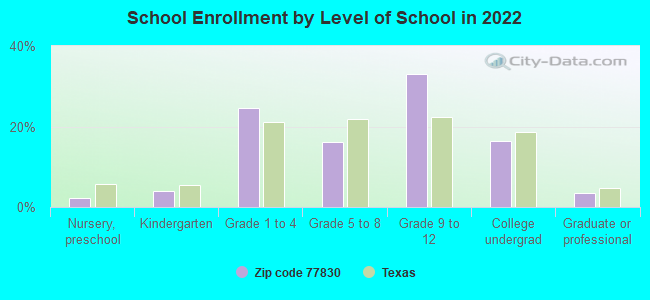
Private vs. public school enrollment:
Students in private schools in grades 1 to 8 (elementary and middle school): 25
Here:
9.0%
Texas:
8.8%
Students in private schools in grades 9 to 12 (high school): 97
Here:
41.1%
Texas:
8.0%
Students in private undergraduate colleges:
Here:
0.0%
Texas:
16.2%
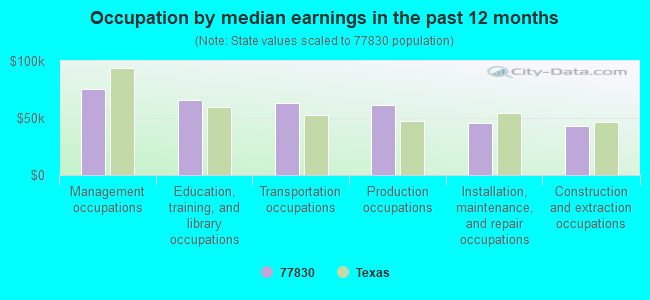
Occupation by median earnings in the past 12 months ($)
75,174Management occupations
65,997Education, training, and library occupations
63,319Transportation occupations
61,288Production occupations
46,031Installation, maintenance, and repair occupations
43,420Construction and extraction occupations
Top industries in this zip code by the number of employees in 2005:
Finance and Insurance: Commercial Banking (20-49 employees: 1 establishment)
Other Services (except Public Administration): Business Associations (10-19: 1)
Accommodation and Food Services: Hotels (except Casino Hotels) and Motels (10-19: 1)
Other Services (except Public Administration): Other Automotive Mechanical and Electrical Repair and Maintenance (10-19: 1)
Professional, Scientific, and Technical Services: Environmental Consulting Services (10-19: 1)
Accommodation and Food Services: Drinking Places (Alcoholic Beverages) (10-19: 1)
Construction: New Single-Family Housing Construction (except Operative Builders) (5-9: 1, 1-4: 3)
Utilities: Water Supply and Irrigation Systems (5-9: 1)
People in group quarters in 2000:
41 people in local jails and other confinement facilities (including police lockups)
Fatal accident statistics in 2014:
Fatal accident count: 1
Vehicles involved in fatal accidents: 2
Fatal accidents caused by drunken drivers: 0
Fatalities: 1
Persons involved in fatal accidents: 2
Pedestrians involved in fatal accidents: 0
Fatal accident statistics in 2013:
Fatal accident count: 5
Vehicles involved in fatal accidents: 8
Fatal accidents caused by drunken drivers: 2
Fatalities: 5
Persons involved in fatal accidents: 8
Pedestrians involved in fatal accidents: 0
2002 - 2018 National Fire Incident Reporting System (NFIRS) incidents
According to the data from the years 2002 - 2018 the average number of fire incidents per year is 15. The highest number of fires - 60 took place in 2005, and the least - 1 in 2002. The data has a growing trend.
When looking into fire subcategories, the most reports belonged to: Outside Fires (74.3%), and Structure Fires (19.5%).
Fire incident types reported to NFIRS in Zip Code 77830


 Nearest zip codes: 77876, 77868, 77873, 77861, 77831, 77845.


 According to the data from the years 2002 - 2018 the average number of fire incidents per year is 15. The highest number of fires - 60 took place in 2005, and the least - 1 in 2002. The data has a growing trend.
 When looking into fire subcategories, the most reports belonged to: Outside Fires (74.3%), and Structure Fires (19.5%).