Estimated zip code population in 2022: 1,687 Zip code population in 2010: 1,860 Zip code population in 2000: 1,863
Houses and condos: 1,056 Renter-occupied apartments: 218
% of renters here:
29%
State:
38%
March 2022 cost of living index in zip code 77975: 80.0 (low, U.S. average is 100)
Land area: 79.4 sq. mi. Water area: 0.1 sq. mi.
Population density: 21 people per square mile
(very low).
OSM Map
General Map
Google Map
MSN Map
OSM Map
General Map
Google Map
MSN Map
OSM Map
General Map
Google Map
MSN Map
OSM Map
General Map
Google Map
MSN Map
Please wait while loading the map...
Real estate property taxes paid for housing units in 2022:
This zip code:
0.8% ($1,635)
Texas:
1.5% ($4,050)
Median real estate property taxes paid for housing units with mortgages in 2022: $1,943 (1.1%) Median real estate property taxes paid for housing units with no mortgage in 2022: $1,572 (0.8%)
Estimated median house/condo value in 2022: $196,830
77975:
$196,830
Texas:
$275,400
According to our research of Texas and other state lists, there were 4 registered sex offenders living in 77975 zip code as of May 30, 2024. The ratio of all residents to sex offenders in zip code 77975 is 488 to 1. The ratio of registered sex offenders to all residents in this zip code is near the state average.
Median resident age:
This zip code:
49.2 years
Texas median age:
35.6 years
Average household size:
This zip code:
2.2 people
Texas:
2.6 people
Averages for the 2020 tax year for zip code 77975, filed in 2021:
Average Adjusted Gross Income (AGI) in 2020: $65,732 (Individual Income Tax Returns)
Here:
$65,732
State:
$77,054
Salary/wage: $49,768 (reported on 72.9% of returns)
Here:
$49,768
State:
$62,766
(% of AGI for various income ranges: 1490.7% for AGIs below $25k, 3621.4% for AGIs $25k-50k, 6825.0% for AGIs $50k-75k, 10528.0% for AGIs $75k-100k, 15358.3% for AGIs $100k-200k)
Taxable interest for individuals: $1,656 (reported on 45.9% of returns)
This zip code:
$1,656
Texas:
$2,665
(% of AGI for various income ranges: 38.6% for AGIs below $25k, 37.1% for AGIs $25k-50k, 122.5% for AGIs $50k-75k, 120.0% for AGIs $75k-100k, 236.7% for AGIs $100k-200k)
Ordinary dividends: $5,406 (reported on 20.0% of returns)
Here:
$5,406
State:
$10,044
(% of AGI for various income ranges: 35.7% for AGIs below $25k, 70.7% for AGIs $25k-50k, 135.0% for AGIs $50k-75k, 84.0% for AGIs $75k-100k, 498.3% for AGIs $100k-200k)
Net capital gain/loss in AGI: +$14,405 (reported on 23.5% of returns)
Here:
+$14,405
State:
+$39,590
(% of AGI for various income ranges: 16.4% for AGIs below $25k, 103.6% for AGIs $25k-50k, 160.0% for AGIs $50k-75k, 206.0% for AGIs $75k-100k, 1573.3% for AGIs $100k-200k)
Profit/loss from business: +$10,232 (reported on 22.4% of returns)
Here:
+$10,232
State:
+$10,888
(% of AGI for various income ranges: 177.9% for AGIs below $25k, 421.4% for AGIs $25k-50k, 575.0% for AGIs $50k-75k, 1075.0% for AGIs $100k-200k)
Taxable individual retirement arrangement distribution: $15,345 (reported on 12.9% of returns)
77975:
$15,345
Texas:
$24,740
(% of AGI for various income ranges: 212.1% for AGIs below $25k, 707.5% for AGIs $50k-75k, 1375.0% for AGIs $100k-200k)
Total itemized deductions: $21,900 (reported on 2.4% of returns)
Here:
$21,900
State:
$40,428
(% of AGI for various income ranges: 312.9% for AGIs below $25k)
Earned income credit: $3,070 (reported on 11.8% of returns)
Here:
$3,070
State:
$2,584
(% of AGI for various income ranges: 132.1% for AGIs below $25k, 87.1% for AGIs $25k-50k)
Percentage of individuals using paid preparers for their 2020 taxes: 91.8%
Here:
92%
State:
92%
(% for various income ranges: 88.5% for AGIs below $25k, 95.0% for AGIs $25k-50k, 92.9% for AGIs $50k-75k, 88.9% for AGIs $75k-100k, 100.0% for AGIs $100k-200k, 75.0% for AGIs over 200k)
Averages for the 2012 tax year for zip code 77975, filed in 2013:
Average Adjusted Gross Income (AGI) in 2012: $57,598 (Individual Income Tax Returns)
Here:
$57,598
State:
$65,384
Salary/wage: $42,622 (reported on 78.3% of returns)
Here:
$42,622
State:
$52,524
(% of AGI for various income ranges: 73.0% for AGIs below $25k, 74.0% for AGIs $25k-50k, 67.6% for AGIs $50k-75k, 68.4% for AGIs $75k-100k, 81.5% for AGIs $100k-200k)
Taxable interest for individuals: $1,044 (reported on 49.4% of returns)
This zip code:
$1,044
Texas:
$2,372
(% of AGI for various income ranges: 1.6% for AGIs below $25k, 1.1% for AGIs $25k-50k, 0.9% for AGIs $50k-75k, 0.5% for AGIs $75k-100k, 1.2% for AGIs $100k-200k, 0.4% for AGIs over 200k)
Ordinary dividends: $3,053 (reported on 18.1% of returns)
Here:
$3,053
State:
$9,721
(% of AGI for various income ranges: 0.8% for AGIs below $25k, 0.9% for AGIs $25k-50k, 1.3% for AGIs $50k-75k, 0.3% for AGIs $75k-100k, 2.2% for AGIs $100k-200k)
Net capital gain/loss in AGI: +$4,418 (reported on 20.5% of returns)
Here:
+$4,418
State:
+$35,319
(% of AGI for various income ranges: 1.8% for AGIs $25k-50k, 2.0% for AGIs $75k-100k, 4.1% for AGIs $100k-200k)
Profit/loss from business: +$10,742 (reported on 22.9% of returns)
Here:
+$10,742
State:
+$13,732
(% of AGI for various income ranges: 10.7% for AGIs below $25k, 2.6% for AGIs $25k-50k, 7.4% for AGIs $50k-75k, 2.9% for AGIs $75k-100k, 6.2% for AGIs $100k-200k)
Taxable individual retirement arrangement distribution: $10,660 (reported on 12.0% of returns)
77975:
$10,660
Texas:
$19,511
(% of AGI for various income ranges: 7.2% for AGIs below $25k, 6.4% for AGIs $50k-75k, 3.1% for AGIs $100k-200k)
Total itemized deductions: $19,508 (20% of AGI, reported on 14.5% of returns)
Here:
$19,508
State:
$24,724
Here:
20.3% of AGI
State:
15.9% of AGI
(% of AGI for various income ranges: 8.0% for AGIs $25k-50k, 10.6% for AGIs $50k-75k, 8.7% for AGIs $100k-200k)
Charity contributions: $2,788 (reported on 9.6% of returns)
Here:
$2,788
State:
$6,808
(% of AGI for various income ranges: 0.5% for AGIs below $25k, 1.3% for AGIs $50k-75k, 1.0% for AGIs $100k-200k)
Taxes paid: $4,036 (reported on 13.3% of returns)
77975:
$4,036
State:
$6,921
(% of AGI for various income ranges: 0.8% for AGIs $25k-50k, 1.7% for AGIs $50k-75k, 2.3% for AGIs $100k-200k)
Earned income credit: $2,200 (reported on 12.0% of returns)
Here:
$2,200
State:
$2,570
(% of AGI for various income ranges: 4.4% for AGIs below $25k, 0.8% for AGIs $25k-50k)
Percentage of individuals using paid preparers for their 2012 taxes: 72.3%
Here:
72%
State:
51%
(% for various income ranges: 63.3% for AGIs below $25k, 66.7% for AGIs $25k-50k, 75.0% for AGIs $50k-75k, 88.9% for AGIs $75k-100k, 87.5% for AGIs $100k-200k, 100.0% for AGIs over 200k)
Averages for the 2004 tax year for zip code 77975, filed in 2005:
Average Adjusted Gross Income (AGI) in 2004: $29,631 (Individual Income Tax Returns)
Here:
$29,631
State:
$47,881
Salary/wage: $28,619 (reported on 78.3% of returns)
Here:
$28,619
State:
$41,947
(% of AGI for various income ranges: 100.1% for AGIs below $10k, 73.9% for AGIs $10k-25k, 77.6% for AGIs $25k-50k, 81.2% for AGIs $50k-75k, 72.0% for AGIs $75k-100k, 56.4% for AGIs over 100k)
Taxable interest for individuals: $1,363 (reported on 51.3% of returns)
This zip code:
$1,363
Texas:
$2,255
(% of AGI for various income ranges: 8.9% for AGIs below $10k, 4.4% for AGIs $10k-25k, 1.6% for AGIs $25k-50k, 2.3% for AGIs $50k-75k, 1.6% for AGIs $75k-100k, 0.6% for AGIs over 100k)
Taxable dividends: $2,153 (reported on 17.9% of returns)
Here:
$2,153
State:
$4,261
(% of AGI for various income ranges: 3.6% for AGIs below $10k, 1.0% for AGIs $10k-25k, 0.9% for AGIs $25k-50k, 1.1% for AGIs $50k-75k, 1.0% for AGIs $75k-100k, 3.0% for AGIs over 100k)
Net capital gain/loss: +$4,278 (reported on 22.4% of returns)
Here:
+$4,278
State:
+$16,110
(% of AGI for various income ranges: 4.6% for AGIs below $10k, 2.5% for AGIs $10k-25k, 3.2% for AGIs $25k-50k, 3.3% for AGIs $50k-75k, 0.4% for AGIs $75k-100k, 8.2% for AGIs over 100k)
Profit/loss from business: +$8,626 (reported on 23.2% of returns)
Here:
+$8,626
State:
+$11,013
(% of AGI for various income ranges: 18.5% for AGIs below $10k, 7.6% for AGIs $10k-25k, 8.7% for AGIs $25k-50k, 5.1% for AGIs $50k-75k, 7.1% for AGIs $75k-100k)
IRA payment deduction: $3,031 (reported on 4.0% of returns)
77975:
$3,031
Texas:
$3,120
Total itemized deductions: $14,179 (25% of AGI, reported on 10.4% of returns)
Here:
$14,179
State:
$19,631
Here:
25.1% of AGI
State:
18.9% of AGI
(% of AGI for various income ranges: 3.2% for AGIs $10k-25k, 4.7% for AGIs $25k-50k, 7.3% for AGIs $50k-75k, 7.9% for AGIs $75k-100k)
Charity contributions deductions: $1,829 (3% of AGI, reported on 8.7% of returns)
Here:
$1,829
State:
$4,753
Here:
3.1% of AGI
State:
4.2% of AGI
(% of AGI for various income ranges: 0.9% for AGIs below $10k, 0.2% for AGIs $25k-50k, 1.3% for AGIs $50k-75k, 0.8% for AGIs $75k-100k)
Total tax: $3,383 (reported on 73.3% of returns)
77975:
$3,383
State:
$9,058
(% of AGI for various income ranges: 5.8% for AGIs below $10k, 4.6% for AGIs $10k-25k, 6.4% for AGIs $25k-50k, 8.3% for AGIs $50k-75k, 11.6% for AGIs $75k-100k, 16.7% for AGIs over 100k)
Earned income credit: $1,658 (reported on 14.9% of returns)
Here:
$1,658
State:
$2,024
Percentage of individuals using paid preparers for their 2004 taxes: 76.1%
Here:
76%
State:
57%
(% for various income ranges: 69.1% for AGIs below $10k, 75.2% for AGIs $10k-25k, 80.6% for AGIs $25k-50k, 80.8% for AGIs $50k-75k, 82.9% for AGIs $75k-100k, 83.3% for AGIs over 100k)
Household received Food Stamps/SNAP in the past 12 months: 33 Household did not receive Food Stamps/SNAP in the past 12 months: 725
Women who had a birth in the past 12 months: 7 (7 now married, 0 unmarried) Women who did not have a birth in the past 12 months: 263 (139 now married, 122 unmarried)
Housing units in zip code 77975 with a mortgage: 139 (10 second mortgage, 8 both second mortgage and home equity loan) Median monthly owner costs for units with a mortgage: $1,274 Median monthly owner costs for units without a mortgage: $512
Residents with income below the poverty level in 2022:
This zip code:
11.5%
Whole state:
14.0%
Residents with income below 50% of the poverty level in 2022:
This zip code:
10.2%
Whole state:
7.4%
Median number of rooms in houses and condos:
Here:
5.2
State:
6.3
Median number of rooms in apartments:
Here:
4.5
State:
4.0
Notable locations in this zip code not listed on our city pages
Streams, rivers, and creeks: Youngs Branch (A), West Prong Lavaca River (B), Kuehns Creek (C), Long Branch (D), North Fork Lavaca River (E). Display/hide their locations on the map
In group quarters: 48 (-1 institutionalized population)
Size of family households: 261 2-persons, 86 3-persons, 37 4-persons, 42 5-persons, 5 6-persons, 7 7-or-more-persons
Size of nonfamily households: 306 1-person, 16 2-persons, 3 3-persons
235 married couples with children.
85 single-parent households (41 men, 44 women).
74.7% of residents of 77975 zip code speak English at home.
17.2% of residents speak Spanish at home (73% very well, 9% well, 14% not well, 4% not at all).
8.0% of residents speak other Indo-European language at home (96% very well, 4% well).
0.6% of residents speak other language at home (100% very well).
Foreign born population: 140 (8.3%) (18.8% of them are naturalized citizens)
This zip code:
8.3%
Whole state:
17.2%
76%Honduras
6%El Salvador
6%Guatemala
4%Micronesia
29%German
25%Czech
9%American
3%English
2%Irish
2%Polish
1%Italian
Year of entry for the foreign-born population
442010 or later
602000 to 2009
211990 to 1999
24Before 1990
Housing units lacking complete plumbing facilities: 2.0% Housing units lacking complete kitchen facilities: 1.0%
67.0%Electricity
29.5%Bottled, tank, or LP gas
2.1%Utility gas
1.0%No fuel used
0.7%Other fuel
Population in 1990: 2,459.
Place of birth for U.S.-born residents:
This state: 1,342
Northeast: 8
Midwest: 107
South: 37
West: 26
75% of the 77975 zip code residents lived in the same house 5 years ago. Out of people who lived in different houses, 44% lived in this county. Out of people who lived in different counties, 50% lived in Texas.
94% of the 77975 zip code residents lived in the same house 1 year ago. Out of people who lived in different houses, 51% moved from this county. Out of people who lived in different houses, 51% moved from different county within same state.
Private vs. public school enrollment:
Students in private schools in grades 1 to 8 (elementary and middle school): 25
Here:
15.5%
Texas:
8.8%
Students in private schools in grades 9 to 12 (high school): 32
Here:
24.1%
Texas:
8.0%
Students in private undergraduate colleges: 1
Here:
6.6%
Texas:
16.2%
Occupation by median earnings in the past 12 months ($)
98,389Architecture and engineering occupations
78,159Transportation occupations
57,981Health diagnosing and treating practitioners and other technical occupations
57,106Business and financial operations occupations
56,748Production occupations
48,731Management occupations
Top industries in this zip code by the number of employees in 2005:
Health Care and Social Assistance: Nursing Care Facilities (50-99 employees: 1 establishment, 20-49 employees: 1 establishment)
Finance and Insurance: Commercial Banking (20-49: 1, 1-4: 1)
Mining: Natural Gas Liquid Extraction (20-49: 1)
Accommodation and Food Services: Full-Service Restaurants (20-49: 1)
Construction: Plumbing, Heating, and Air-Conditioning Contractors (10-19: 1, 1-4: 1)
Accommodation and Food Services: Limited-Service Restaurants (10-19: 1)
People in group quarters in 2010:
49 people in nursing facilities/skilled-nursing facilities
People in group quarters in 2000:
58 people in nursing homes
Fatal accident statistics in 2011:
Fatal accident count: 2
Vehicles involved in fatal accidents: 5
Fatal accidents caused by drunken drivers: 0
Fatalities: 3
Persons involved in fatal accidents: 7
Pedestrians involved in fatal accidents: 0
2002 - 2018 National Fire Incident Reporting System (NFIRS) incidents
According to the data from the years 2002 - 2018 the average number of fire incidents per year is 12. The highest number of fire incidents - 23 took place in 2017, and the least - 2 in 2014. The data has a rising trend.
When looking into fire subcategories, the most incidents belonged to: Outside Fires (69.0%), and Structure Fires (14.8%).
Fire incident types reported to NFIRS in Zip Code 77975

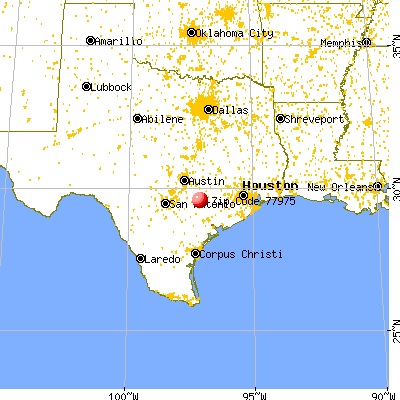


 Nearest zip codes: 77984, 78941, 78956, 77987, 78951, 78959.


 According to the data from the years 2002 - 2018 the average number of fire incidents per year is 12. The highest number of fire incidents - 23 took place in 2017, and the least - 2 in 2014. The data has a rising trend.
 When looking into fire subcategories, the most incidents belonged to: Outside Fires (69.0%), and Structure Fires (14.8%).