Estimated zip code population in 2022: 894 Zip code population in 2010: 1,256 Zip code population in 2000: 608
Houses and condos: 614 Renter-occupied apartments: 55
% of renters here:
13%
State:
38%
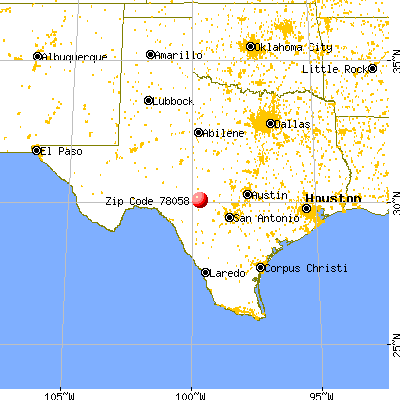
March 2022 cost of living index in zip code 78058: 78.3 (low, U.S. average is 100)
Land area: 555.8 sq. mi. Water area: 0.6 sq. mi.
Population density: 2 people per square mile
(very low).
OSM Map
General Map
Google Map
MSN Map
OSM Map
General Map
Google Map
MSN Map
OSM Map
General Map
Google Map
MSN Map
OSM Map
General Map
Google Map
MSN Map
Please wait while loading the map...
Real estate property taxes paid for housing units in 2022:
This zip code:
0.7% ($2,607)
Texas:
1.5% ($4,050)
Median real estate property taxes paid for housing units with mortgages in 2022: $3,991 (0.8%) Median real estate property taxes paid for housing units with no mortgage in 2022: $2,300 (0.7%)
Business Search- 14 Million verified businesses
Males: 457
(51.1%)
Females: 437
(48.9%)
For population 25 years and over in 78058:
High school or higher: 98.5%
Bachelor's degree or higher: 39.5%
Graduate or professional degree: 13.5%
Mean travel time to work (commute): 26.1 minutes
For population 15 years and over in 78058:
Never married: 12.7%
Now married: 63.2%
Separated: 0.1%
Widowed: 18.3%
Divorced: 5.7%
Zip code 78058 compared to state average:
Unemployed percentage significantly below state average.
Black race population percentage significantly below state average.
Hispanic race population percentage significantly below state average.
Median age significantly above state average.
Foreign-born population percentage significantly below state average.
Renting percentage significantly below state average.
Length of stay since moving in significantly above state average.
Averages for the 2020 tax year for zip code 78058, filed in 2021:
Average Adjusted Gross Income (AGI) in 2020: $72,630 (Individual Income Tax Returns)
Here:
$72,630
State:
$77,054
Salary/wage: $56,684 (reported on 68.2% of returns)
Here:
$56,684
State:
$62,766
(% of AGI for various income ranges: 1148.5% for AGIs below $25k, 3888.9% for AGIs $25k-50k, 5768.6% for AGIs $50k-75k, 6420.0% for AGIs $75k-100k, 15168.3% for AGIs $100k-200k)
Taxable interest for individuals: $1,904 (reported on 37.9% of returns)
This zip code:
$1,904
Texas:
$2,665
(% of AGI for various income ranges: 20.0% for AGIs below $25k, 71.1% for AGIs $25k-50k, 27.1% for AGIs $50k-75k, 52.5% for AGIs $75k-100k, 130.0% for AGIs $100k-200k)
Ordinary dividends: $5,782 (reported on 25.8% of returns)
Here:
$5,782
State:
$10,044
(% of AGI for various income ranges: 70.0% for AGIs below $25k, 116.7% for AGIs $25k-50k, 154.3% for AGIs $50k-75k, 241.7% for AGIs $100k-200k)
Net capital gain/loss in AGI: +$30,081 (reported on 24.2% of returns)
Here:
+$30,081
State:
+$39,590
(% of AGI for various income ranges: 33.1% for AGIs below $25k, 124.4% for AGIs $25k-50k, 255.7% for AGIs $50k-75k, 980.0% for AGIs $100k-200k)
Profit/loss from business: +$13,826 (reported on 28.8% of returns)
Here:
+$13,826
State:
+$10,888
(% of AGI for various income ranges: 262.3% for AGIs below $25k, 491.1% for AGIs $25k-50k, 815.7% for AGIs $50k-75k, 2121.7% for AGIs $100k-200k)
Taxable individual retirement arrangement distribution: $24,843 (reported on 10.6% of returns)
78058:
$24,843
Texas:
$24,740
(% of AGI for various income ranges: 698.9% for AGIs $25k-50k, 2775.0% for AGIs $75k-100k)
Total itemized deductions: $39,720 (reported on 7.6% of returns)
Here:
$39,720
State:
$40,428
(% of AGI for various income ranges: 803.3% for AGIs $25k-50k, 2105.0% for AGIs $100k-200k)
Charity contributions: $8,925 (reported on 6.1% of returns)
Here:
$8,925
State:
$18,201
(% of AGI for various income ranges: 595.0% for AGIs $100k-200k)
Taxes paid: $6,100 (reported on 7.6% of returns)
78058:
$6,100
State:
$7,821
(% of AGI for various income ranges: 103.3% for AGIs $25k-50k, 353.3% for AGIs $100k-200k)
Earned income credit: $2,089 (reported on 13.6% of returns)
Here:
$2,089
State:
$2,584
(% of AGI for various income ranges: 91.5% for AGIs below $25k, 76.7% for AGIs $25k-50k)
Percentage of individuals using paid preparers for their 2020 taxes: 90.9%
Here:
91%
State:
92%
(% for various income ranges: 90.5% for AGIs below $25k, 93.3% for AGIs $25k-50k, 100.0% for AGIs $50k-75k, 83.3% for AGIs $75k-100k, 90.0% for AGIs $100k-200k, 75.0% for AGIs over 200k)
Averages for the 2012 tax year for zip code 78058, filed in 2013:
Average Adjusted Gross Income (AGI) in 2012: $55,973 (Individual Income Tax Returns)
Here:
$55,973
State:
$65,384
Salary/wage: $44,862 (reported on 65.4% of returns)
Here:
$44,862
State:
$52,524
(% of AGI for various income ranges: 57.9% for AGIs below $25k, 60.9% for AGIs $25k-50k, 56.6% for AGIs $50k-75k, 50.2% for AGIs $75k-100k, 47.5% for AGIs $100k-200k)
Taxable interest for individuals: $1,177 (reported on 42.3% of returns)
This zip code:
$1,177
Texas:
$2,372
(% of AGI for various income ranges: 3.5% for AGIs below $25k, 0.7% for AGIs $25k-50k, 1.1% for AGIs $50k-75k, 1.0% for AGIs $75k-100k, 0.3% for AGIs $100k-200k)
Ordinary dividends: $3,950 (reported on 23.1% of returns)
Here:
$3,950
State:
$9,721
(% of AGI for various income ranges: 2.2% for AGIs below $25k, 2.1% for AGIs $25k-50k, 2.7% for AGIs $50k-75k, 1.4% for AGIs $100k-200k)
Net capital gain/loss in AGI: +$3,044 (reported on 17.3% of returns)
Here:
+$3,044
State:
+$35,319
(% of AGI for various income ranges: 0.6% for AGIs $25k-50k, 1.9% for AGIs $100k-200k)
Profit/loss from business: +$11,700 (reported on 23.1% of returns)
Here:
+$11,700
State:
+$13,732
(% of AGI for various income ranges: 8.4% for AGIs below $25k, 10.1% for AGIs $25k-50k, 19.2% for AGIs $75k-100k)
Taxable individual retirement arrangement distribution: $15,943 (reported on 13.5% of returns)
78058:
$15,943
Texas:
$19,511
Total itemized deductions: $24,742 (21% of AGI, reported on 23.1% of returns)
Here:
$24,742
State:
$24,724
Here:
21.5% of AGI
State:
15.9% of AGI
(% of AGI for various income ranges: 17.1% for AGIs below $25k, 7.5% for AGIs $25k-50k, 18.2% for AGIs $50k-75k, 10.1% for AGIs $100k-200k)
Charity contributions: $3,610 (reported on 19.2% of returns)
Here:
$3,610
State:
$6,808
(% of AGI for various income ranges: 3.5% for AGIs below $25k, 2.1% for AGIs $50k-75k, 1.3% for AGIs $100k-200k)
Taxes paid: $4,883 (reported on 23.1% of returns)
78058:
$4,883
State:
$6,921
(% of AGI for various income ranges: 2.2% for AGIs below $25k, 1.8% for AGIs $25k-50k, 3.6% for AGIs $50k-75k, 2.1% for AGIs $100k-200k)
Earned income credit: $2,143 (reported on 13.5% of returns)
Here:
$2,143
State:
$2,570
(% of AGI for various income ranges: 4.0% for AGIs below $25k, 0.9% for AGIs $25k-50k)
Percentage of individuals using paid preparers for their 2012 taxes: 51.9%
Here:
52%
State:
51%
(% for various income ranges: 52.4% for AGIs below $25k, 42.9% for AGIs $25k-50k, 42.9% for AGIs $50k-75k, 75.0% for AGIs $75k-100k, 66.7% for AGIs $100k-200k)
Averages for the 2004 tax year for zip code 78058, filed in 2005:
Average Adjusted Gross Income (AGI) in 2004: $33,707 (Individual Income Tax Returns)
Here:
$33,707
State:
$47,881
Salary/wage: $33,667 (reported on 67.5% of returns)
Here:
$33,667
State:
$41,947
(% of AGI for various income ranges: 75.4% for AGIs $10k-25k, 63.8% for AGIs $25k-50k, 60.4% for AGIs $50k-75k, 51.7% for AGIs $75k-100k, 58.8% for AGIs over 100k)
Taxable interest for individuals: $2,965 (reported on 42.6% of returns)
This zip code:
$2,965
Texas:
$2,255
(% of AGI for various income ranges: 4.4% for AGIs $10k-25k, 3.4% for AGIs $25k-50k, 4.6% for AGIs $50k-75k, 1.7% for AGIs $75k-100k, 2.3% for AGIs over 100k)
Taxable dividends: $2,024 (reported on 24.3% of returns)
Here:
$2,024
State:
$4,261
(% of AGI for various income ranges: 0.7% for AGIs $25k-50k, 2.9% for AGIs $50k-75k, 0.6% for AGIs over 100k)
Net capital gain/loss: +$2,440 (reported on 24.9% of returns)
Here:
+$2,440
State:
+$16,110
(% of AGI for various income ranges: 3.2% for AGIs $10k-25k, 1.3% for AGIs $25k-50k, 0.1% for AGIs $50k-75k, 0.9% for AGIs $75k-100k, 4.3% for AGIs over 100k)
Profit/loss from business: +$1,127 (reported on 23.4% of returns)
Here:
+$1,127
State:
+$11,013
(% of AGI for various income ranges: 7.4% for AGIs $10k-25k, -1.6% for AGIs $25k-50k, 3.2% for AGIs $50k-75k)
Total itemized deductions: $16,462 (28% of AGI, reported on 19.2% of returns)
Here:
$16,462
State:
$19,631
Here:
28.4% of AGI
State:
18.9% of AGI
(% of AGI for various income ranges: 11.0% for AGIs $10k-25k, 8.3% for AGIs $25k-50k, 11.8% for AGIs $50k-75k, 15.4% for AGIs $75k-100k)
Charity contributions deductions: $2,873 (5% of AGI, reported on 16.3% of returns)
Here:
$2,873
State:
$4,753
Here:
4.8% of AGI
State:
4.2% of AGI
(% of AGI for various income ranges: 1.9% for AGIs $25k-50k, 1.1% for AGIs $50k-75k, 3.1% for AGIs $75k-100k)
Total tax: $5,078 (reported on 71.9% of returns)
78058:
$5,078
State:
$9,058
(% of AGI for various income ranges: 4.3% for AGIs $10k-25k, 6.4% for AGIs $25k-50k, 8.1% for AGIs $50k-75k, 13.0% for AGIs $75k-100k, 17.4% for AGIs over 100k)
Earned income credit: $1,677 (reported on 19.2% of returns)
Here:
$1,677
State:
$2,024
Percentage of individuals using paid preparers for their 2004 taxes: 63.9%
Here:
64%
State:
57%
(% for various income ranges: 65.4% for AGIs below $10k, 61.1% for AGIs $10k-25k, 62.3% for AGIs $25k-50k, 58.3% for AGIs $50k-75k, 62.5% for AGIs $75k-100k, 94.4% for AGIs over 100k)
Likely homosexual households (counted as self-reported same-sex unmarried-partner households)
Lesbian couples: 0.0% of all households
Gay men: 1.6% of all households
Household received Food Stamps/SNAP in the past 12 months: 0 Household did not receive Food Stamps/SNAP in the past 12 months: 438
Women who did not have a birth in the past 12 months: 95 (55 now married, 39 unmarried)
Housing units in zip code 78058 with a mortgage: 103 Median monthly owner costs for units with a mortgage: $2,120 Median monthly owner costs for units without a mortgage: $539
Residents with income below the poverty level in 2022:
This zip code:
3.7%
Whole state:
14.0%
Residents with income below 50% of the poverty level in 2022:
This zip code:
1.7%
Whole state:
7.4%
Median number of rooms in houses and condos:
Here:
6.2
State:
6.3
Median number of rooms in apartments:
Here:
5.4
State:
4.0
Notable locations in this zip code not listed on our city pages
Lakes and reservoirs: Black Jack Waterhole (A), Hackberry Waterhole (B), Cedar Lake (C), Bundy Tank (D), Cedar Lake (E), The Dirt Tank (F), Shelton Ranches Reservoir Number 2 (G). Display/hide their locations on the map
Streams, rivers, and creeks: Spring Creek (A), Fessenden Branch (B), Joy Creek (C), Short Kent Creek (D), South Cedar Creek (E), North Prong Bullhead Creek (F), Long Kent Creek (G), Contrary Creek (H), Allen Creek (I). Display/hide their locations on the map
In group quarters: 23 (-1 institutionalized population)
Size of family households: 219 2-persons, 48 3-persons, 32 4-persons
Size of nonfamily households: 140 1-person, 2 2-persons, 1 7-or-more-persons
48 married couples with children.
0 single-parent households ().
95.9% of residents of 78058 zip code speak English at home.
0.3% of residents speak Spanish at home (67% well, 33% not well).
4.4% of residents speak other Indo-European language at home (44% very well, 56% well).
0.7% of residents speak Asian or Pacific Island language at home (100% very well).
Foreign born population: 67 (7.6%) (94.2% of them are naturalized citizens)
This zip code:
7.6%
Whole state:
17.2%
62%Bhutan
34%El Salvador
9%Malaysia
15%Scotch-Irish
14%German
13%American
12%English
11%Irish
10%Polish
4%Welsh
Year of entry for the foreign-born population
482010 or later
32000 to 2009
01990 to 1999
31Before 1990
Housing units lacking complete plumbing facilities: 1.3% Housing units lacking complete kitchen facilities: 1.3%
87.2%Electricity
7.7%Wood
5.5%Bottled, tank, or LP gas
Population in 1990: 207. Population change in the 1990s: +401 (+193.7%).
Place of birth for U.S.-born residents:
This state: 574
Northeast: 58
Midwest: 27
South: 58
West: 96
42% of the 78058 zip code residents lived in the same house 5 years ago. Out of people who lived in different houses, 18% lived in this county. Out of people who lived in different counties, 50% lived in Texas.
97% of the 78058 zip code residents lived in the same house 1 year ago. Out of people who lived in different houses, 12% moved from this county. Out of people who lived in different houses, 104% moved from different state.
Private vs. public school enrollment:
Students in private schools in grades 1 to 8 (elementary and middle school): 34
Here:
60.1%
Texas:
8.8%
Students in private schools in grades 9 to 12 (high school): 46
Here:
95.8%
Texas:
8.0%
Students in private undergraduate colleges:
Here:
0.0%
Texas:
16.2%
Occupation by median earnings in the past 12 months ($)
105,901Sales and related occupations
70,295Management occupations
2,596Healthcare support occupations
2,415Education, training, and library occupations
Top industries in this zip code by the number of employees in 2005:
Health Care and Social Assistance: Other Residential Care Facilities (20-49 employees: 1 establishment)
Accommodation and Food Services: Rooming and Boarding Houses (10-19: 1)
Arts, Entertainment, and Recreation: All Other Amusement and Recreation Industries (10-19: 1)
Accommodation and Food Services: Recreational and Vacation Camps (except Campgrounds) (5-9: 1, 1-4: 1)
Wholesale Trade: Industrial Machinery and Equipment Merchant Wholesalers (5-9: 1)
Construction: Site Preparation Contractors (1-4: 2)
Real Estate and Rental and Leasing: Lessors of Other Real Estate Property (1-4: 1)
Professional, Scientific, and Technical Services: Administrative Management and General Management Consulting Services (1-4: 1)
People in group quarters in 2010:
33 people in residential treatment centers for juveniles (non-correctional)
5 people in group homes intended for adults
People in group quarters in 2000:
26 people in other noninstitutional group quarters
Fatal accident statistics in 2014:
Fatal accident count: 2
Vehicles involved in fatal accidents: 2
Fatal accidents caused by drunken drivers: 1
Fatalities: 3
Persons involved in fatal accidents: 7
Pedestrians involved in fatal accidents: 0
Fatal accident statistics in 2013:
Fatal accident count: 5
Vehicles involved in fatal accidents: 9
Fatal accidents caused by drunken drivers: 1
Fatalities: 5
Persons involved in fatal accidents: 15
Pedestrians involved in fatal accidents: 2
2002 - 2018 National Fire Incident Reporting System (NFIRS) incidents
Based on the data from the years 2002 - 2018 the average number of fire incidents per year is 15. The highest number of fire incidents - 58 took place in 2008, and the least - 0 in 2012. The data has a declining trend.
When looking into fire subcategories, the most reports belonged to: Outside Fires (77.3%), and Mobile Property/Vehicle Fires (11.4%).
Fire incident types reported to NFIRS in Zip Code 78058


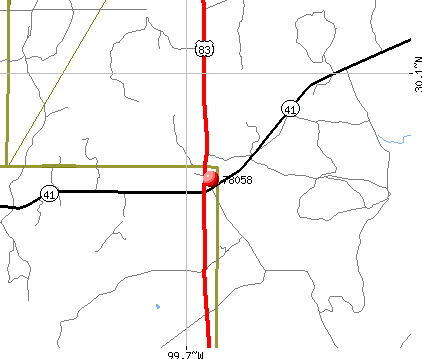 Nearest zip codes: 78024, 78029, 78873, 78885, 78025, 78055.


 Based on the data from the years 2002 - 2018 the average number of fire incidents per year is 15. The highest number of fire incidents - 58 took place in 2008, and the least - 0 in 2012. The data has a declining trend.
 When looking into fire subcategories, the most reports belonged to: Outside Fires (77.3%), and Mobile Property/Vehicle Fires (11.4%).