Estimated zip code population in 2022: 10,586 Zip code population in 2010: 9,227 Zip code population in 2000: 7,851
Houses and condos: 5,080 Renter-occupied apartments: 325
% of renters here:
8%
State:
38%
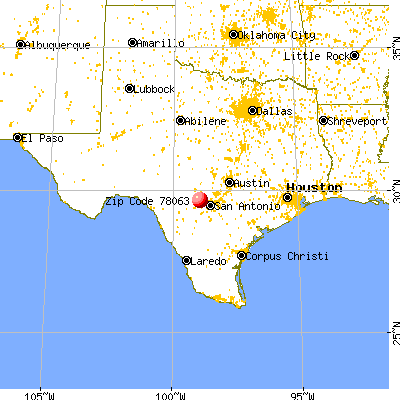
March 2022 cost of living index in zip code 78063: 80.0 (low, U.S. average is 100)
Land area: 121.6 sq. mi. Water area: 4.5 sq. mi.
Population density: 87 people per square mile
(very low).
OSM Map
General Map
Google Map
MSN Map
OSM Map
General Map
Google Map
MSN Map
OSM Map
General Map
Google Map
MSN Map
OSM Map
General Map
Google Map
MSN Map
Please wait while loading the map...
Real estate property taxes paid for housing units in 2022:
This zip code:
0.9% ($2,547)
Texas:
1.5% ($4,050)
Median real estate property taxes paid for housing units with mortgages in 2022: $3,025 (0.9%) Median real estate property taxes paid for housing units with no mortgage in 2022: $2,003 (0.9%)
Averages for the 2020 tax year for zip code 78063, filed in 2021:
Average Adjusted Gross Income (AGI) in 2020: $67,413 (Individual Income Tax Returns)
Here:
$67,413
State:
$77,054
Salary/wage: $58,061 (reported on 72.1% of returns)
Here:
$58,061
State:
$62,766
(% of AGI for various income ranges: 986.1% for AGIs below $25k, 3159.5% for AGIs $25k-50k, 5643.5% for AGIs $50k-75k, 8404.8% for AGIs $75k-100k, 14997.0% for AGIs $100k-200k, 48454.3% for AGIs over 200k)
Taxable interest for individuals: $1,434 (reported on 32.4% of returns)
This zip code:
$1,434
Texas:
$2,665
(% of AGI for various income ranges: 23.4% for AGIs below $25k, 31.8% for AGIs $25k-50k, 38.4% for AGIs $50k-75k, 83.3% for AGIs $75k-100k, 134.3% for AGIs $100k-200k, 814.3% for AGIs over 200k)
Ordinary dividends: $6,090 (reported on 17.5% of returns)
Here:
$6,090
State:
$10,044
(% of AGI for various income ranges: 27.0% for AGIs below $25k, 42.1% for AGIs $25k-50k, 63.3% for AGIs $50k-75k, 94.8% for AGIs $75k-100k, 337.0% for AGIs $100k-200k, 3057.1% for AGIs over 200k)
Net capital gain/loss in AGI: +$26,497 (reported on 16.0% of returns)
Here:
+$26,497
State:
+$39,590
(% of AGI for various income ranges: 61.9% for AGIs $25k-50k, 89.8% for AGIs $50k-75k, 145.5% for AGIs $75k-100k, 575.4% for AGIs $100k-200k, 22214.3% for AGIs over 200k)
Profit/loss from business: +$8,132 (reported on 21.0% of returns)
Here:
+$8,132
State:
+$10,888
(% of AGI for various income ranges: 203.0% for AGIs below $25k, 225.4% for AGIs $25k-50k, 194.5% for AGIs $50k-75k, 254.8% for AGIs $75k-100k, 305.0% for AGIs $100k-200k, 1081.4% for AGIs over 200k)
Taxable individual retirement arrangement distribution: $20,212 (reported on 11.0% of returns)
78063:
$20,212
Texas:
$24,740
(% of AGI for various income ranges: 85.3% for AGIs below $25k, 137.0% for AGIs $25k-50k, 266.5% for AGIs $50k-75k, 486.1% for AGIs $75k-100k, 793.3% for AGIs $100k-200k, 2510.0% for AGIs over 200k)
Total itemized deductions: $30,459 (reported on 6.3% of returns)
Here:
$30,459
State:
$40,428
(% of AGI for various income ranges: 143.0% for AGIs $25k-50k, 229.0% for AGIs $50k-75k, 351.2% for AGIs $75k-100k, 649.8% for AGIs $100k-200k, 3455.7% for AGIs over 200k)
Charity contributions: $10,695 (reported on 4.5% of returns)
Here:
$10,695
State:
$18,201
(% of AGI for various income ranges: 15.0% for AGIs $25k-50k, 37.1% for AGIs $50k-75k, 70.6% for AGIs $75k-100k, 167.4% for AGIs $100k-200k, 1344.3% for AGIs over 200k)
Taxes paid: $6,517 (reported on 6.3% of returns)
78063:
$6,517
State:
$7,821
(% of AGI for various income ranges: 25.5% for AGIs $25k-50k, 41.6% for AGIs $50k-75k, 87.9% for AGIs $75k-100k, 155.0% for AGIs $100k-200k, 684.3% for AGIs over 200k)
Earned income credit: $2,126 (reported on 14.9% of returns)
Here:
$2,126
State:
$2,584
(% of AGI for various income ranges: 87.5% for AGIs below $25k, 68.5% for AGIs $25k-50k)
Percentage of individuals using paid preparers for their 2020 taxes: 90.5%
Here:
90%
State:
92%
(% for various income ranges: 90.5% for AGIs below $25k, 90.6% for AGIs $25k-50k, 91.0% for AGIs $50k-75k, 89.6% for AGIs $75k-100k, 90.7% for AGIs $100k-200k, 90.0% for AGIs over 200k)
Averages for the 2012 tax year for zip code 78063, filed in 2013:
Average Adjusted Gross Income (AGI) in 2012: $61,686 (Individual Income Tax Returns)
Here:
$61,686
State:
$65,384
Salary/wage: $50,512 (reported on 77.1% of returns)
Here:
$50,512
State:
$52,524
(% of AGI for various income ranges: 71.9% for AGIs below $25k, 66.7% for AGIs $25k-50k, 70.5% for AGIs $50k-75k, 71.8% for AGIs $75k-100k, 71.0% for AGIs $100k-200k, 37.2% for AGIs over 200k)
Taxable interest for individuals: $1,932 (reported on 33.1% of returns)
This zip code:
$1,932
Texas:
$2,372
(% of AGI for various income ranges: 1.7% for AGIs below $25k, 1.1% for AGIs $25k-50k, 0.8% for AGIs $50k-75k, 0.5% for AGIs $75k-100k, 0.6% for AGIs $100k-200k, 1.8% for AGIs over 200k)
Ordinary dividends: $5,028 (reported on 17.6% of returns)
Here:
$5,028
State:
$9,721
(% of AGI for various income ranges: 1.9% for AGIs below $25k, 0.9% for AGIs $25k-50k, 0.7% for AGIs $50k-75k, 0.8% for AGIs $75k-100k, 1.4% for AGIs $100k-200k, 2.6% for AGIs over 200k)
Net capital gain/loss in AGI: +$11,862 (reported on 14.0% of returns)
Here:
+$11,862
State:
+$35,319
(% of AGI for various income ranges: 0.5% for AGIs $25k-50k, 0.7% for AGIs $50k-75k, 1.1% for AGIs $75k-100k, 1.5% for AGIs $100k-200k, 9.0% for AGIs over 200k)
Profit/loss from business: +$13,609 (reported on 22.4% of returns)
Here:
+$13,609
State:
+$13,732
(% of AGI for various income ranges: 10.7% for AGIs below $25k, 4.6% for AGIs $25k-50k, 3.3% for AGIs $50k-75k, 3.4% for AGIs $75k-100k, 4.9% for AGIs $100k-200k, 5.5% for AGIs over 200k)
Taxable individual retirement arrangement distribution: $16,798 (reported on 11.2% of returns)
78063:
$16,798
Texas:
$19,511
(% of AGI for various income ranges: 3.6% for AGIs below $25k, 3.5% for AGIs $25k-50k, 2.9% for AGIs $50k-75k, 2.4% for AGIs $75k-100k, 5.6% for AGIs $100k-200k)
Total itemized deductions: $22,141 (21% of AGI, reported on 27.5% of returns)
Here:
$22,141
State:
$24,724
Here:
21.4% of AGI
State:
15.9% of AGI
(% of AGI for various income ranges: 10.9% for AGIs below $25k, 8.8% for AGIs $25k-50k, 11.0% for AGIs $50k-75k, 11.5% for AGIs $75k-100k, 9.7% for AGIs $100k-200k, 8.5% for AGIs over 200k)
Charity contributions: $3,867 (reported on 20.9% of returns)
Here:
$3,867
State:
$6,808
(% of AGI for various income ranges: 0.7% for AGIs below $25k, 0.8% for AGIs $25k-50k, 0.9% for AGIs $50k-75k, 1.4% for AGIs $75k-100k, 1.6% for AGIs $100k-200k, 1.6% for AGIs over 200k)
Taxes paid: $6,190 (reported on 27.0% of returns)
78063:
$6,190
State:
$6,921
(% of AGI for various income ranges: 2.6% for AGIs below $25k, 2.3% for AGIs $25k-50k, 3.0% for AGIs $50k-75k, 3.3% for AGIs $75k-100k, 3.1% for AGIs $100k-200k, 1.9% for AGIs over 200k)
Earned income credit: $2,052 (reported on 16.5% of returns)
Here:
$2,052
State:
$2,570
(% of AGI for various income ranges: 5.9% for AGIs below $25k, 0.9% for AGIs $25k-50k)
Percentage of individuals using paid preparers for their 2012 taxes: 44.5%
Here:
45%
State:
51%
(% for various income ranges: 40.7% for AGIs below $25k, 44.8% for AGIs $25k-50k, 43.9% for AGIs $50k-75k, 45.5% for AGIs $75k-100k, 48.0% for AGIs $100k-200k, 80.0% for AGIs over 200k)
Averages for the 2004 tax year for zip code 78063, filed in 2005:
Average Adjusted Gross Income (AGI) in 2004: $42,749 (Individual Income Tax Returns)
Here:
$42,749
State:
$47,881
Salary/wage: $39,555 (reported on 78.3% of returns)
Here:
$39,555
State:
$41,947
(% of AGI for various income ranges: 66.3% for AGIs $10k-25k, 75.1% for AGIs $25k-50k, 74.9% for AGIs $50k-75k, 77.7% for AGIs $75k-100k, 60.8% for AGIs over 100k)
Taxable interest for individuals: $1,909 (reported on 41.0% of returns)
This zip code:
$1,909
Texas:
$2,255
(% of AGI for various income ranges: 2.1% for AGIs $10k-25k, 1.5% for AGIs $25k-50k, 1.5% for AGIs $50k-75k, 1.5% for AGIs $75k-100k, 2.0% for AGIs over 100k)
Taxable dividends: $1,797 (reported on 19.5% of returns)
Here:
$1,797
State:
$4,261
(% of AGI for various income ranges: 1.1% for AGIs $10k-25k, 0.8% for AGIs $25k-50k, 0.5% for AGIs $50k-75k, 0.4% for AGIs $75k-100k, 1.1% for AGIs over 100k)
Net capital gain/loss: +$10,803 (reported on 17.1% of returns)
Here:
+$10,803
State:
+$16,110
(% of AGI for various income ranges: 0.9% for AGIs $10k-25k, 0.7% for AGIs $25k-50k, 0.5% for AGIs $50k-75k, 1.0% for AGIs $75k-100k, 12.8% for AGIs over 100k)
Profit/loss from business: +$9,194 (reported on 23.3% of returns)
Here:
+$9,194
State:
+$11,013
(% of AGI for various income ranges: 10.5% for AGIs $10k-25k, 2.8% for AGIs $25k-50k, 4.1% for AGIs $50k-75k, 3.8% for AGIs $75k-100k, 6.2% for AGIs over 100k)
IRA payment deduction: $2,716 (reported on 2.3% of returns)
78063:
$2,716
Texas:
$3,120
(% of AGI for various income ranges: 0.3% for AGIs $25k-50k, 0.1% for AGIs $50k-75k, 0.1% for AGIs $75k-100k, 0.1% for AGIs over 100k)
Self-employed pension: $12,895 (reported on 0.6% of returns)
Here:
$12,895
Texas:
$16,401
Total itemized deductions: $16,844 (22% of AGI, reported on 26.6% of returns)
Here:
$16,844
State:
$19,631
Here:
22.2% of AGI
State:
18.9% of AGI
(% of AGI for various income ranges: 8.7% for AGIs $10k-25k, 8.8% for AGIs $25k-50k, 10.6% for AGIs $50k-75k, 10.5% for AGIs $75k-100k, 11.5% for AGIs over 100k)
Charity contributions deductions: $3,407 (4% of AGI, reported on 21.3% of returns)
Here:
$3,407
State:
$4,753
Here:
4.2% of AGI
State:
4.2% of AGI
(% of AGI for various income ranges: 0.9% for AGIs $10k-25k, 0.8% for AGIs $25k-50k, 1.5% for AGIs $50k-75k, 1.5% for AGIs $75k-100k, 2.9% for AGIs over 100k)
Total tax: $5,976 (reported on 78.8% of returns)
78063:
$5,976
State:
$9,058
(% of AGI for various income ranges: 4.8% for AGIs $10k-25k, 7.0% for AGIs $25k-50k, 9.1% for AGIs $50k-75k, 11.0% for AGIs $75k-100k, 17.2% for AGIs over 100k)
Earned income credit: $1,706 (reported on 15.1% of returns)
Here:
$1,706
State:
$2,024
Percentage of individuals using paid preparers for their 2004 taxes: 49.4%
Here:
49%
State:
57%
(% for various income ranges: 45.9% for AGIs below $10k, 49.9% for AGIs $10k-25k, 49.8% for AGIs $25k-50k, 47.6% for AGIs $50k-75k, 50.0% for AGIs $75k-100k, 57.8% for AGIs over 100k)
Household received Food Stamps/SNAP in the past 12 months: 286 Household did not receive Food Stamps/SNAP in the past 12 months: 3,867
Women who had a birth in the past 12 months: 34 (34 now married, 0 unmarried) Women who did not have a birth in the past 12 months: 1,824 (798 now married, 1,026 unmarried)
Housing units in zip code 78063 with a mortgage: 1,873 (214 second mortgage, 8 home equity loan, 202 both second mortgage and home equity loan) Houses without a mortgage: 18
Median monthly owner costs for units with a mortgage: $1,792 Median monthly owner costs for units without a mortgage: $447
Residents with income below the poverty level in 2022:
This zip code:
13.1%
Whole state:
14.0%
Residents with income below 50% of the poverty level in 2022:
This zip code:
3.8%
Whole state:
7.4%
Median number of rooms in houses and condos:
Here:
5.8
State:
6.3
Median number of rooms in apartments:
Here:
4.8
State:
4.0
Notable locations in this zip code not listed on our city pages
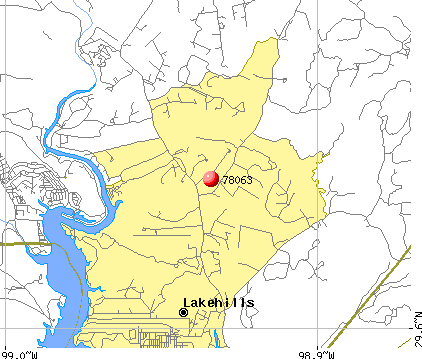
Notable locations in zip code 78063: Medina Lake Volunteer Fire Department Station 1 (A), Pipe Creek Volunteer Fire Department (B), Castle Lake Ranch Volunteer Fire Department (C). Display/hide their locations on the map
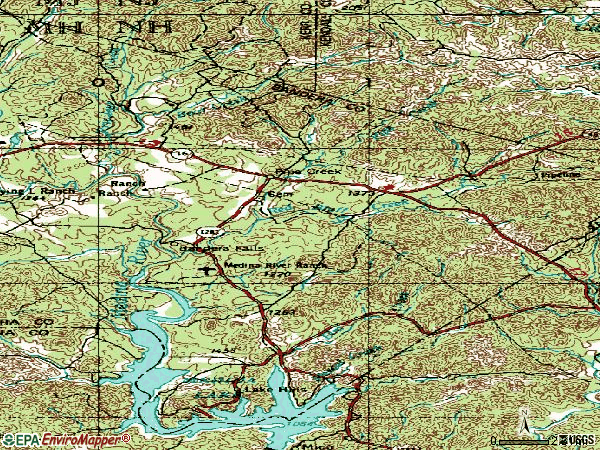
Lakes and reservoirs: Wonder Hole (A), Medina Lake (B), Walton Lake (C), Castle Lake (D), Youngblood Lake (E), Berry Lake (F). Display/hide their locations on the map
Creeks: Bear Creek (A), Spires Creek (B), Spanish Oak Creek (C), Bear Springs Creek (D), Mescal Creek (E), Elm Creek (F), Red Bluff Creek (G), Pipe Creek (H), Madrona Creek (I). Display/hide their locations on the map
Parks in zip code 78063 include: Bandara County Park (1), Bear Springs Blossom Nature Preserve (2), Bandera County Park (3). Display/hide their locations on the map
In group quarters: 1 (-1 institutionalized population)
Size of family households: 1,389 2-persons, 610 3-persons, 208 4-persons, 195 5-persons, 180 6-persons, 131 7-or-more-persons
Size of nonfamily households: 989 1-person, 429 2-persons, 62 4-persons
768 married couples with children.
138 single-parent households (107 men, 31 women).
85.3% of residents of 78063 zip code speak English at home.
13.4% of residents speak Spanish at home (56% very well, 25% well, 15% not well, 4% not at all).
1.0% of residents speak other Indo-European language at home (25% very well, 69% well, 6% not well).
0.4% of residents speak Asian or Pacific Island language at home (23% very well, 42% well, 35% not well).
0.3% of residents speak other language at home (100% very well).
Foreign born population: 597 (5.6%) (55.4% of them are naturalized citizens)
This zip code:
5.6%
Whole state:
17.2%
43%Honduras
13%Sweden
11%United Kingdom, excluding England and Scotland
9%France
7%Thailand
5%El Salvador
5%Israel
24%German
8%English
7%American
5%Irish
3%Italian
3%Finnish
2%Scottish
Year of entry for the foreign-born population
3292010 or later
1882000 to 2009
1021990 to 1999
421Before 1990
Public elementary/middle school in in zip code 78063 not listed on the city page:
HILL COUNTRY EL (Location: 6346 FM 1283, Grades: PK-5)
Private elementary/middle school in in this zip code not listed on the city page:
PIPE CREEK CHRISTIAN SCHOOL (Students: 25, Location: 1990 FM 1283, Grades: UG-3)
Facilities with environmental interests located in this zip code:
APPROVED DRAIN OIL (HC-4 BOX 4744 in PIPE CREEK, TX)
USED OIL PROGRAM (Resource Conservation and Recovery Act (tracking hazardous waste)) Organizations: MICHAEL AND SANDRA MCALISTER (CONTACT/OWNER)
Housing units lacking complete plumbing facilities: 1.9% Housing units lacking complete kitchen facilities: 1.4%
83.6%Electricity
9.1%Bottled, tank, or LP gas
3.5%Utility gas
3.5%Wood
Population in 1990: 3,187. Population change in the 1990s: +4,664 (+146.3%).
Place of birth for U.S.-born residents:
This state: 6,115
Northeast: 423
Midwest: 813
South: 820
West: 1,398
53% of the 78063 zip code residents lived in the same house 5 years ago. Out of people who lived in different houses, 17% lived in this county. Out of people who lived in different counties, 50% lived in Texas.
94% of the 78063 zip code residents lived in the same house 1 year ago. Out of people who lived in different houses, 16% moved from this county. Out of people who lived in different houses, 60% moved from different county within same state. Out of people who lived in different houses, 23% moved from different state. Out of people who lived in different houses, 9% moved from abroad.
Private vs. public school enrollment:
Students in private schools in grades 1 to 8 (elementary and middle school): 174
Here:
25.0%
Texas:
8.8%
Students in private schools in grades 9 to 12 (high school): 74
Here:
16.4%
Texas:
8.0%
Students in private undergraduate colleges: 93
Here:
25.1%
Texas:
16.2%
Occupation by median earnings in the past 12 months ($)
90,139Architecture and engineering occupations
75,112Fire fighting and prevention, and other protective service workers including supervisors
70,417Business and financial operations occupations
66,601Computer and mathematical occupations
55,330Installation, maintenance, and repair occupations
54,876Management occupations
Companies with federal contracts located in this zip code:
COACHWORKS L L C (10498 STATE HIGHWAY 16 S in PIPE CREEK, TX; small business) : $250,364 in 4 contractsfrom 2001 to 2004
$163,000 with Air Force for Modification of Equipment -- Ground Effect Vehicles, Motor Vehicles, Trailers, and Cycles. Signed on 2001-06-22. Completion date: 2001-09-06.
$64,977 with Air Force for Miscellaneous Items. Signed on 2004-09-27. Completion date: 2004-10-22.
$17,749 with Air Force for Maintenance, Repair and Rebuilding of Equipment -- Ground Effect Vehicles, Motor Vehicles, Trailers, and Cycles. Signed on 2004-12-06. Completion date: 2004-12-17.
$4,638 with Air Force for Miscellaneous Items. Signed on 2004-10-18. Completion date: 2004-11-12.
CONTRACT LEASE MANAGEMENT (2647 RIVER BLUFF CIRCLE in PIPE CREEK, TX; small business) : $178,307 in 3 contractsfrom 1999 to 2001
$94,827 with Navy for Lease or Rental of Equipment -- Service and Trade Equipment. Taking place in VA. Signed on 1999-10-01. Completion date: 2000-03-31.
$50,000 with Air Force for Lease or Rental of Equipment -- Special Industry Machinery. Signed on 1999-10-01. Completion date: 2000-09-30.
$33,480 with Air Force for Refrigeration Equipment. Signed on 2001-09-27. Completion date: 2001-10-31.
POPHAM & SONS CONTRACTING (1528 PEBBLE BEACH DRIVE in LAKEHILLS, TX; small business) : $142,724 in 12 contractsfrom 1999 to 2001
Contracts for Carpet Laying and Cleaning by Air Force Signed by year:2000: $24,377; 2001: $17,224; 2002: $0; 2003: $0; 2004: $0; 2005: $0; 2006: $0.
Biggest contracts:
$101,123 with Air Force for Carpet Laying and Cleaning. Signed on 1999-10-01. Completion date: 2000-09-30.
$53,079, same as above.Signed on 2000-10-03. Completion date: 2001-03-31.
$35,031, same as above.Signed on 2000-01-14. Completion date: 2000-09-30.
$29,411, same as above.Signed on 2001-01-12. Completion date: 2001-03-31.
Top industries in this zip code by the number of employees in 2005:
Accommodation and Food Services: RV (Recreational Vehicle) Parks and Campgrounds (20-49: 1, 1-4: 1)
Other Services (except Public Administration): Religious Organizations (5-9: 2, 1-4: 4)
Accommodation and Food Services: Full-Service Restaurants (5-9: 2, 1-4: 3)
Construction: Site Preparation Contractors (10-19: 1, 1-4: 2)
Construction: New Single-Family Housing Construction (except Operative Builders) (5-9: 1, 1-4: 5)
Other Services (except Public Administration): Beauty Salons (10-19: 1)
People in group quarters in 2000:
3 people in religious group quarters
Fatal accident statistics in 2014:
Fatal accident count: 2
Vehicles involved in fatal accidents: 4
Fatal accidents caused by drunken drivers: 1
Fatalities: 2
Persons involved in fatal accidents: 4
Pedestrians involved in fatal accidents: 0
Fatal accident statistics in 2013:
Fatal accident count: 4
Vehicles involved in fatal accidents: 8
Fatal accidents caused by drunken drivers: 2
Fatalities: 6
Persons involved in fatal accidents: 12
Pedestrians involved in fatal accidents: 0
2004 - 2018 National Fire Incident Reporting System (NFIRS) incidents
According to the data from the years 2004 - 2018 the average number of fire incidents per year is 60. The highest number of fire incidents - 108 took place in 2008, and the least - 23 in 2004. The data has a growing trend.
When looking into fire subcategories, the most incidents belonged to: Outside Fires (68.1%), and Structure Fires (21.4%).
Fire incident types reported to NFIRS in Zip Code 78063


 Nearest zip codes: 78056, 78023, 78003, 78066, 78254, 78010.


 (Location: 6346 FM 1283, Grades: PK-5)


 According to the data from the years 2004 - 2018 the average number of fire incidents per year is 60. The highest number of fire incidents - 108 took place in 2008, and the least - 23 in 2004. The data has a growing trend.
 When looking into fire subcategories, the most incidents belonged to: Outside Fires (68.1%), and Structure Fires (21.4%).