Estimated zip code population in 2022: 4,258 Zip code population in 2010: 3,976 Zip code population in 2000: 4,445
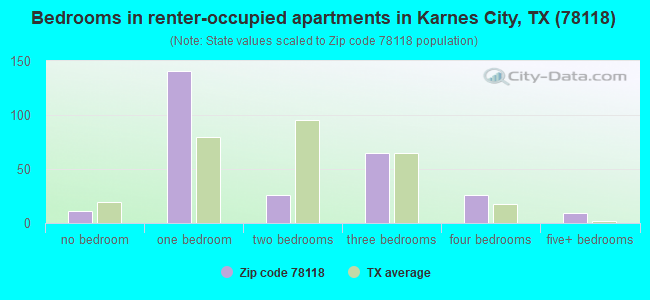
Houses and condos: 1,715 Renter-occupied apartments: 278
% of renters here:
22%
State:
38%
March 2022 cost of living index in zip code 78118: 76.4 (low, U.S. average is 100)
Land area: 181.2 sq. mi. Water area: 1.3 sq. mi.
Population density: 23 people per square mile
(very low).
OSM Map
General Map
Google Map
MSN Map
OSM Map
General Map
Google Map
MSN Map
OSM Map
General Map
Google Map
MSN Map
OSM Map
General Map
Google Map
MSN Map
Please wait while loading the map...
Real estate property taxes paid for housing units in 2022:
This zip code:
1.0% ($1,249)
Texas:
1.5% ($4,050)
Median real estate property taxes paid for housing units with mortgages in 2022: $3,346 (1.3%) Median real estate property taxes paid for housing units with no mortgage in 2022: $1,168 (1.0%)
Business Search- 14 Million verified businesses
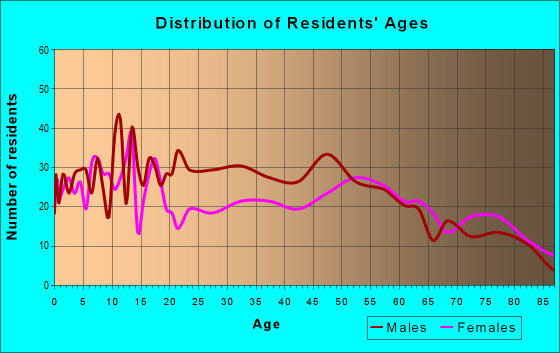
Males: 2,562
(60.2%)
Females: 1,696
(39.8%)
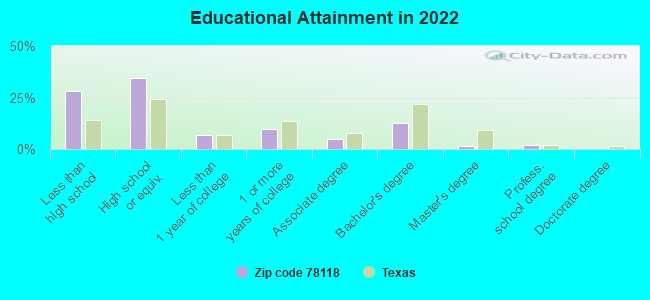
For population 25 years and over in 78118:
High school or higher: 69.8%
Bachelor's degree or higher: 15.9%
Graduate or professional degree: 3.6%
Unemployed: 5.6%
Mean travel time to work (commute): 22.4 minutes
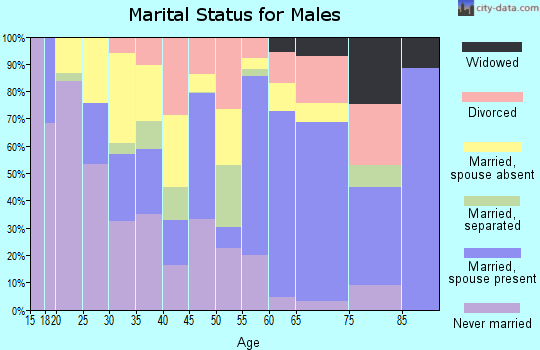
For population 15 years and over in 78118:
Never married: 41.9%
Now married: 39.9%
Separated: 4.4%
Widowed: 5.8%
Divorced: 7.9%
Zip code 78118 compared to state average:
Median house value below state average.
Black race population percentage below state average.
Median age above state average.
Renting percentage below state average.
Length of stay since moving in significantly above state average.
Number of college students significantly below state average.
Percentage of population with a bachelor's degree or higher below state average.
Averages for the 2020 tax year for zip code 78118, filed in 2021:
Average Adjusted Gross Income (AGI) in 2020: $86,752 (Individual Income Tax Returns)
Here:
$86,752
State:
$77,054
Salary/wage: $39,651 (reported on 79.5% of returns)
Here:
$39,651
State:
$62,766
(% of AGI for various income ranges: 1310.8% for AGIs below $25k, 3503.4% for AGIs $25k-50k, 6255.2% for AGIs $50k-75k, 8766.7% for AGIs $75k-100k, 12782.0% for AGIs $100k-200k)
Taxable interest for individuals: $4,825 (reported on 26.7% of returns)
This zip code:
$4,825
Texas:
$2,665
(% of AGI for various income ranges: 7.6% for AGIs below $25k, 8.0% for AGIs $25k-50k, 30.0% for AGIs $50k-75k, 87.8% for AGIs $75k-100k, 225.0% for AGIs $100k-200k)
Ordinary dividends: $11,542 (reported on 12.3% of returns)
Here:
$11,542
State:
$10,044
(% of AGI for various income ranges: 17.8% for AGIs below $25k, 18.0% for AGIs $25k-50k, 37.1% for AGIs $50k-75k, 273.0% for AGIs $100k-200k)
Net capital gain/loss in AGI: +$26,573 (reported on 13.3% of returns)
Here:
+$26,573
State:
+$39,590
(% of AGI for various income ranges: 0.2% for AGIs below $25k, 142.9% for AGIs $50k-75k, 934.0% for AGIs $100k-200k)
Profit/loss from business: +$8,665 (reported on 17.4% of returns)
Here:
+$8,665
State:
+$10,888
(% of AGI for various income ranges: 57.2% for AGIs below $25k, 22.2% for AGIs $25k-50k, 190.5% for AGIs $50k-75k, 185.6% for AGIs $75k-100k, 464.0% for AGIs $100k-200k)
Taxable individual retirement arrangement distribution: $16,612 (reported on 4.1% of returns)
78118:
$16,612
Texas:
$24,740
(% of AGI for various income ranges: 83.7% for AGIs $25k-50k, 695.6% for AGIs $75k-100k)
Total itemized deductions: $41,264 (reported on 5.6% of returns)
Here:
$41,264
State:
$40,428
(% of AGI for various income ranges: 244.1% for AGIs $25k-50k, 896.7% for AGIs $75k-100k)
Charity contributions: $26,400 (reported on 4.1% of returns)
Here:
$26,400
State:
$18,201
(% of AGI for various income ranges: 478.9% for AGIs $75k-100k)
Taxes paid: $5,367 (reported on 4.6% of returns)
78118:
$5,367
State:
$7,821
(% of AGI for various income ranges: 26.3% for AGIs $25k-50k, 120.0% for AGIs $75k-100k)
Earned income credit: $2,774 (reported on 24.1% of returns)
Here:
$2,774
State:
$2,584
(% of AGI for various income ranges: 177.0% for AGIs below $25k, 102.2% for AGIs $25k-50k)
Percentage of individuals using paid preparers for their 2020 taxes: 92.3%
Here:
92%
State:
92%
(% for various income ranges: 91.7% for AGIs below $25k, 94.1% for AGIs $25k-50k, 93.1% for AGIs $50k-75k, 91.7% for AGIs $75k-100k, 88.2% for AGIs $100k-200k, 92.9% for AGIs over 200k)
Averages for the 2012 tax year for zip code 78118, filed in 2013:
Average Adjusted Gross Income (AGI) in 2012: $95,755 (Individual Income Tax Returns)
Here:
$95,755
State:
$65,384
Salary/wage: $37,221 (reported on 83.4% of returns)
Here:
$37,221
State:
$52,524
(% of AGI for various income ranges: 83.4% for AGIs below $25k, 86.9% for AGIs $25k-50k, 77.9% for AGIs $50k-75k, 73.1% for AGIs $75k-100k, 46.8% for AGIs $100k-200k, 6.8% for AGIs over 200k)
Taxable interest for individuals: $1,251 (reported on 25.4% of returns)
This zip code:
$1,251
Texas:
$2,372
(% of AGI for various income ranges: 0.2% for AGIs below $25k, 0.2% for AGIs $25k-50k, 0.2% for AGIs $50k-75k, 0.3% for AGIs $75k-100k, 0.3% for AGIs $100k-200k, 0.4% for AGIs over 200k)
Ordinary dividends: $2,843 (reported on 10.9% of returns)
Here:
$2,843
State:
$9,721
(% of AGI for various income ranges: 0.4% for AGIs below $25k, 0.1% for AGIs $25k-50k, 0.2% for AGIs $50k-75k, 0.3% for AGIs $75k-100k, 0.2% for AGIs $100k-200k, 0.4% for AGIs over 200k)
Net capital gain/loss in AGI: +$47,432 (reported on 11.4% of returns)
Here:
+$47,432
State:
+$35,319
(% of AGI for various income ranges: 1.3% for AGIs $50k-75k, 1.5% for AGIs $75k-100k, 4.8% for AGIs $100k-200k, 8.2% for AGIs over 200k)
Profit/loss from business: +$17,606 (reported on 16.6% of returns)
Here:
+$17,606
State:
+$13,732
(% of AGI for various income ranges: 6.3% for AGIs below $25k, 2.3% for AGIs $25k-50k, 4.6% for AGIs $50k-75k, 3.9% for AGIs $75k-100k, 3.5% for AGIs $100k-200k, 2.5% for AGIs over 200k)
Taxable individual retirement arrangement distribution: $8,423 (reported on 6.7% of returns)
78118:
$8,423
Texas:
$19,511
(% of AGI for various income ranges: 1.7% for AGIs below $25k, 2.7% for AGIs $50k-75k, 1.4% for AGIs $100k-200k, 0.2% for AGIs over 200k)
Total itemized deductions: $24,962 (10% of AGI, reported on 12.4% of returns)
Here:
$24,962
State:
$24,724
Here:
9.7% of AGI
State:
15.9% of AGI
(% of AGI for various income ranges: 5.1% for AGIs $25k-50k, 6.0% for AGIs $50k-75k, 6.7% for AGIs $75k-100k, 4.8% for AGIs $100k-200k, 2.3% for AGIs over 200k)
Charity contributions: $12,795 (reported on 9.8% of returns)
Here:
$12,795
State:
$6,808
(% of AGI for various income ranges: 0.6% for AGIs $25k-50k, 0.9% for AGIs $50k-75k, 1.6% for AGIs $75k-100k, 1.7% for AGIs $100k-200k, 1.5% for AGIs over 200k)
Taxes paid: $4,037 (reported on 12.4% of returns)
78118:
$4,037
State:
$6,921
(% of AGI for various income ranges: 0.7% for AGIs $25k-50k, 0.8% for AGIs $50k-75k, 1.0% for AGIs $75k-100k, 0.7% for AGIs $100k-200k, 0.4% for AGIs over 200k)
Earned income credit: $2,628 (reported on 25.9% of returns)
Here:
$2,628
State:
$2,570
(% of AGI for various income ranges: 10.3% for AGIs below $25k, 1.6% for AGIs $25k-50k)
Percentage of individuals using paid preparers for their 2012 taxes: 67.4%
Here:
67%
State:
51%
(% for various income ranges: 63.2% for AGIs below $25k, 62.7% for AGIs $25k-50k, 64.0% for AGIs $50k-75k, 66.7% for AGIs $75k-100k, 76.9% for AGIs $100k-200k, 100.0% for AGIs over 200k)
Averages for the 2004 tax year for zip code 78118, filed in 2005:
Average Adjusted Gross Income (AGI) in 2004: $29,964 (Individual Income Tax Returns)
Here:
$29,964
State:
$47,881
Salary/wage: $27,468 (reported on 83.5% of returns)
Here:
$27,468
State:
$41,947
(% of AGI for various income ranges: 145.5% for AGIs below $10k, 83.4% for AGIs $10k-25k, 82.4% for AGIs $25k-50k, 74.5% for AGIs $50k-75k, 83.7% for AGIs $75k-100k, 51.8% for AGIs over 100k)
Taxable interest for individuals: $1,738 (reported on 34.3% of returns)
This zip code:
$1,738
Texas:
$2,255
(% of AGI for various income ranges: 6.5% for AGIs below $10k, 1.8% for AGIs $10k-25k, 1.3% for AGIs $25k-50k, 2.1% for AGIs $50k-75k, 1.4% for AGIs $75k-100k, 2.6% for AGIs over 100k)
Taxable dividends: $1,927 (reported on 14.2% of returns)
Here:
$1,927
State:
$4,261
(% of AGI for various income ranges: 1.7% for AGIs below $10k, 0.6% for AGIs $10k-25k, 0.5% for AGIs $25k-50k, 1.5% for AGIs $50k-75k, 0.3% for AGIs $75k-100k, 1.4% for AGIs over 100k)
Net capital gain/loss: +$2,533 (reported on 14.5% of returns)
Here:
+$2,533
State:
+$16,110
(% of AGI for various income ranges: 2.1% for AGIs below $10k, 0.7% for AGIs $10k-25k, 0.2% for AGIs $25k-50k, 0.9% for AGIs $50k-75k, 0.5% for AGIs $75k-100k, 3.5% for AGIs over 100k)
Profit/loss from business: +$11,255 (reported on 16.7% of returns)
Here:
+$11,255
State:
+$11,013
(% of AGI for various income ranges: 6.7% for AGIs below $10k, 5.3% for AGIs $10k-25k, 4.8% for AGIs $25k-50k, 2.9% for AGIs $50k-75k, 0.8% for AGIs $75k-100k, 15.0% for AGIs over 100k)
IRA payment deduction: $3,045 (reported on 1.4% of returns)
78118:
$3,045
Texas:
$3,120
Total itemized deductions: $14,642 (20% of AGI, reported on 9.8% of returns)
Here:
$14,642
State:
$19,631
Here:
20.2% of AGI
State:
18.9% of AGI
(% of AGI for various income ranges: 3.2% for AGIs $10k-25k, 4.4% for AGIs $25k-50k, 7.4% for AGIs $50k-75k, 4.1% for AGIs $75k-100k, 5.2% for AGIs over 100k)
Charity contributions deductions: $2,602 (4% of AGI, reported on 7.3% of returns)
Here:
$2,602
State:
$4,753
Here:
3.7% of AGI
State:
4.2% of AGI
(% of AGI for various income ranges: 0.3% for AGIs $10k-25k, 0.6% for AGIs $25k-50k, 0.6% for AGIs $50k-75k, 0.5% for AGIs $75k-100k, 1.1% for AGIs over 100k)
Total tax: $4,634 (reported on 59.1% of returns)
78118:
$4,634
State:
$9,058
(% of AGI for various income ranges: 3.2% for AGIs below $10k, 2.8% for AGIs $10k-25k, 6.0% for AGIs $25k-50k, 8.3% for AGIs $50k-75k, 10.3% for AGIs $75k-100k, 19.6% for AGIs over 100k)
Earned income credit: $2,000 (reported on 32.3% of returns)
Here:
$2,000
State:
$2,024
Percentage of individuals using paid preparers for their 2004 taxes: 71.6%
Here:
72%
State:
57%
(% for various income ranges: 68.1% for AGIs below $10k, 75.8% for AGIs $10k-25k, 71.7% for AGIs $25k-50k, 64.4% for AGIs $50k-75k, 66.7% for AGIs $75k-100k, 80.6% for AGIs over 100k)
Household received Food Stamps/SNAP in the past 12 months: 210 Household did not receive Food Stamps/SNAP in the past 12 months: 1,063
Women who did not have a birth in the past 12 months: 757 (301 now married, 457 unmarried)
Housing units in zip code 78118 with a mortgage: 97 Median monthly owner costs for units with a mortgage: $1,723 Median monthly owner costs for units without a mortgage: $482
Residents with income below the poverty level in 2022:
This zip code:
20.6%
Whole state:
14.0%
Residents with income below 50% of the poverty level in 2022:
This zip code:
9.7%
Whole state:
7.4%
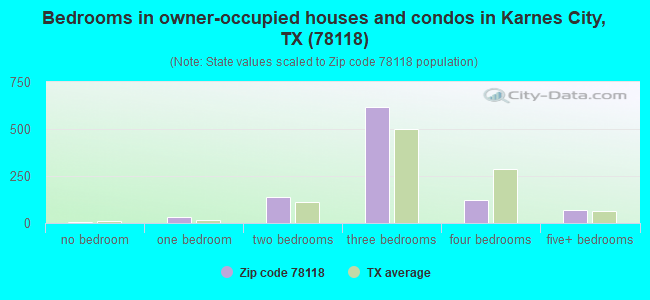
Median number of rooms in houses and condos:
Here:
5.7
State:
6.3
Median number of rooms in apartments:
Here:
4.0
State:
4.0
Notable locations in this zip code not listed on our city pages
Notable locations in zip code 78118: Karnes City Refinery (A), John Ruckman House (B), Karnes County Courthouse (C), Karnes County Museum at Old Helena (D), Saint Joseph School Museum (E), Karnes City Volunteer Fire Department (F). Display/hide their locations on the map
Churches in zip code 78118 include: First Presbyterian Church (A), Saint Pauls Lutheran Church (B), Saint Cornelius Catholic Church (C), First Baptist Church (D). Display/hide their locations on the map
Lakes and reservoirs: Horseshoe Lake (A), Esse Lake Number 8 (B), Soil Conservation Service Site 8 Reservoir (C), Soil Conservation Service Site 9 Reservoir (D), Best Lake (E), Weddington Lake Number 1 (F), Weddington Lake Number 2 (G). Display/hide their locations on the map
Streams, rivers, and creeks: Rhymes Creek (A), Olmos Creek (B), Lake Slough (C), Dry Ecleto Creek (D), Cow Creek (E). Display/hide their locations on the map
In group quarters: 1,199 (-1 institutionalized population)
Size of family households: 387 2-persons, 267 3-persons, 95 4-persons, 40 5-persons, 8 6-persons, 22 7-or-more-persons
Size of nonfamily households: 321 1-person, 140 2-persons
346 married couples with children.
115 single-parent households (22 men, 93 women).
65.2% of residents of 78118 zip code speak English at home.
33.7% of residents speak Spanish at home (46% very well, 11% well, 10% not well, 33% not at all).
1.4% of residents speak other Indo-European language at home (57% very well, 43% well).
0.5% of residents speak other language at home (100% not at all).
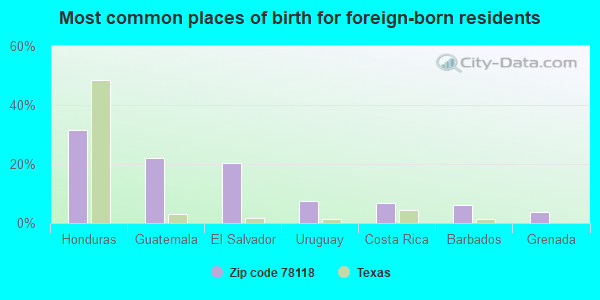
Foreign born population: 780 (18.3%) (17.5% of them are naturalized citizens)
This zip code:
18.3%
Whole state:
17.2%
32%Honduras
22%Guatemala
20%El Salvador
7%Uruguay
7%Costa Rica
6%Barbados
4%Grenada
5%American
5%German
3%Irish
2%Polish
1%English
1%Haitian
1%Scotch-Irish
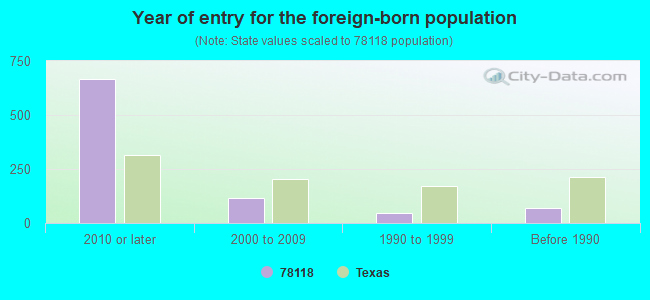
Year of entry for the foreign-born population
6682010 or later
1152000 to 2009
471990 to 1999
71Before 1990
Housing units lacking complete plumbing facilities: 7.4% Housing units lacking complete kitchen facilities: 5.7%
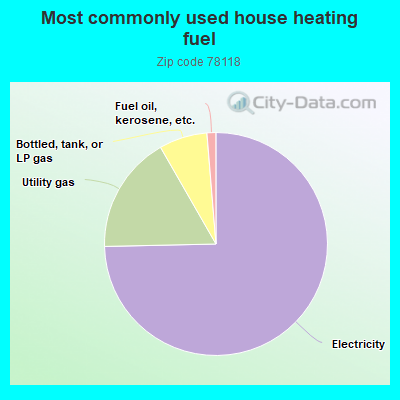
74.8%Electricity
17.1%Utility gas
7.0%Bottled, tank, or LP gas
1.3%Fuel oil, kerosene, etc.
Population in 1990: 3,827. Population change in the 1990s: +618 (+16.1%).
Place of birth for U.S.-born residents:
This state: 2,997
Northeast: 38
Midwest: 192
South: 128
West: 61
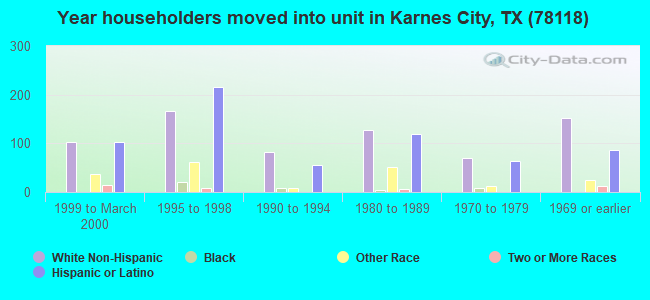
59% of the 78118 zip code residents lived in the same house 5 years ago. Out of people who lived in different houses, 51% lived in this county. Out of people who lived in different counties, 50% lived in Texas.
71% of the 78118 zip code residents lived in the same house 1 year ago. Out of people who lived in different houses, 25% moved from this county. Out of people who lived in different houses, 31% moved from different county within same state. Out of people who lived in different houses, 4% moved from different state. Out of people who lived in different houses, 44% moved from abroad.
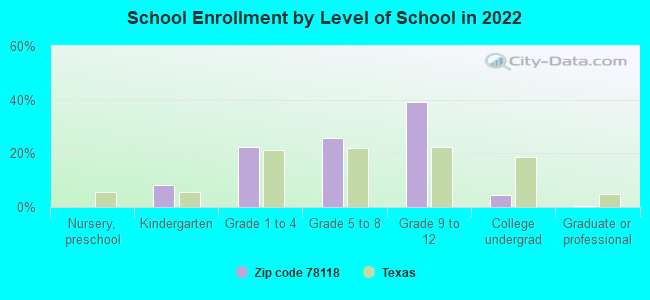
Private vs. public school enrollment:
Students in private schools in grades 1 to 8 (elementary and middle school): 30
Here:
8.6%
Texas:
8.8%
Students in private schools in grades 9 to 12 (high school):
Here:
0.0%
Texas:
8.0%
Students in private undergraduate colleges:
Here:
0.0%
Texas:
16.2%
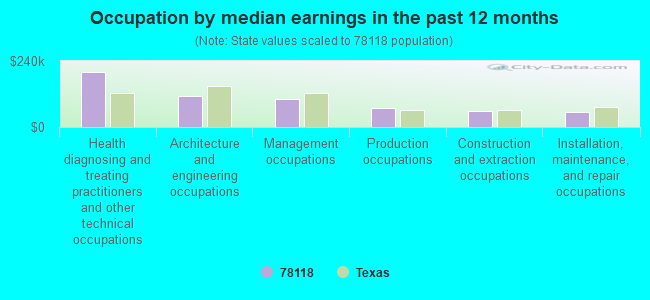
Occupation by median earnings in the past 12 months ($)
198,671Health diagnosing and treating practitioners and other technical occupations
113,055Architecture and engineering occupations
100,689Management occupations
67,346Production occupations
58,713Construction and extraction occupations
55,378Installation, maintenance, and repair occupations
Top industries in this zip code by the number of employees in 2005:
Administrative and Support and Waste Management and Remediation Services: Security Guards and Patrol Services (100-249 employees: 1 establishment)
Health Care and Social Assistance: Nursing Care Facilities (50-99: 2)
Construction: Highway, Street, and Bridge Construction (20-49: 1)
Utilities: Electric Power Distribution (20-49: 1)
Finance and Insurance: Commercial Banking (20-49: 1)
Health Care and Social Assistance: Child Day Care Services (10-19: 1, 5-9: 2)
Accommodation and Food Services: Limited-Service Restaurants (10-19: 1, 1-4: 4)
Accommodation and Food Services: Full-Service Restaurants (10-19: 1, 1-4: 1)
People in group quarters in 2010:
312 people in federal detention centers
109 people in nursing facilities/skilled-nursing facilities
People in group quarters in 2000:
520 people in other types of correctional institutions
99 people in nursing homes
12 people in local jails and other confinement facilities (including police lockups)
Fatal accident statistics in 2014:
Fatal accident count: 2
Vehicles involved in fatal accidents: 3
Fatal accidents caused by drunken drivers: 0
Fatalities: 2
Persons involved in fatal accidents: 3
Pedestrians involved in fatal accidents: 0
Fatal accident statistics in 2012:
Fatal accident count: 3
Vehicles involved in fatal accidents: 4
Fatal accidents caused by drunken drivers: 0
Fatalities: 4
Persons involved in fatal accidents: 21
Pedestrians involved in fatal accidents: 0
2002 - 2018 National Fire Incident Reporting System (NFIRS) incidents
Based on the data from the years 2002 - 2018 the average number of fires per year is 28. The highest number of fire incidents - 60 took place in 2018, and the least - 11 in 2007. The data has a growing trend.
When looking into fire subcategories, the most reports belonged to: Outside Fires (64.7%), and Structure Fires (19.7%).
Fire incident types reported to NFIRS in Zip Code 78118
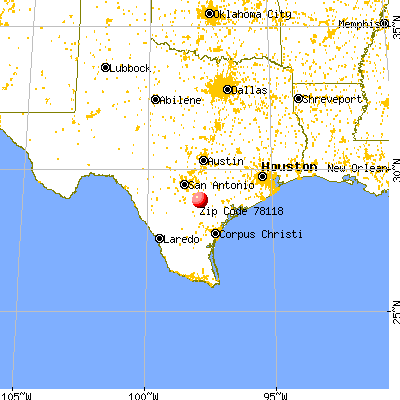


 Nearest zip codes: 78145, 78119, 78113, 78117, 78008, 78144.


 Based on the data from the years 2002 - 2018 the average number of fires per year is 28. The highest number of fire incidents - 60 took place in 2018, and the least - 11 in 2007. The data has a growing trend.
 When looking into fire subcategories, the most reports belonged to: Outside Fires (64.7%), and Structure Fires (19.7%).