Estimated zip code population in 2022: 3,048 Zip code population in 2010: 2,294 Zip code population in 2000: 2,301
Houses and condos: 1,185 Renter-occupied apartments: 106
% of renters here:
9%
State:
38%
March 2022 cost of living index in zip code 78152: 81.7 (low, U.S. average is 100)
Land area: 36.6 sq. mi. Water area: 0.3 sq. mi.
Population density: 83 people per square mile
(very low).
OSM Map
General Map
Google Map
MSN Map
OSM Map
General Map
Google Map
MSN Map
OSM Map
General Map
Google Map
MSN Map
OSM Map
General Map
Google Map
MSN Map
Please wait while loading the map...
Real estate property taxes paid for housing units in 2022:
This zip code:
1.3% ($4,235)
Texas:
1.5% ($4,050)
Median real estate property taxes paid for housing units with mortgages in 2022: $4,252 (1.2%) Median real estate property taxes paid for housing units with no mortgage in 2022: $4,333 (1.5%)
Business Search- 14 Million verified businesses
Males: 1,518
(49.8%)
Females: 1,530
(50.2%)
For population 25 years and over in 78152:
High school or higher: 98.0%
Bachelor's degree or higher: 36.8%
Graduate or professional degree: 13.6%
Unemployed: 1.2%
Mean travel time to work (commute): 29.8 minutes
For population 15 years and over in 78152:
Never married: 29.3%
Now married: 54.8%
Separated: 0.9%
Widowed: 4.4%
Divorced: 10.5%
Zip code 78152 compared to state average:
Median household income above state average.
Unemployed percentage significantly below state average.
Black race population percentage below state average.
Hispanic race population percentage below state average.
Median age above state average.
Foreign-born population percentage significantly below state average.
Renting percentage significantly below state average.
Length of stay since moving in significantly above state average.
Estimated median house/condo value in 2022: $328,513
78152:
$328,513
Texas:
$275,400
According to our research of Texas and other state lists, there were 5 registered sex offenders living in 78152 zip code as of May 29, 2024. The ratio of all residents to sex offenders in zip code 78152 is 442 to 1. The ratio of registered sex offenders to all residents in this zip code is near the state average.
Median resident age:
This zip code:
41.8 years
Texas median age:
35.6 years
Average household size:
This zip code:
2.7 people
Texas:
2.6 people
Averages for the 2020 tax year for zip code 78152, filed in 2021:
Average Adjusted Gross Income (AGI) in 2020: $70,945 (Individual Income Tax Returns)
Here:
$70,945
State:
$77,054
Salary/wage: $64,373 (reported on 84.6% of returns)
Here:
$64,373
State:
$62,766
(% of AGI for various income ranges: 1175.5% for AGIs below $25k, 3593.2% for AGIs $25k-50k, 6238.9% for AGIs $50k-75k, 9706.5% for AGIs $75k-100k, 16995.6% for AGIs $100k-200k, 51863.3% for AGIs over 200k)
Taxable interest for individuals: $765 (reported on 32.6% of returns)
This zip code:
$765
Texas:
$2,665
(% of AGI for various income ranges: 13.9% for AGIs below $25k, 13.6% for AGIs $25k-50k, 17.8% for AGIs $50k-75k, 13.0% for AGIs $75k-100k, 87.0% for AGIs $100k-200k, 426.7% for AGIs over 200k)
Ordinary dividends: $2,637 (reported on 13.2% of returns)
Here:
$2,637
State:
$10,044
(% of AGI for various income ranges: 20.0% for AGIs below $25k, 17.7% for AGIs $25k-50k, 25.0% for AGIs $50k-75k, 25.0% for AGIs $75k-100k, 58.1% for AGIs $100k-200k, 1133.3% for AGIs over 200k)
Net capital gain/loss in AGI: +$10,160 (reported on 13.2% of returns)
Here:
+$10,160
State:
+$39,590
(% of AGI for various income ranges: 47.7% for AGIs $25k-50k, 39.2% for AGIs $50k-75k, 106.0% for AGIs $75k-100k, 403.3% for AGIs $100k-200k, 4656.7% for AGIs over 200k)
Profit/loss from business: +$6,494 (reported on 15.9% of returns)
Here:
+$6,494
State:
+$10,888
(% of AGI for various income ranges: 53.9% for AGIs below $25k, 28.0% for AGIs $25k-50k, 155.6% for AGIs $50k-75k, 160.0% for AGIs $75k-100k, 418.5% for AGIs $100k-200k)
Taxable individual retirement arrangement distribution: $13,153 (reported on 7.5% of returns)
78152:
$13,153
Texas:
$24,740
(% of AGI for various income ranges: 42.9% for AGIs below $25k, 103.0% for AGIs $25k-50k, 84.2% for AGIs $50k-75k, 167.0% for AGIs $75k-100k, 364.1% for AGIs $100k-200k)
Total itemized deductions: $30,519 (reported on 7.0% of returns)
Here:
$30,519
State:
$40,428
(% of AGI for various income ranges: 139.8% for AGIs $25k-50k, 315.8% for AGIs $50k-75k, 401.5% for AGIs $75k-100k, 587.0% for AGIs $100k-200k, 2476.7% for AGIs over 200k)
Charity contributions: $9,867 (reported on 5.3% of returns)
Here:
$9,867
State:
$18,201
(% of AGI for various income ranges: 95.3% for AGIs $50k-75k, 311.5% for AGIs $100k-200k)
Taxes paid: $6,294 (reported on 7.0% of returns)
78152:
$6,294
State:
$7,821
(% of AGI for various income ranges: 76.9% for AGIs $50k-75k, 90.0% for AGIs $75k-100k, 141.9% for AGIs $100k-200k, 556.7% for AGIs over 200k)
Earned income credit: $2,196 (reported on 12.3% of returns)
Here:
$2,196
State:
$2,584
(% of AGI for various income ranges: 86.1% for AGIs below $25k, 65.5% for AGIs $25k-50k)
Percentage of individuals using paid preparers for their 2020 taxes: 93.0%
Here:
93%
State:
92%
(% for various income ranges: 90.2% for AGIs below $25k, 94.3% for AGIs $25k-50k, 93.3% for AGIs $50k-75k, 92.6% for AGIs $75k-100k, 93.2% for AGIs $100k-200k, 100.0% for AGIs over 200k)
Averages for the 2012 tax year for zip code 78152, filed in 2013:
Average Adjusted Gross Income (AGI) in 2012: $63,492 (Individual Income Tax Returns)
Here:
$63,492
State:
$65,384
Salary/wage: $55,418 (reported on 82.3% of returns)
Here:
$55,418
State:
$52,524
(% of AGI for various income ranges: 69.5% for AGIs below $25k, 74.3% for AGIs $25k-50k, 72.9% for AGIs $50k-75k, 74.7% for AGIs $75k-100k, 77.4% for AGIs $100k-200k, 51.2% for AGIs over 200k)
Taxable interest for individuals: $919 (reported on 42.5% of returns)
This zip code:
$919
Texas:
$2,372
(% of AGI for various income ranges: 1.3% for AGIs below $25k, 0.9% for AGIs $25k-50k, 0.8% for AGIs $50k-75k, 0.7% for AGIs $75k-100k, 0.5% for AGIs $100k-200k)
Ordinary dividends: $2,258 (reported on 16.8% of returns)
Here:
$2,258
State:
$9,721
(% of AGI for various income ranges: 0.5% for AGIs below $25k, 0.3% for AGIs $25k-50k, 1.2% for AGIs $50k-75k, 0.3% for AGIs $75k-100k, 0.8% for AGIs $100k-200k)
Net capital gain/loss in AGI: +$6,844 (reported on 14.2% of returns)
Here:
+$6,844
State:
+$35,319
(% of AGI for various income ranges: 0.8% for AGIs $50k-75k, 4.0% for AGIs $100k-200k)
Profit/loss from business: +$9,365 (reported on 17.7% of returns)
Here:
+$9,365
State:
+$13,732
(% of AGI for various income ranges: 7.1% for AGIs below $25k, 1.0% for AGIs $25k-50k, 3.8% for AGIs $50k-75k, 1.3% for AGIs $75k-100k, 3.6% for AGIs $100k-200k)
Taxable individual retirement arrangement distribution: $10,500 (reported on 11.5% of returns)
78152:
$10,500
Texas:
$19,511
(% of AGI for various income ranges: 3.8% for AGIs below $25k, 2.6% for AGIs $25k-50k, 3.2% for AGIs $50k-75k, 2.4% for AGIs $100k-200k)
Total itemized deductions: $19,654 (18% of AGI, reported on 24.8% of returns)
Here:
$19,654
State:
$24,724
Here:
17.6% of AGI
State:
15.9% of AGI
(% of AGI for various income ranges: 9.0% for AGIs $25k-50k, 8.6% for AGIs $50k-75k, 10.4% for AGIs $75k-100k, 9.6% for AGIs $100k-200k)
Charity contributions: $3,277 (reported on 19.5% of returns)
Here:
$3,277
State:
$6,808
(% of AGI for various income ranges: 0.7% for AGIs $25k-50k, 1.2% for AGIs $50k-75k, 1.1% for AGIs $75k-100k, 1.5% for AGIs $100k-200k)
Taxes paid: $6,314 (reported on 24.8% of returns)
78152:
$6,314
State:
$6,921
(% of AGI for various income ranges: 2.3% for AGIs $25k-50k, 2.6% for AGIs $50k-75k, 3.1% for AGIs $75k-100k, 3.5% for AGIs $100k-200k)
Earned income credit: $1,877 (reported on 11.5% of returns)
Here:
$1,877
State:
$2,570
(% of AGI for various income ranges: 4.6% for AGIs below $25k, 0.6% for AGIs $25k-50k)
Percentage of individuals using paid preparers for their 2012 taxes: 49.6%
Here:
50%
State:
51%
(% for various income ranges: 41.2% for AGIs below $25k, 46.2% for AGIs $25k-50k, 55.6% for AGIs $50k-75k, 53.8% for AGIs $75k-100k, 55.0% for AGIs $100k-200k, 100.0% for AGIs over 200k)
Averages for the 2004 tax year for zip code 78152, filed in 2005:
Average Adjusted Gross Income (AGI) in 2004: $47,306 (Individual Income Tax Returns)
Here:
$47,306
State:
$47,881
Salary/wage: $45,235 (reported on 82.5% of returns)
Here:
$45,235
State:
$41,947
(% of AGI for various income ranges: 88.9% for AGIs below $10k, 72.2% for AGIs $10k-25k, 83.6% for AGIs $25k-50k, 77.5% for AGIs $50k-75k, 85.1% for AGIs $75k-100k, 74.5% for AGIs over 100k)
Taxable interest for individuals: $911 (reported on 51.7% of returns)
This zip code:
$911
Texas:
$2,255
(% of AGI for various income ranges: 6.2% for AGIs below $10k, 3.5% for AGIs $10k-25k, 0.9% for AGIs $25k-50k, 1.0% for AGIs $50k-75k, 0.7% for AGIs $75k-100k, 0.4% for AGIs over 100k)
Taxable dividends: $907 (reported on 18.8% of returns)
Here:
$907
State:
$4,261
(% of AGI for various income ranges: 1.0% for AGIs below $10k, 0.9% for AGIs $10k-25k, 0.2% for AGIs $25k-50k, 0.4% for AGIs $50k-75k, 0.3% for AGIs $75k-100k, 0.2% for AGIs over 100k)
Net capital gain/loss: +$5,000 (reported on 15.5% of returns)
Here:
+$5,000
State:
+$16,110
(% of AGI for various income ranges: -2.8% for AGIs below $10k, 1.6% for AGIs $10k-25k, 0.6% for AGIs $25k-50k, 0.8% for AGIs $50k-75k, 1.8% for AGIs $75k-100k, 2.9% for AGIs over 100k)
Profit/loss from business: +$7,613 (reported on 18.4% of returns)
Here:
+$7,613
State:
+$11,013
(% of AGI for various income ranges: 6.4% for AGIs below $10k, 6.0% for AGIs $10k-25k, 2.1% for AGIs $25k-50k, 4.7% for AGIs $50k-75k, 2.3% for AGIs $75k-100k, 1.7% for AGIs over 100k)
IRA payment deduction: $2,476 (reported on 1.9% of returns)
78152:
$2,476
Texas:
$3,120
Total itemized deductions: $15,259 (18% of AGI, reported on 22.4% of returns)
Here:
$15,259
State:
$19,631
Here:
18.3% of AGI
State:
18.9% of AGI
(% of AGI for various income ranges: 5.1% for AGIs $10k-25k, 9.4% for AGIs $25k-50k, 7.5% for AGIs $50k-75k, 8.0% for AGIs $75k-100k, 6.3% for AGIs over 100k)
Charity contributions deductions: $2,441 (3% of AGI, reported on 18.7% of returns)
Here:
$2,441
State:
$4,753
Here:
2.8% of AGI
State:
4.2% of AGI
(% of AGI for various income ranges: 1.1% for AGIs below $10k, 1.0% for AGIs $25k-50k, 0.8% for AGIs $50k-75k, 1.3% for AGIs $75k-100k, 1.1% for AGIs over 100k)
Total tax: $7,373 (reported on 77.6% of returns)
78152:
$7,373
State:
$9,058
(% of AGI for various income ranges: 2.8% for AGIs below $10k, 4.7% for AGIs $10k-25k, 7.0% for AGIs $25k-50k, 8.7% for AGIs $50k-75k, 10.6% for AGIs $75k-100k, 20.7% for AGIs over 100k)
Earned income credit: $1,533 (reported on 9.9% of returns)
Here:
$1,533
State:
$2,024
Percentage of individuals using paid preparers for their 2004 taxes: 57.3%
Here:
57%
State:
57%
(% for various income ranges: 56.5% for AGIs below $10k, 58.9% for AGIs $10k-25k, 55.0% for AGIs $25k-50k, 56.2% for AGIs $50k-75k, 57.6% for AGIs $75k-100k, 64.0% for AGIs over 100k)
Household received Food Stamps/SNAP in the past 12 months: 0 Household did not receive Food Stamps/SNAP in the past 12 months: 1,115
Women who had a birth in the past 12 months: 87 (24 now married, 61 unmarried) Women who did not have a birth in the past 12 months: 729 (362 now married, 365 unmarried)
Housing units in zip code 78152 with a mortgage: 429 (25 second mortgage, 27 both second mortgage and home equity loan) Houses without a mortgage: 5
Median monthly owner costs for units with a mortgage: $1,872 Median monthly owner costs for units without a mortgage: $826
Residents with income below the poverty level in 2022:
This zip code:
6.2%
Whole state:
14.0%
Residents with income below 50% of the poverty level in 2022:
This zip code:
5.1%
Whole state:
7.4%
Median number of rooms in houses and condos:
Here:
6.0
State:
6.3
Median number of rooms in apartments:
Here:
6.9
State:
4.0
Notable locations in this zip code not listed on our city pages
Notable locations in zip code 78152: Herman Brown Free Library (A), Oakalla Public Library (B), Saint Hedwig Volunteer Fire Department (C). Display/hide their locations on the map
Size of family households: 323 2-persons, 73 3-persons, 266 4-persons, 54 5-persons, 41 6-persons, 9 7-or-more-persons
Size of nonfamily households: 296 1-person, 47 2-persons, 5 3-persons
460 married couples with children.
0 single-parent households ().
92.0% of residents of 78152 zip code speak English at home.
8.1% of residents speak Spanish at home (69% very well, 28% well, 3% not at all).
Foreign born population: 200 (6.6%) (44.6% of them are naturalized citizens)
This zip code:
6.6%
Whole state:
17.2%
48%Honduras
29%France
10%Malaysia
5%Denmark
2%Taiwan
16%Polish
12%German
7%American
6%Irish
2%Italian
2%Dutch
2%European
Year of entry for the foreign-born population
402010 or later
702000 to 2009
141990 to 1999
94Before 1990
Housing units lacking complete kitchen facilities: 1.3%
66.9%Electricity
21.4%Bottled, tank, or LP gas
10.7%Utility gas
0.9%Other fuel
Population in 1990: 1,685. Population change in the 1990s: +616 (+36.6%).
Place of birth for U.S.-born residents:
This state: 2,224
Northeast: 42
Midwest: 151
South: 247
West: 136
62% of the 78152 zip code residents lived in the same house 5 years ago. Out of people who lived in different houses, 70% lived in this county. Out of people who lived in different counties, 50% lived in Texas.
90% of the 78152 zip code residents lived in the same house 1 year ago. Out of people who lived in different houses, 16% moved from this county. Out of people who lived in different houses, 87% moved from different county within same state.
Private vs. public school enrollment:
Students in private schools in grades 1 to 8 (elementary and middle school): 24
Here:
16.7%
Texas:
8.8%
Students in private schools in grades 9 to 12 (high school): 30
Here:
15.6%
Texas:
8.0%
Students in private undergraduate colleges: 33
Here:
18.5%
Texas:
16.2%
Occupation by median earnings in the past 12 months ($)
78,303Architecture and engineering occupations
73,820Business and financial operations occupations
72,071Sales and related occupations
59,818Education, training, and library occupations
47,520Production occupations
43,217Computer and mathematical occupations
Top industries in this zip code by the number of employees in 2005:
Other Services (except Public Administration): General Automotive Repair (5-9: 1)
Administrative and Support and Waste Management and Remediation Services: Exterminating and Pest Control Services (5-9: 1)
Other Services (except Public Administration): Commercial and Industrial Machinery and Equipment (except Automotive and Electronic) Repair and Maintenance (1-4: 2)
Fatal accident statistics in 2014:
Fatal accident count: 1
Vehicles involved in fatal accidents: 2
Fatal accidents caused by drunken drivers: 0
Fatalities: 1
Persons involved in fatal accidents: 3
Pedestrians involved in fatal accidents: 0
Fatal accident statistics in 2013:
Fatal accident count: 1
Vehicles involved in fatal accidents: 2
Fatal accidents caused by drunken drivers: 0
Fatalities: 1
Persons involved in fatal accidents: 5
Pedestrians involved in fatal accidents: 0
Home Mortgage Disclosure Act Aggregated Statistics For Year 2009 (Based on 2 partial tracts)
A) FHA, FSA/RHS & VA Home Purchase Loans
B) Conventional Home Purchase Loans
C) Refinancings
D) Home Improvement Loans
F) Non-occupant Loans on < 5 Family Dwellings (A B C & D)
G) Loans On Manufactured Home Dwelling (A B C & D)
Number
Average Value
Number
Average Value
Number
Average Value
Number
Average Value
Number
Average Value
Number
Average Value
LOANS ORIGINATED
9
$169,822
12
$130,872
59
$141,202
11
$83,622
3
$68,553
6
$71,980
APPLICATIONS APPROVED, NOT ACCEPTED
0
$0
4
$167,095
10
$120,963
5
$13,462
1
$147,700
4
$63,332
APPLICATIONS DENIED
1
$125,260
8
$77,705
44
$132,147
12
$50,012
1
$47,670
11
$77,334
APPLICATIONS WITHDRAWN
1
$129,000
2
$110,305
17
$130,322
4
$66,138
0
$0
6
$94,727
FILES CLOSED FOR INCOMPLETENESS
1
$81,330
0
$0
4
$151,438
0
$0
0
$0
1
$61,700
Aggregated Statistics For Year 2008 (Based on 2 partial tracts)
A) FHA, FSA/RHS & VA Home Purchase Loans
B) Conventional Home Purchase Loans
C) Refinancings
D) Home Improvement Loans
F) Non-occupant Loans on < 5 Family Dwellings (A B C & D)
G) Loans On Manufactured Home Dwelling (A B C & D)
Number
Average Value
Number
Average Value
Number
Average Value
Number
Average Value
Number
Average Value
Number
Average Value
LOANS ORIGINATED
18
$166,291
27
$169,337
42
$129,826
18
$47,779
3
$33,030
15
$71,419
APPLICATIONS APPROVED, NOT ACCEPTED
1
$33,650
6
$55,308
14
$117,651
7
$28,979
3
$57,333
6
$50,635
APPLICATIONS DENIED
4
$131,105
10
$77,214
67
$98,587
34
$32,718
7
$79,591
26
$78,595
APPLICATIONS WITHDRAWN
2
$172,470
5
$116,102
31
$105,994
4
$35,990
2
$39,260
4
$70,810
FILES CLOSED FOR INCOMPLETENESS
1
$177,610
3
$98,153
4
$60,060
1
$37,390
0
$0
1
$67,310
Aggregated Statistics For Year 2007 (Based on 2 partial tracts)
A) FHA, FSA/RHS & VA Home Purchase Loans
B) Conventional Home Purchase Loans
C) Refinancings
D) Home Improvement Loans
F) Non-occupant Loans on < 5 Family Dwellings (A B C & D)
G) Loans On Manufactured Home Dwelling (A B C & D)
Number
Average Value
Number
Average Value
Number
Average Value
Number
Average Value
Number
Average Value
Number
Average Value
LOANS ORIGINATED
6
$96,752
62
$135,275
65
$147,799
22
$51,541
6
$136,948
20
$74,036
APPLICATIONS APPROVED, NOT ACCEPTED
2
$101,425
7
$96,419
15
$105,570
8
$76,186
1
$79,460
7
$50,079
APPLICATIONS DENIED
2
$89,275
23
$123,922
42
$107,302
30
$36,893
3
$403,523
18
$49,700
APPLICATIONS WITHDRAWN
0
$0
3
$49,233
31
$128,852
8
$63,450
0
$0
1
$35,520
FILES CLOSED FOR INCOMPLETENESS
0
$0
0
$0
11
$160,615
2
$79,925
0
$0
0
$0
Aggregated Statistics For Year 2006 (Based on 2 partial tracts)
A) FHA, FSA/RHS & VA Home Purchase Loans
B) Conventional Home Purchase Loans
C) Refinancings
D) Home Improvement Loans
F) Non-occupant Loans on < 5 Family Dwellings (A B C & D)
G) Loans On Manufactured Home Dwelling (A B C & D)
Number
Average Value
Number
Average Value
Number
Average Value
Number
Average Value
Number
Average Value
Number
Average Value
LOANS ORIGINATED
17
$125,153
68
$113,303
56
$107,235
18
$28,667
14
$103,429
18
$67,721
APPLICATIONS APPROVED, NOT ACCEPTED
2
$78,055
24
$97,180
13
$148,418
4
$10,282
3
$180,103
11
$47,930
APPLICATIONS DENIED
4
$79,692
45
$115,334
70
$97,727
30
$44,060
15
$111,117
32
$60,791
APPLICATIONS WITHDRAWN
1
$89,740
19
$103,222
57
$116,194
9
$70,941
6
$81,640
2
$87,405
FILES CLOSED FOR INCOMPLETENESS
1
$148,630
2
$82,260
4
$134,145
0
$0
0
$0
0
$0
Aggregated Statistics For Year 2005 (Based on 2 partial tracts)
A) FHA, FSA/RHS & VA Home Purchase Loans
B) Conventional Home Purchase Loans
C) Refinancings
D) Home Improvement Loans
F) Non-occupant Loans on < 5 Family Dwellings (A B C & D)
G) Loans On Manufactured Home Dwelling (A B C & D)
Number
Average Value
Number
Average Value
Number
Average Value
Number
Average Value
Number
Average Value
Number
Average Value
LOANS ORIGINATED
13
$139,142
80
$91,786
79
$116,968
21
$56,533
15
$51,788
29
$68,853
APPLICATIONS APPROVED, NOT ACCEPTED
0
$0
31
$81,478
22
$89,231
9
$21,500
1
$67,310
18
$62,008
APPLICATIONS DENIED
2
$100,490
62
$77,935
92
$112,257
26
$43,612
15
$99,712
47
$57,361
APPLICATIONS WITHDRAWN
2
$209,395
7
$123,394
43
$119,350
9
$165,356
4
$139,285
4
$73,148
FILES CLOSED FOR INCOMPLETENESS
1
$28,980
11
$129,173
26
$142,701
1
$71,040
0
$0
0
$0
Aggregated Statistics For Year 2004 (Based on 2 partial tracts)
A) FHA, FSA/RHS & VA Home Purchase Loans
B) Conventional Home Purchase Loans
C) Refinancings
D) Home Improvement Loans
E) Loans on Dwellings For 5+ Families
F) Non-occupant Loans on < 5 Family Dwellings (A B C & D)
G) Loans On Manufactured Home Dwelling (A B C & D)
Number
Average Value
Number
Average Value
Number
Average Value
Number
Average Value
Number
Average Value
Number
Average Value
Number
Average Value
LOANS ORIGINATED
7
$126,064
57
$95,678
123
$96,725
18
$48,973
1
$131,810
5
$56,088
28
$66,137
APPLICATIONS APPROVED, NOT ACCEPTED
0
$0
10
$47,301
20
$74,410
7
$88,271
0
$0
1
$38,330
15
$55,340
APPLICATIONS DENIED
2
$87,405
42
$58,269
95
$88,737
20
$27,296
0
$0
5
$78,898
44
$55,344
APPLICATIONS WITHDRAWN
2
$86,935
1
$46,740
57
$101,614
6
$35,678
0
$0
1
$66,370
4
$107,502
FILES CLOSED FOR INCOMPLETENESS
0
$0
1
$168,260
22
$111,879
1
$46,740
0
$0
0
$0
0
$0
Aggregated Statistics For Year 2003 (Based on 2 partial tracts)
A) FHA, FSA/RHS & VA Home Purchase Loans
B) Conventional Home Purchase Loans
C) Refinancings
D) Home Improvement Loans
F) Non-occupant Loans on < 5 Family Dwellings (A B C & D)
Number
Average Value
Number
Average Value
Number
Average Value
Number
Average Value
Number
Average Value
LOANS ORIGINATED
7
$90,676
56
$91,377
181
$100,421
17
$30,904
10
$82,636
APPLICATIONS APPROVED, NOT ACCEPTED
1
$110,310
16
$52,758
18
$82,886
2
$25,240
2
$64,500
APPLICATIONS DENIED
2
$86,935
34
$53,724
105
$91,664
22
$33,398
5
$76,092
APPLICATIONS WITHDRAWN
4
$90,442
6
$80,705
50
$91,293
6
$30,693
1
$58,890
FILES CLOSED FOR INCOMPLETENESS
1
$86,000
0
$0
6
$77,122
0
$0
1
$52,350
Aggregated Statistics For Year 2002 (Based on 2 partial tracts)
A) FHA, FSA/RHS & VA Home Purchase Loans
B) Conventional Home Purchase Loans
C) Refinancings
D) Home Improvement Loans
F) Non-occupant Loans on < 5 Family Dwellings (A B C & D)
Number
Average Value
Number
Average Value
Number
Average Value
Number
Average Value
Number
Average Value
LOANS ORIGINATED
22
$108,479
62
$91,761
114
$91,364
16
$33,127
3
$55,777
APPLICATIONS APPROVED, NOT ACCEPTED
0
$0
17
$61,422
18
$64,501
0
$0
2
$61,230
APPLICATIONS DENIED
3
$53,597
41
$51,118
50
$87,647
17
$27,439
5
$31,784
APPLICATIONS WITHDRAWN
3
$142,713
7
$96,951
29
$85,937
2
$42,065
0
$0
FILES CLOSED FOR INCOMPLETENESS
1
$111,240
2
$141,620
12
$86,858
1
$46,740
0
$0
Aggregated Statistics For Year 2001 (Based on 2 partial tracts)
A) FHA, FSA/RHS & VA Home Purchase Loans
B) Conventional Home Purchase Loans
C) Refinancings
D) Home Improvement Loans
F) Non-occupant Loans on < 5 Family Dwellings (A B C & D)
Number
Average Value
Number
Average Value
Number
Average Value
Number
Average Value
Number
Average Value
LOANS ORIGINATED
18
$100,387
73
$84,158
81
$82,112
22
$34,545
15
$72,042
APPLICATIONS APPROVED, NOT ACCEPTED
2
$86,000
23
$52,267
25
$80,542
3
$43,623
1
$33,650
APPLICATIONS DENIED
1
$111,240
65
$51,673
35
$72,647
26
$18,696
7
$20,566
APPLICATIONS WITHDRAWN
2
$78,990
7
$79,859
22
$71,215
3
$28,043
0
$0
FILES CLOSED FOR INCOMPLETENESS
0
$0
1
$67,310
3
$73,227
0
$0
0
$0
Aggregated Statistics For Year 2000 (Based on 2 partial tracts)
A) FHA, FSA/RHS & VA Home Purchase Loans
B) Conventional Home Purchase Loans
C) Refinancings
D) Home Improvement Loans
F) Non-occupant Loans on < 5 Family Dwellings (A B C & D)
Number
Average Value
Number
Average Value
Number
Average Value
Number
Average Value
Number
Average Value
LOANS ORIGINATED
15
$92,109
96
$74,190
47
$84,808
24
$35,990
11
$45,210
APPLICATIONS APPROVED, NOT ACCEPTED
0
$0
52
$49,724
9
$80,081
5
$29,914
1
$50,480
APPLICATIONS DENIED
3
$45,183
136
$47,854
22
$49,417
21
$21,011
3
$24,303
APPLICATIONS WITHDRAWN
1
$79,460
15
$90,115
16
$71,629
3
$47,363
1
$20,570
FILES CLOSED FOR INCOMPLETENESS
0
$0
5
$76,654
8
$89,040
0
$0
0
$0
Aggregated Statistics For Year 1999 (Based on 1 partial tract)
A) FHA, FSA/RHS & VA Home Purchase Loans
B) Conventional Home Purchase Loans
C) Refinancings
D) Home Improvement Loans
F) Non-occupant Loans on < 5 Family Dwellings (A B C & D)
Detailed PMIC statistics for the following Tracts:1318.00
2003 - 2018 National Fire Incident Reporting System (NFIRS) incidents
According to the data from the years 2003 - 2018 the average number of fire incidents per year is 33. The highest number of fire incidents - 106 took place in 2017, and the least - 0 in 2014. The data has a decreasing trend.
When looking into fire subcategories, the most incidents belonged to: Outside Fires (65.5%), and Structure Fires (18.4%).
Fire incident types reported to NFIRS in Zip Code 78152

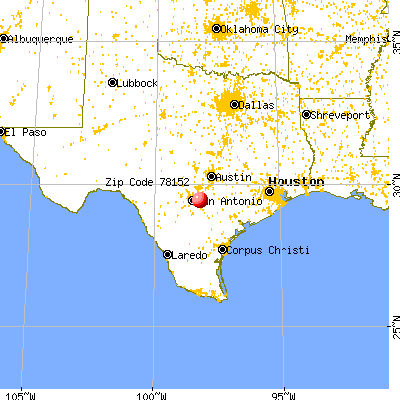


 Nearest zip codes: 78101, 78109, 78150, 78263, 78154, 78121.


 According to the data from the years 2003 - 2018 the average number of fire incidents per year is 33. The highest number of fire incidents - 106 took place in 2017, and the least - 0 in 2014. The data has a decreasing trend.
 When looking into fire subcategories, the most incidents belonged to: Outside Fires (65.5%), and Structure Fires (18.4%).