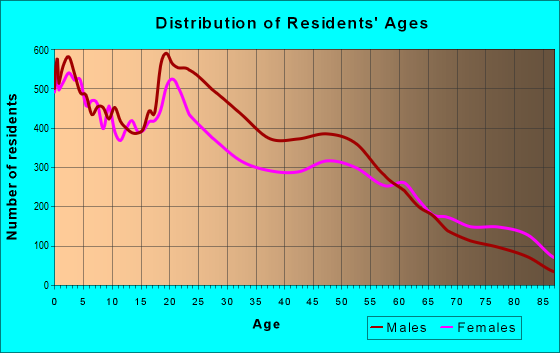
Estimated zip code population in 2022: 52,762 Zip code population in 2010: 55,514 Zip code population in 2000: 56,348
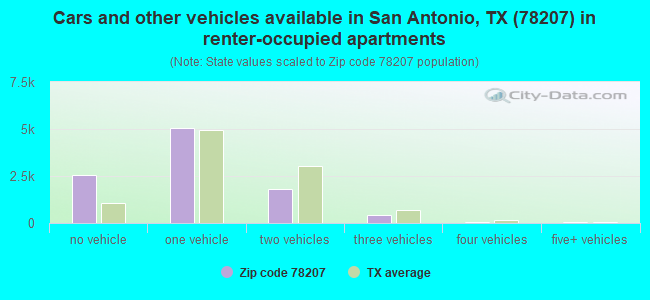
Houses and condos: 19,495 Renter-occupied apartments: 9,892
% of renters here:
56%
State:
38%
March 2022 cost of living index in zip code 78207: 86.5 (less than average, U.S. average is 100)
Land area: 7.3 sq. mi. Water area: 0.3 sq. mi.
Population density: 7,261 people per square mile
(high).
OSM Map
General Map
Google Map
MSN Map
OSM Map
General Map
Google Map
MSN Map
OSM Map
General Map
Google Map
MSN Map
OSM Map
General Map
Google Map
MSN Map
Please wait while loading the map...
Real estate property taxes paid for housing units in 2022:
This zip code:
1.2% ($1,217)
Texas:
1.5% ($4,050)
Median real estate property taxes paid for housing units with mortgages in 2022: $1,935 (1.7%) Median real estate property taxes paid for housing units with no mortgage in 2022: $976 (1.1%)
Averages for the 2020 tax year for zip code 78207, filed in 2021:
Average Adjusted Gross Income (AGI) in 2020: $28,218 (Individual Income Tax Returns)
Here:
$28,218
State:
$77,054
Salary/wage: $25,978 (reported on 81.2% of returns)
Here:
$25,978
State:
$62,766
(% of AGI for various income ranges: 1053.8% for AGIs below $25k, 3409.0% for AGIs $25k-50k, 6461.2% for AGIs $50k-75k, 9247.7% for AGIs $75k-100k, 14910.6% for AGIs $100k-200k)
Taxable interest for individuals: $675 (reported on 6.4% of returns)
This zip code:
$675
Texas:
$2,665
(% of AGI for various income ranges: 2.6% for AGIs below $25k, 4.1% for AGIs $25k-50k, 12.5% for AGIs $50k-75k, 34.5% for AGIs $75k-100k, 40.0% for AGIs $100k-200k)
Ordinary dividends: $2,387 (reported on 1.6% of returns)
Here:
$2,387
State:
$10,044
(% of AGI for various income ranges: 0.6% for AGIs below $25k, 1.4% for AGIs $25k-50k, 2.3% for AGIs $50k-75k, 15.2% for AGIs $75k-100k, 306.5% for AGIs $100k-200k)
Net capital gain/loss in AGI: +$8,050 (reported on 1.6% of returns)
Here:
+$8,050
State:
+$39,590
(% of AGI for various income ranges: 0.9% for AGIs below $25k, 3.5% for AGIs $25k-50k, 20.7% for AGIs $50k-75k, 39.0% for AGIs $75k-100k, 1062.4% for AGIs $100k-200k)
Profit/loss from business: +$9,066 (reported on 21.0% of returns)
Here:
+$9,066
State:
+$10,888
(% of AGI for various income ranges: 282.9% for AGIs below $25k, 144.6% for AGIs $25k-50k, 199.9% for AGIs $50k-75k, 290.3% for AGIs $75k-100k, 745.9% for AGIs $100k-200k)
Taxable individual retirement arrangement distribution: $11,628 (reported on 1.5% of returns)
78207:
$11,628
Texas:
$24,740
(% of AGI for various income ranges: 6.4% for AGIs below $25k, 11.6% for AGIs $25k-50k, 62.7% for AGIs $50k-75k, 137.7% for AGIs $75k-100k, 645.9% for AGIs $100k-200k)
Total itemized deductions: $26,640 (reported on 1.1% of returns)
Here:
$26,640
State:
$40,428
(% of AGI for various income ranges: 4.2% for AGIs below $25k, 34.7% for AGIs $25k-50k, 155.0% for AGIs $50k-75k, 850.0% for AGIs $100k-200k)
Charity contributions: $12,060 (reported on 0.8% of returns)
Here:
$12,060
State:
$18,201
(% of AGI for various income ranges: 9.8% for AGIs $25k-50k, 48.0% for AGIs $50k-75k, 448.2% for AGIs $100k-200k)
Taxes paid: $5,247 (reported on 0.9% of returns)
78207:
$5,247
State:
$7,821
(% of AGI for various income ranges: 0.9% for AGIs below $25k, 6.2% for AGIs $25k-50k, 27.7% for AGIs $50k-75k, 108.2% for AGIs $100k-200k)
Earned income credit: $2,954 (reported on 42.1% of returns)
Here:
$2,954
State:
$2,584
(% of AGI for various income ranges: 205.9% for AGIs below $25k, 115.0% for AGIs $25k-50k, 2.9% for AGIs $50k-75k)
Percentage of individuals using paid preparers for their 2020 taxes: 91.0%
Here:
91%
State:
92%
(% for various income ranges: 89.9% for AGIs below $25k, 93.1% for AGIs $25k-50k, 90.6% for AGIs $50k-75k, 90.5% for AGIs $75k-100k, 92.3% for AGIs $100k-200k, 100.0% for AGIs over 200k)
Averages for the 2012 tax year for zip code 78207, filed in 2013:
Average Adjusted Gross Income (AGI) in 2012: $22,942 (Individual Income Tax Returns)
Here:
$22,942
State:
$65,384
Salary/wage: $21,903 (reported on 84.9% of returns)
Here:
$21,903
State:
$52,524
(% of AGI for various income ranges: 76.6% for AGIs below $25k, 89.3% for AGIs $25k-50k, 85.8% for AGIs $50k-75k, 79.5% for AGIs $75k-100k, 76.5% for AGIs $100k-200k, 33.7% for AGIs over 200k)
Taxable interest for individuals: $839 (reported on 6.8% of returns)
This zip code:
$839
Texas:
$2,372
(% of AGI for various income ranges: 0.2% for AGIs below $25k, 0.2% for AGIs $25k-50k, 0.2% for AGIs $50k-75k, 0.3% for AGIs $75k-100k, 1.8% for AGIs over 200k)
Ordinary dividends: $2,497 (reported on 1.7% of returns)
Here:
$2,497
State:
$9,721
(% of AGI for various income ranges: 0.1% for AGIs $50k-75k, 0.5% for AGIs $75k-100k, 1.9% for AGIs $100k-200k)
Net capital gain/loss in AGI: +$3,632 (reported on 1.0% of returns)
Here:
+$3,632
State:
+$35,319
(% of AGI for various income ranges: 0.6% for AGIs $75k-100k, 2.4% for AGIs $100k-200k)
Profit/loss from business: +$9,762 (reported on 18.5% of returns)
Here:
+$9,762
State:
+$13,732
(% of AGI for various income ranges: 16.7% for AGIs below $25k, 2.1% for AGIs $25k-50k, 1.2% for AGIs $50k-75k, 1.8% for AGIs $75k-100k, 11.4% for AGIs $100k-200k)
Taxable individual retirement arrangement distribution: $6,941 (reported on 1.8% of returns)
78207:
$6,941
Texas:
$19,511
(% of AGI for various income ranges: 0.4% for AGIs below $25k, 0.6% for AGIs $25k-50k, 0.7% for AGIs $50k-75k, 2.0% for AGIs $75k-100k)
Total itemized deductions: $17,458 (27% of AGI, reported on 3.6% of returns)
Here:
$17,458
State:
$24,724
Here:
27.0% of AGI
State:
15.9% of AGI
(% of AGI for various income ranges: 1.0% for AGIs below $25k, 3.0% for AGIs $25k-50k, 4.5% for AGIs $50k-75k, 3.6% for AGIs $75k-100k, 12.4% for AGIs $100k-200k)
Charity contributions: $3,618 (reported on 2.4% of returns)
Here:
$3,618
State:
$6,808
(% of AGI for various income ranges: 0.4% for AGIs $25k-50k, 0.6% for AGIs $50k-75k, 0.7% for AGIs $75k-100k, 2.1% for AGIs $100k-200k)
Taxes paid: $3,876 (reported on 3.3% of returns)
78207:
$3,876
State:
$6,921
(% of AGI for various income ranges: 0.1% for AGIs below $25k, 0.6% for AGIs $25k-50k, 0.8% for AGIs $50k-75k, 0.8% for AGIs $75k-100k, 1.5% for AGIs $100k-200k, 2.5% for AGIs over 200k)
Earned income credit: $2,858 (reported on 49.0% of returns)
Here:
$2,858
State:
$2,570
(% of AGI for various income ranges: 13.6% for AGIs below $25k, 2.4% for AGIs $25k-50k)
Percentage of individuals using paid preparers for their 2012 taxes: 50.5%
Here:
50%
State:
51%
(% for various income ranges: 51.8% for AGIs below $25k, 46.9% for AGIs $25k-50k, 49.4% for AGIs $50k-75k, 47.8% for AGIs $75k-100k, 50.0% for AGIs $100k-200k, 100.0% for AGIs over 200k)
Averages for the 2004 tax year for zip code 78207, filed in 2005:
Average Adjusted Gross Income (AGI) in 2004: $18,819 (Individual Income Tax Returns)
Here:
$18,819
State:
$47,881
Salary/wage: $18,220 (reported on 86.8% of returns)
Here:
$18,220
State:
$41,947
(% of AGI for various income ranges: 80.8% for AGIs below $10k, 84.7% for AGIs $10k-25k, 88.2% for AGIs $25k-50k, 86.1% for AGIs $50k-75k, 76.5% for AGIs $75k-100k, 50.1% for AGIs over 100k)
Taxable interest for individuals: $850 (reported on 10.0% of returns)
This zip code:
$850
Texas:
$2,255
(% of AGI for various income ranges: 0.6% for AGIs below $10k, 0.2% for AGIs $10k-25k, 0.3% for AGIs $25k-50k, 0.3% for AGIs $50k-75k, 1.3% for AGIs $75k-100k, 3.0% for AGIs over 100k)
Taxable dividends: $1,169 (reported on 2.0% of returns)
Here:
$1,169
State:
$4,261
(% of AGI for various income ranges: 0.1% for AGIs below $10k, 0.0% for AGIs $10k-25k, 0.1% for AGIs $25k-50k, 0.1% for AGIs $50k-75k, 0.0% for AGIs $75k-100k, 1.8% for AGIs over 100k)
Net capital gain/loss: +$3,270 (reported on 1.3% of returns)
Here:
+$3,270
State:
+$16,110
(% of AGI for various income ranges: -0.1% for AGIs below $10k, 0.0% for AGIs $10k-25k, 0.2% for AGIs $25k-50k, 0.4% for AGIs $50k-75k, 0.5% for AGIs $75k-100k, 2.6% for AGIs over 100k)
Profit/loss from business: +$8,271 (reported on 13.1% of returns)
Here:
+$8,271
State:
+$11,013
(% of AGI for various income ranges: 15.3% for AGIs below $10k, 7.5% for AGIs $10k-25k, 2.1% for AGIs $25k-50k, 2.5% for AGIs $50k-75k, 10.2% for AGIs over 100k)
IRA payment deduction: $2,554 (reported on 0.3% of returns)
78207:
$2,554
Texas:
$3,120
Total itemized deductions: $13,273 (24% of AGI, reported on 2.0% of returns)
Here:
$13,273
State:
$19,631
Here:
24.4% of AGI
State:
18.9% of AGI
(% of AGI for various income ranges: 0.6% for AGIs below $10k, 0.6% for AGIs $10k-25k, 1.6% for AGIs $25k-50k, 3.1% for AGIs $50k-75k, 4.0% for AGIs $75k-100k, 4.1% for AGIs over 100k)
Charity contributions deductions: $3,000 (5% of AGI, reported on 1.6% of returns)
Here:
$3,000
State:
$4,753
Here:
5.1% of AGI
State:
4.2% of AGI
(% of AGI for various income ranges: 0.1% for AGIs below $10k, 0.1% for AGIs $10k-25k, 0.2% for AGIs $25k-50k, 0.5% for AGIs $50k-75k, 0.8% for AGIs $75k-100k, 1.7% for AGIs over 100k)
Total tax: $2,048 (reported on 49.7% of returns)
78207:
$2,048
State:
$9,058
(% of AGI for various income ranges: 2.9% for AGIs below $10k, 3.0% for AGIs $10k-25k, 5.4% for AGIs $25k-50k, 9.4% for AGIs $50k-75k, 11.9% for AGIs $75k-100k, 21.6% for AGIs over 100k)
Earned income credit: $2,240 (reported on 50.8% of returns)
Here:
$2,240
State:
$2,024
Percentage of individuals using paid preparers for their 2004 taxes: 69.3%
Here:
69%
State:
57%
(% for various income ranges: 67.7% for AGIs below $10k, 73.4% for AGIs $10k-25k, 63.2% for AGIs $25k-50k, 60.3% for AGIs $50k-75k, 60.2% for AGIs $75k-100k, 83.3% for AGIs over 100k)
Likely homosexual households (counted as self-reported same-sex unmarried-partner households)
Lesbian couples: 0.2% of all households
Gay men: 0.1% of all households
Household received Food Stamps/SNAP in the past 12 months: 7,894 Household did not receive Food Stamps/SNAP in the past 12 months: 9,985
Women who had a birth in the past 12 months: 682 (380 now married, 296 unmarried) Women who did not have a birth in the past 12 months: 10,398 (3,555 now married, 6,874 unmarried)
Housing units in zip code 78207 with a mortgage: 2,181 (14 second mortgage) Houses without a mortgage: 152
Median monthly owner costs for units with a mortgage: $1,040 Median monthly owner costs for units without a mortgage: $342
Residents with income below the poverty level in 2022:
This zip code:
42.5%
Whole state:
14.0%
Residents with income below 50% of the poverty level in 2022:
This zip code:
24.7%
Whole state:
7.4%
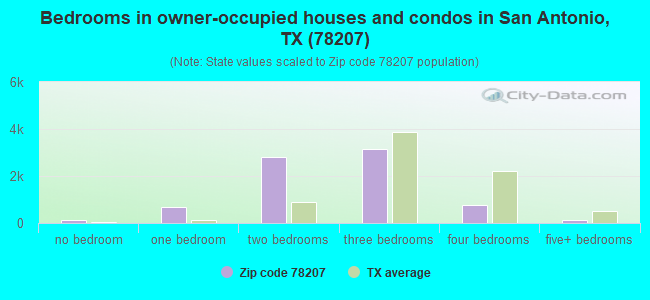
Median number of rooms in houses and condos:
Here:
5.2
State:
6.3
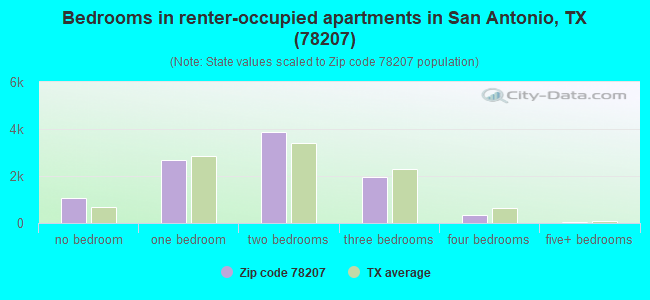
Median number of rooms in apartments:
Here:
3.9
State:
4.0
Notable locations in this zip code not listed on our city pages
Notable locations in zip code 78207: Produce Terminal Market (A), Union Stock Yards (B), International and Great Northern Railroad Passenger Station (C), Menger Soap Works Building (D), Worden School of Social Services (E), Bazan Branch Library San Antonio City Library (F), Inman Christian Center (G), Lady of the Lake Convent (H), Saint Martin Hall (I), Spanish Governors Palace (J), San Antonio Fire Department Station 8 (K), San Antonio Fire Department Station 11 (L), Esterella Medical Masters (M). Display/hide their locations on the map
Churches in zip code 78207 include: Prospect Hill Church of God (A), West End Church of the Nazarene (B), Spanish First Church of the Nazarene (C), West End Church of God in Christ (D), Wayfaring Church of God in Christ (E), Rivas Street Church of God in Christ (F), Templo Pentecostes Triunfo y Gloria Church (G), Spanish Pentecostal Church (H), Emanuel Pentecostal Church (I). Display/hide their locations on the map
Parks in zip code 78207 include: West End Park (1), San Juan Brady Park (2), Saint Timothy Park (3), Tobin Park (4), Columbus Park (5), Amistad Park (6), Apache Creek Park (7), Brady Park (8), Cassiano Park (9). Display/hide their locations on the map
Tourist attractions (not listed on the city page) : D & B Amusement CO Inc (1624 South San Marcos), ACH Travel & Tours (Tours & Charters; 727 Frio City Road).
3,516 married couples with children.
7,723 single-parent households (476 men, 7,247 women).
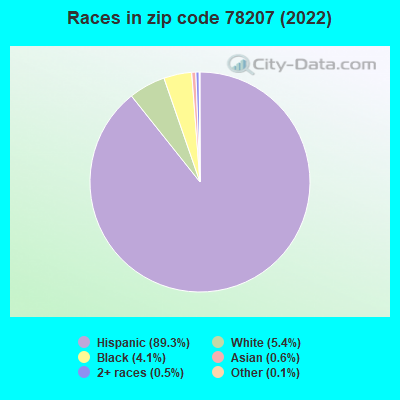
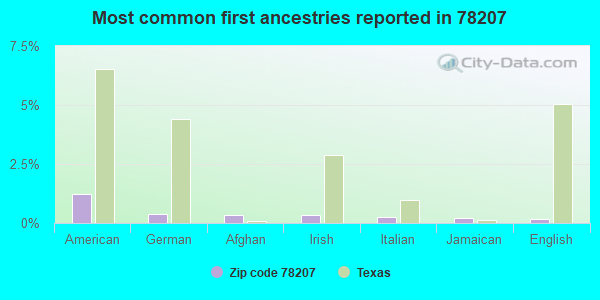
38.1% of residents of 78207 zip code speak English at home.
60.9% of residents speak Spanish at home (59% very well, 17% well, 15% not well, 9% not at all).
0.7% of residents speak other Indo-European language at home (50% very well, 15% well, 21% not well, 14% not at all).
0.2% of residents speak Asian or Pacific Island language at home (27% very well, 40% well, 30% not well, 2% not at all).
0.1% of residents speak other language at home (85% very well, 15% well).
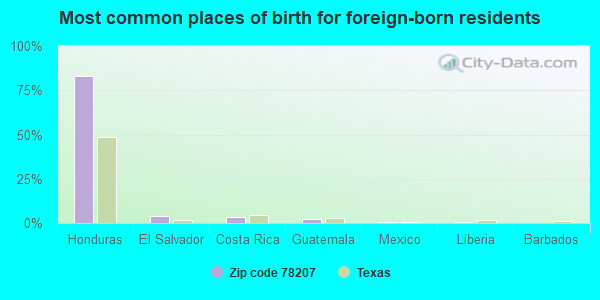
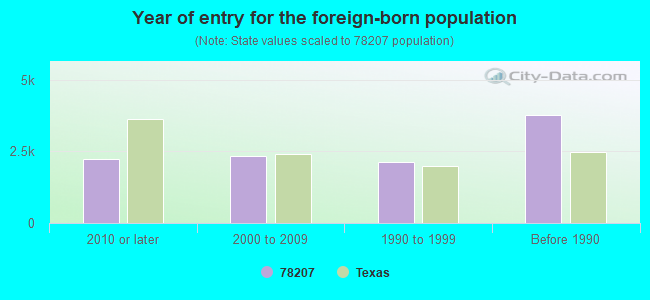
Foreign born population: 9,956 (18.9%) (30.3% of them are naturalized citizens)
Facilities with environmental interests located in this zip code:
ADELANTE ACAD (623 S PECOS in SAN ANTONIO, TX)
(Geographic Names Information System) (National Center for Education Statistics) - STATE ID-015907014 Organizations: SAN ANTONIO ISD (SCHOOL DISTRICT)
ALAMO ACHIEVEMENT CTR (1811 S LAREDO ST in SAN ANTONIO, TX)
(Geographic Names Information System) (National Center for Education Statistics) - STATE ID-015907010 Organizations: SAN ANTONIO ISD (SCHOOL DISTRICT)
Alternative names: ALAMO CENTER
ACME SOAP CO (218 SALTILLO ST in SAN ANTONIO, TX)
(Integrated Compliance Information System) - ICIS-06-1991-0041, FORMAL ENFORCEMENT ACTION COMPLIANCE ACTIVITY (Tracking inspections of insecticide, fungicide, and rodenticide, and toxic substances) Business SIC classification: SOAP AND OTHER DETERGENTS, EXCEPT SPECIALTY CLEANERS; SERVICE ESTABLISHMENT EQUIPMENT AND SUPPLIES
AFCO INC (1618 S ZARZAMORA ST in SAN ANTONIO, TX)
(Resource Conservation and Recovery Act (tracking hazardous waste)) Alternative names: AFCO NO 10602
AMERIPATH INC (301 N FRIO ST in SAN ANTONIO, TX)
Small Quantity Generators, between 100 kg and 1000 kg of hazardous waste/month (Resource Conservation and Recovery Act (tracking hazardous waste)) - notification Business NAICS classification: MEDICAL LABORATORIES. Organizations: AMERIPATH SAN ANTONIO (CONTACT/OPERATOR)
Alternative names: FOCUS DIRECT, PATHOLOGY AFFILIATED SERVICES
BADDERS GARAGE INC (520 N COLORADO in SAN ANTONIO, TX)
(Resource Conservation and Recovery Act (tracking hazardous waste)) Business NAICS classification: OTHER AUTOMOTIVE MECHANICAL AND ELECTRICAL REPAIR AND MAINTENANCE.
Housing units lacking complete plumbing facilities: 3.8% Housing units lacking complete kitchen facilities: 6.1%
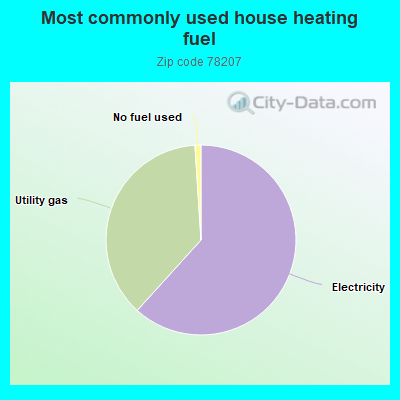
61.6%Electricity
37.2%Utility gas
1.0%No fuel used
Population in 1990: 58,355.
Place of birth for U.S.-born residents:
This state: 38,238
Northeast: 280
Midwest: 748
South: 940
West: 1,389
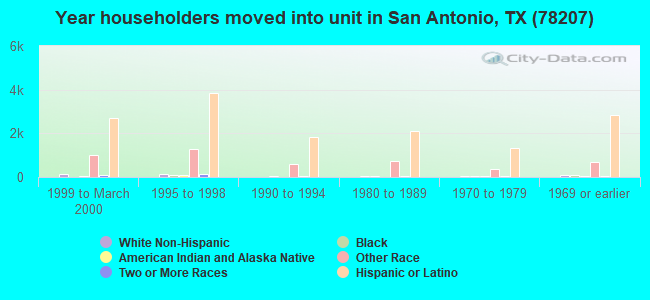
61% of the 78207 zip code residents lived in the same house 5 years ago. Out of people who lived in different houses, 86% lived in this county. Out of people who lived in different counties, 50% lived in Texas.
81% of the 78207 zip code residents lived in the same house 1 year ago. Out of people who lived in different houses, 68% moved from this county. Out of people who lived in different houses, 23% moved from different county within same state. Out of people who lived in different houses, 4% moved from different state. Out of people who lived in different houses, 1% moved from abroad.
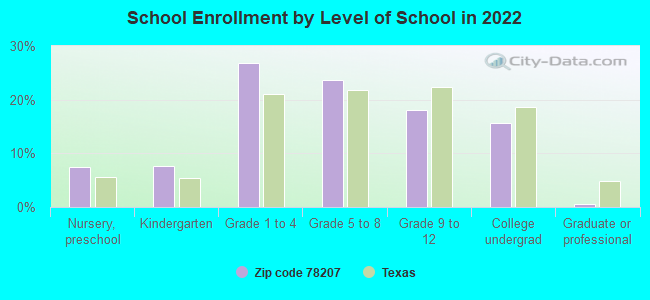
Private vs. public school enrollment:
Students in private schools in grades 1 to 8 (elementary and middle school): 357
Here:
5.1%
Texas:
8.8%
Students in private schools in grades 9 to 12 (high school): 207
Here:
8.3%
Texas:
8.0%
Students in private undergraduate colleges: 467
Here:
21.4%
Texas:
16.2%
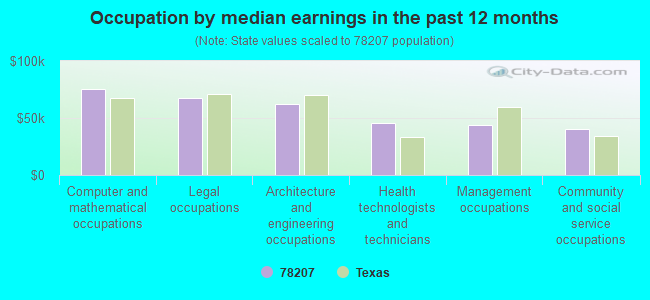
Occupation by median earnings in the past 12 months ($)
75,389Computer and mathematical occupations
67,951Legal occupations
62,595Architecture and engineering occupations
45,813Health technologists and technicians
43,466Management occupations
40,266Community and social service occupations
Companies with biggest federal contracts located in this zip code (SAN ANTONIO, TX):
GOODWILL INDUSTRIES OF SAN ANT (406 W COMMERCE ST) : $72,465,554 in 336 contractsfrom 1999 to 2006
Contracts for Other Professional Services, Landscaping/Groundskeeping Services, Maintenance, Repair or Alteration of Real Property -- Miscellaneous Buildings, Other Administrative Support Services, and moreby Air Force, Army, Department of Defense Signed by year:2000: $8,690,852; 2001: $8,157,705; 2002: $5,530,403; 2003: $10,918,707; 2004: $16,621,673; 2005: $11,768,671; 2006: $4,842,385.
Biggest contracts:
$2,796,021 with Air Force for Other Professional Services. Signed on 2005-10-01. Completion date: 2006-09-30.
$2,728,881, same as above.Signed on 2004-10-01. Completion date: 2005-09-30.
$2,549,237 with Air Force for Landscaping/Groundskeeping Services. Signed on 2006-03-13. Completion date: 2006-02-28.
$2,424,517, same as above.Signed on 2005-03-01. Completion date: 2005-09-30.
TRECO SERVICES, INC (904 N ZARZAMORA ST; small business) : $20,995,130 in 93 contractsfrom 2000 to 2006
Contracts for Custodial Janitorial Services, Landscaping/Groundskeeping Services, Other Housekeeping Services, Tree Thinning Services, and moreby Army, U.S. Customs Service, Department of Veterans Affairs, Air Force, and others Signed by year:2000: $45,000; 2001: $1,289,231; 2002: $3,594,114; 2003: $3,162,971; 2004: $4,375,906; 2005: $7,212,083; 2006: $1,315,825.
Biggest contracts:
$2,416,076 with Army for Custodial Janitorial Services. Signed on 2005-10-11. Completion date: 2006-09-30.
$1,500,000 with U.S. Customs Service for Custodial Janitorial Services. Signed on 2004-11-30. Effective on 2004-10-01. Completion date: 2005-09-30.
$1,340,897 with Army for Custodial Janitorial Services. Signed on 2005-04-22. Completion date: 2005-09-30.
$1,220,000 with Department of Veterans Affairs for Landscaping/Groundskeeping Services. Signed on 2002-05-15. Completion date: 2003-06-15.
SUNBELT DESIGN & DEVELOPMENT, (730 PEREZ ST; small business) : $15,198,534 in 111 contractsfrom 1999 to 2006
Contracts for Aircraft Ground Servicing Equipment, Aircraft Maintenance and Repair Shop Specialized Equipment, Airfield Specialized Trucks and Trailers, Motor Vehicle Maintenance and Repair Shop Specialized Equipment, and moreby Air Force, Army, Defense Logistics Agency, Navy, and others Signed by year:2000: $1,663,175; 2001: $1,964,241; 2002: $2,648,432; 2003: $4,434,472; 2004: $288,150; 2005: $2,771,198; 2006: $764,739.
Biggest contracts:
$1,712,750 with Air Force for Aircraft Ground Servicing Equipment. Signed on 2003-06-18. Completion date: 2004-07-31.
$1,305,902, same as above.Signed on 2002-04-15. Completion date: 2002-04-15.
$1,162,140 with Army for Aircraft Maintenance and Repair Shop Specialized Equipment. Signed on 2005-09-19. Completion date: 2009-08-31.
$891,856 with Air Force for Aircraft Ground Servicing Equipment. Signed on 2003-02-21. Completion date: 2004-02-29.
REGENT COACH LINE, LTD (1902 S LAREDO ST BL; small business) : $12,180,032 in 17 contractsfrom 2002 to 2006
Contracts for Passenger Motor Charter Service, Other Transportation Travel and Relocation Services, Motor Passenger Services, Other Vehicle Charter for Transportation of Things, and moreby Air Force, Army Signed by year:2000: $0; 2001: $0; 2002: $2,944,234; 2003: $2,894,183; 2004: $3,333,911; 2005: $2,982,704; 2006: $25,000.
Biggest contracts:
$3,398,955 with Air Force for Passenger Motor Charter Service. Signed on 2004-10-01. Completion date: 2005-09-30.
$3,335,667, same as above.Signed on 2005-10-01. Completion date: 2006-09-30.
$3,335,657, same as above.Signed on 2003-10-01. Completion date: 2004-09-30.
$2,944,234, same as above.Signed on 2002-11-14. Completion date: 2003-09-30.
BIG STATE PRODUCE COMPANY, INC (1500 S ZARZAMORA ST STE 41; small business) : $6,733,684 in 655 contractsfrom 2000 to 2006
Contracts for Fruits and Vegetables by Defense Logistics Agency Signed by year:2000: $523,437; 2001: $29,848; 2002: $0; 2003: $34,113; 2004: $899,978; 2005: $3,607,277; 2006: $1,639,031.
Biggest contracts:
$34,113 with Defense Logistics Agency for Fruits and Vegetables. Signed on 2003-10-01. Completion date: 2003-10-01.
$32,033, same as above.Signed on 2000-07-14. Completion date: 2000-07-14.
$31,885, same as above.Signed on 2000-07-07. Completion date: 2000-07-07.
$29,848, same as above.Signed on 2001-06-01. Completion date: 2001-06-01.
LION TECHNOLOGIES, INC (911 NORTH FRIO STREET; small business) : $5,003,002 in 12 contractsfrom 2004 to 2006
Contracts for Individual Equipment by Defense Logistics Agency Signed by year:2000: $0; 2001: $0; 2002: $0; 2003: $0; 2004: $2,600,402; 2005: $2,308,100; 2006: $94,500.
Biggest contracts:
$1,756,402 with Defense Logistics Agency for Individual Equipment. Signed on 2004-12-17. Completion date: 2005-09-05.
$1,404,800, same as above.Signed on 2005-05-02. Completion date: 2005-12-30.
$809,140, same as above.Signed on 2005-11-07. Completion date: 2006-03-13.
$523,280, same as above.Signed on 2004-07-30. Completion date: 2005-02-17.
B CATALANI INC (1500 S ZARZAMORA ST # 326; small business) : $2,690,023 in 577 contractsfrom 1999 to 2006
Contracts for Fruits and Vegetables by Defense Logistics Agency Signed by year:2000: $0; 2001: $0; 2002: $0; 2003: $0; 2004: $352,923; 2005: $1,360,954; 2006: $863,952.
Biggest contracts:
$34,721 with Defense Logistics Agency for Fruits and Vegetables. Signed on 1999-11-19. Completion date: 1999-11-19.
$26,341, same as above.Signed on 1999-11-05. Completion date: 1999-11-05.
$25,754, same as above.Signed on 1999-12-03. Completion date: 1999-12-03.
$25,378, same as above.Signed on 1999-12-17. Completion date: 1999-12-17.
CALIFORNIA FRUIT COMPANY INC (1500 S ZARZAMORA ST#338 -; small business) : $2,585,736 in 581 contractsfrom 2004 to 2006
Contracts for Fruits and Vegetables by Defense Logistics Agency Signed by year:2000: $0; 2001: $0; 2002: $0; 2003: $0; 2004: $398,915; 2005: $1,346,371; 2006: $840,450.
Biggest contracts:
$17,980 with Defense Logistics Agency for Fruits and Vegetables. Signed on 2006-05-12. Completion date: 2006-05-12.
$16,588, same as above.Signed on 2006-05-19. Completion date: 2006-05-19.
$16,308, same as above.Signed on 2006-05-05. Completion date: 2006-05-05.
$16,137, same as above.Signed on 2006-05-01. Completion date: 2006-05-01.
HEIMER MANUFACTURING LLC (422 LEAL STREET; small business) 50 employees, $0 revenue. : $2,468,397 in 13 contractsfrom 2002 to 2005
Contracts for Aircraft Ground Servicing Equipment, Cabinets, Lockers, Bins, and Shelving, Airfield Specialized Trucks and Trailers, Guns, 75 mm through 125 mm, and moreby Air Force, Army Signed by year:2000: $0; 2001: $0; 2002: $566,363; 2003: $244,872; 2004: $1,487,539; 2005: $169,623; 2006: $0.
Biggest contracts:
$1,128,000 with Air Force for Aircraft Ground Servicing Equipment. Signed on 2004-09-15. Completion date: 2005-09-14.
$566,363, same as above.Signed on 2002-09-27. Completion date: 2003-09-30.
$201,688 with Army for Cabinets, Lockers, Bins, and Shelving. Signed on 2004-08-26. Completion date: 2007-07-31.
$101,932 with Air Force for Airfield Specialized Trucks and Trailers. Signed on 2003-09-12. Completion date: 2004-09-30.
THE BARSHOP PARTNERSHIP LTD (1500 S ZARZAMORA; small business) : $1,869,599 in 491 contractsfrom 2004 to 2006
Contracts for Fruits and Vegetables by Defense Logistics Agency Signed by year:2000: $0; 2001: $0; 2002: $0; 2003: $0; 2004: $273,472; 2005: $1,068,649; 2006: $527,478.
Biggest contracts:
$25,419 with Defense Logistics Agency for Fruits and Vegetables. Signed on 2004-08-17. Completion date: 2004-08-17.
$20,127, same as above.Signed on 2005-04-12. Completion date: 2005-04-12.
$18,489, same as above.Signed on 2006-04-27. Completion date: 2006-04-27.
$15,858, same as above.Signed on 2006-04-13. Completion date: 2006-04-13.
Top industries in this zip code by the number of employees in 2005:
Health Care and Social Assistance: General Medical and Surgical Hospitals (500-999 employees: 2 establishments)
2002 - 2018 National Fire Incident Reporting System (NFIRS) incidents
Based on the data from the years 2002 - 2018 the average number of fires per year is 248. The highest number of fire incidents - 420 took place in 2003, and the least - 0 in 2008. The data has a dropping trend.
When looking into fire subcategories, the most incidents belonged to: Outside Fires (58.0%), and Mobile Property/Vehicle Fires (15.5%).
Fire incident types reported to NFIRS in Zip Code 78207


 Nearest zip codes: 78204, 78225, 78205, 78237, 78201, 78215.
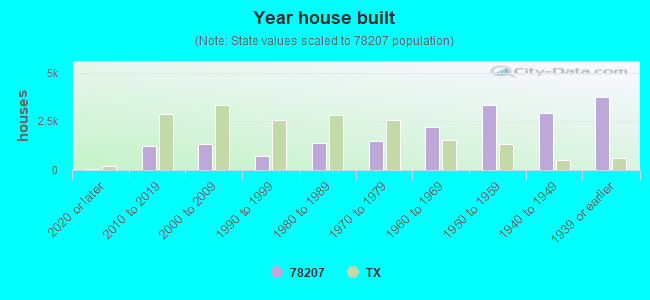


 Based on the data from the years 2002 - 2018 the average number of fires per year is 248. The highest number of fire incidents - 420 took place in 2003, and the least - 0 in 2008. The data has a dropping trend.
 When looking into fire subcategories, the most incidents belonged to: Outside Fires (58.0%), and Mobile Property/Vehicle Fires (15.5%).