According to our research of Texas and other state lists, there was 1 registered sex offender living in 78234 zip code as of May 17, 2024. The ratio of all residents to sex offenders in zip code 78234 is 5,941 to 1. The ratio of registered sex offenders to all residents in this zip code is much lower than the state average.
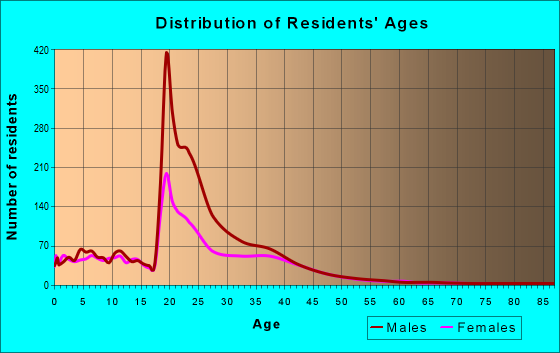
Median resident age:
This zip code:
21.1 years
Texas median age:
35.6 years
Average household size:
This zip code:
3.6 people
Texas:
2.6 people
Averages for the 2020 tax year for zip code 78234, filed in 2021:
Average Adjusted Gross Income (AGI) in 2020: $55,418 (Individual Income Tax Returns)
Here:
$55,418
State:
$77,054
Salary/wage: $51,507 (reported on 97.8% of returns)
Here:
$51,507
State:
$62,766
(% of AGI for various income ranges: 1476.1% for AGIs below $25k, 3586.2% for AGIs $25k-50k, 6244.3% for AGIs $50k-75k, 8852.7% for AGIs $75k-100k, 15798.9% for AGIs $100k-200k)
Taxable interest for individuals: $556 (reported on 19.6% of returns)
This zip code:
$556
Texas:
$2,665
(% of AGI for various income ranges: 0.3% for AGIs below $25k, 1.7% for AGIs $25k-50k, 5.7% for AGIs $50k-75k, 8.0% for AGIs $75k-100k, 67.2% for AGIs $100k-200k)
Ordinary dividends: $2,126 (reported on 14.7% of returns)
Here:
$2,126
State:
$10,044
(% of AGI for various income ranges: 0.3% for AGIs below $25k, 3.3% for AGIs $25k-50k, 6.7% for AGIs $50k-75k, 23.3% for AGIs $75k-100k, 125.6% for AGIs $100k-200k)
Net capital gain/loss in AGI: +$7,341 (reported on 14.7% of returns)
Here:
+$7,341
State:
+$39,590
(% of AGI for various income ranges: 1.7% for AGIs below $25k, 18.8% for AGIs $25k-50k, 36.7% for AGIs $50k-75k, 25.3% for AGIs $75k-100k, 443.9% for AGIs $100k-200k)
Profit/loss from business: +$1,829 (reported on 7.6% of returns)
Here:
+$1,829
State:
+$10,888
(% of AGI for various income ranges: 12.1% for AGIs $25k-50k, 6.2% for AGIs $50k-75k, 124.4% for AGIs $100k-200k)
Total itemized deductions: $32,300 (reported on 2.7% of returns)
Here:
$32,300
State:
$40,428
(% of AGI for various income ranges: 897.2% for AGIs $100k-200k)
Charity contributions: $16,675 (reported on 2.2% of returns)
Here:
$16,675
State:
$18,201
(% of AGI for various income ranges: 370.6% for AGIs $100k-200k)
Taxes paid: $6,420 (reported on 2.7% of returns)
78234:
$6,420
State:
$7,821
(% of AGI for various income ranges: 178.3% for AGIs $100k-200k)
Earned income credit: $2,367 (reported on 13.0% of returns)
Here:
$2,367
State:
$2,584
(% of AGI for various income ranges: 19.1% for AGIs below $25k, 100.5% for AGIs $25k-50k, 6.7% for AGIs $50k-75k)
Percentage of individuals using paid preparers for their 2020 taxes: 96.7%
Here:
97%
State:
92%
(% for various income ranges: 97.2% for AGIs below $25k, 100.0% for AGIs $25k-50k, 95.7% for AGIs $50k-75k, 94.1% for AGIs $75k-100k, 95.7% for AGIs $100k-200k, 80.0% for AGIs over 200k)
Averages for the 2012 tax year for zip code 78234, filed in 2013:
Average Adjusted Gross Income (AGI) in 2012: $40,731 (Individual Income Tax Returns)
Here:
$40,731
State:
$65,384
Salary/wage: $39,540 (reported on 98.6% of returns)
Here:
$39,540
State:
$52,524
(% of AGI for various income ranges: 99.9% for AGIs below $25k, 100.3% for AGIs $25k-50k, 99.1% for AGIs $50k-75k, 95.1% for AGIs $75k-100k, 90.8% for AGIs $100k-200k, 81.2% for AGIs over 200k)
Taxable interest for individuals: $574 (reported on 19.4% of returns)
This zip code:
$574
Texas:
$2,372
(% of AGI for various income ranges: 0.2% for AGIs $50k-75k, 0.3% for AGIs $75k-100k, 0.6% for AGIs $100k-200k)
Ordinary dividends: $1,512 (reported on 11.5% of returns)
Here:
$1,512
State:
$9,721
(% of AGI for various income ranges: 0.3% for AGIs $50k-75k, 0.4% for AGIs $75k-100k, 1.2% for AGIs $100k-200k)
Profit/loss from business: +$962 (reported on 3.7% of returns)
Here:
+$962
State:
+$13,732
Taxable individual retirement arrangement distribution: $5,100 (reported on 0.9% of returns)
78234:
$5,100
Texas:
$19,511
Total itemized deductions: $19,744 (21% of AGI, reported on 11.5% of returns)
Here:
$19,744
State:
$24,724
Here:
20.6% of AGI
State:
15.9% of AGI
(% of AGI for various income ranges: 3.7% for AGIs $25k-50k, 7.8% for AGIs $50k-75k, 7.2% for AGIs $75k-100k, 9.1% for AGIs $100k-200k)
Charity contributions: $4,870 (reported on 9.2% of returns)
Here:
$4,870
State:
$6,808
(% of AGI for various income ranges: 0.5% for AGIs $25k-50k, 1.2% for AGIs $50k-75k, 1.3% for AGIs $75k-100k, 2.3% for AGIs $100k-200k)
Taxes paid: $4,784 (reported on 11.5% of returns)
78234:
$4,784
State:
$6,921
(% of AGI for various income ranges: 0.8% for AGIs $25k-50k, 1.5% for AGIs $50k-75k, 1.8% for AGIs $75k-100k, 2.6% for AGIs $100k-200k)
Earned income credit: $2,225 (reported on 20.3% of returns)
Here:
$2,225
State:
$2,570
(% of AGI for various income ranges: 3.4% for AGIs below $25k, 2.7% for AGIs $25k-50k)
Percentage of individuals using paid preparers for their 2012 taxes: 24.0%
Here:
24%
State:
51%
(% for various income ranges: 20.2% for AGIs below $25k, 25.5% for AGIs $25k-50k, 30.4% for AGIs $50k-75k, 18.8% for AGIs $75k-100k, 41.2% for AGIs $100k-200k)
Averages for the 2004 tax year for zip code 78234, filed in 2005:
Average Adjusted Gross Income (AGI) in 2004: $38,237 (Individual Income Tax Returns)
Here:
$38,237
State:
$47,881
Salary/wage: $38,057 (reported on 97.4% of returns)
Here:
$38,057
State:
$41,947
(% of AGI for various income ranges: 96.5% for AGIs below $10k, 98.0% for AGIs $10k-25k, 98.8% for AGIs $25k-50k, 97.3% for AGIs $50k-75k, 96.5% for AGIs $75k-100k, 93.7% for AGIs over 100k)
Taxable interest for individuals: $599 (reported on 26.7% of returns)
This zip code:
$599
Texas:
$2,255
(% of AGI for various income ranges: 1.0% for AGIs below $10k, 0.1% for AGIs $10k-25k, 0.2% for AGIs $25k-50k, 0.4% for AGIs $50k-75k, 0.5% for AGIs $75k-100k, 0.9% for AGIs over 100k)
Taxable dividends: $1,032 (reported on 16.0% of returns)
Here:
$1,032
State:
$4,261
(% of AGI for various income ranges: 0.3% for AGIs below $10k, 0.1% for AGIs $10k-25k, 0.0% for AGIs $25k-50k, 0.2% for AGIs $50k-75k, 0.6% for AGIs $75k-100k, 1.2% for AGIs over 100k)
Profit/loss from business: +$3,123 (reported on 4.2% of returns)
Here:
+$3,123
State:
+$11,013
(% of AGI for various income ranges: 4.6% for AGIs below $10k, 0.4% for AGIs $25k-50k, 0.3% for AGIs $50k-75k, 0.4% for AGIs over 100k)
IRA payment deduction: $2,935 (reported on 2.0% of returns)
78234:
$2,935
Texas:
$3,120
Total itemized deductions: $16,633 (22% of AGI, reported on 10.7% of returns)
Here:
$16,633
State:
$19,631
Here:
21.8% of AGI
State:
18.9% of AGI
(% of AGI for various income ranges: 0.9% for AGIs $10k-25k, 4.1% for AGIs $25k-50k, 5.1% for AGIs $50k-75k, 6.9% for AGIs $75k-100k, 6.5% for AGIs over 100k)
Charity contributions deductions: $4,007 (5% of AGI, reported on 9.7% of returns)
Here:
$4,007
State:
$4,753
Here:
5.1% of AGI
State:
4.2% of AGI
(% of AGI for various income ranges: 0.6% for AGIs $25k-50k, 1.0% for AGIs $50k-75k, 1.6% for AGIs $75k-100k, 1.9% for AGIs over 100k)
Total tax: $4,295 (reported on 64.3% of returns)
78234:
$4,295
State:
$9,058
(% of AGI for various income ranges: 1.1% for AGIs below $10k, 3.8% for AGIs $10k-25k, 3.0% for AGIs $25k-50k, 5.8% for AGIs $50k-75k, 9.5% for AGIs $75k-100k, 15.2% for AGIs over 100k)
Earned income credit: $1,655 (reported on 22.0% of returns)
Here:
$1,655
State:
$2,024
Percentage of individuals using paid preparers for their 2004 taxes: 52.4%
Here:
52%
State:
57%
(% for various income ranges: 47.7% for AGIs below $10k, 57.5% for AGIs $10k-25k, 54.2% for AGIs $25k-50k, 52.8% for AGIs $50k-75k, 41.0% for AGIs $75k-100k, 39.4% for AGIs over 100k)
Household received Food Stamps/SNAP in the past 12 months: 17 Household did not receive Food Stamps/SNAP in the past 12 months: 999
Women who had a birth in the past 12 months: 19 (20 now married, 0 unmarried) Women who did not have a birth in the past 12 months: 1,898 (907 now married, 988 unmarried)
Residents with income below the poverty level in 2022:
This zip code:
8.3%
Whole state:
14.0%
Residents with income below 50% of the poverty level in 2022:
This zip code:
4.9%
Whole state:
7.4%
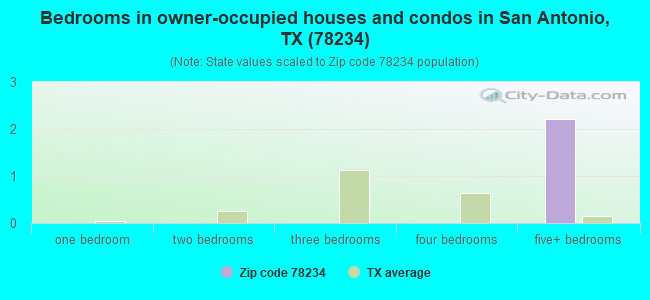
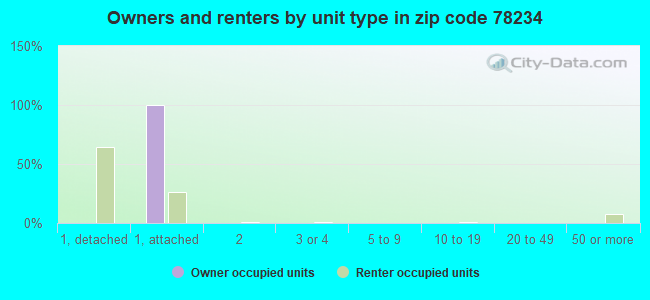
Median number of rooms in apartments:
Here:
6.1
State:
4.0
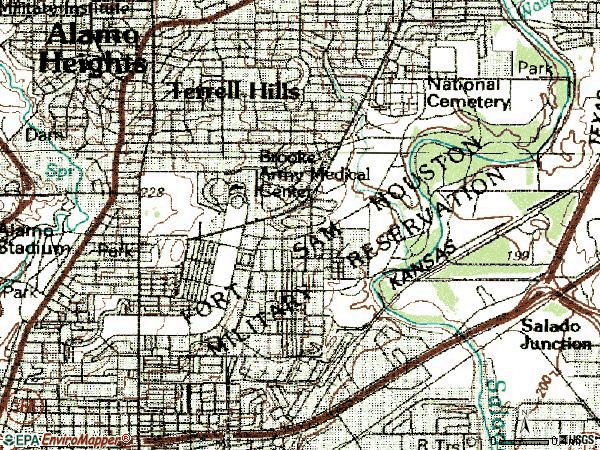
Notable locations in this zip code not listed on our city pages
Notable locations in zip code 78234: United States Army Medical Department Museum (A), Pershing House (B), Fort Sam Houston Theatre (C), Fort Sam Houston Museum (D). Display/hide their locations on the map
Churches in zip code 78234 include: Saint Pauls Episcopal Church (A), Post Chapel at Fort Sam Houston (B), Chapel and Family Life Center (C). Display/hide their locations on the map
In group quarters: 1,971 (-1 institutionalized population)
Size of family households: 105 2-persons, 175 3-persons, 338 4-persons, 176 5-persons, 54 6-persons, 14 7-or-more-persons
Size of nonfamily households: 123 1-person, 11 2-persons
1,465 married couples with children.
131 single-parent households (131 women).
83.8% of residents of 78234 zip code speak English at home.
6.9% of residents speak Spanish at home (76% very well, 19% well, 5% not well).
4.4% of residents speak other Indo-European language at home (62% very well, 24% well, 14% not well).
3.6% of residents speak Asian or Pacific Island language at home (93% very well, 2% well, 5% not well).
1.2% of residents speak other language at home (100% very well).
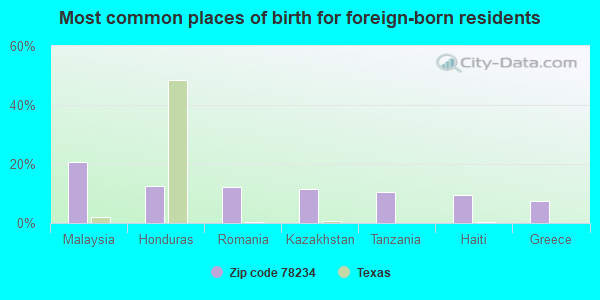
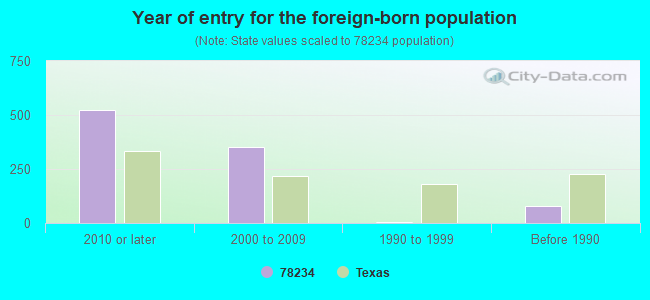
Foreign born population: 550 (9.7%) (65.4% of them are naturalized citizens)
Housing units lacking complete kitchen facilities: 1.5%
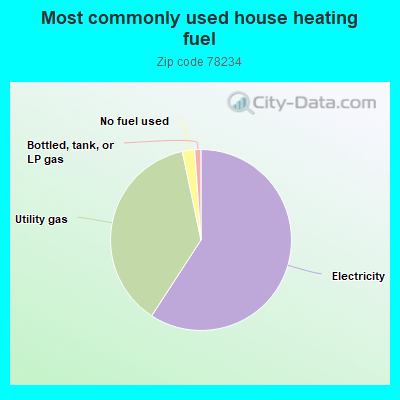
59.3%Electricity
37.6%Utility gas
2.2%No fuel used
1.1%Bottled, tank, or LP gas
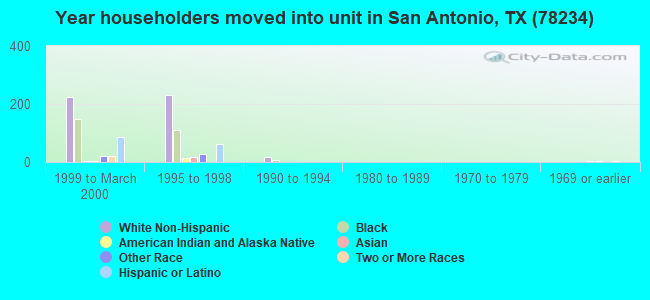
Population in 1990: 8,258.
Place of birth for U.S.-born residents:
This state: 528
Northeast: 529
Midwest: 688
South: 1,665
West: 1,494
8% of the 78234 zip code residents lived in the same house 5 years ago. Out of people who lived in different houses, 8% lived in this county. Out of people who lived in different counties, 50% lived in Texas.
49% of the 78234 zip code residents lived in the same house 1 year ago. Out of people who lived in different houses, 18% moved from this county. Out of people who lived in different houses, 8% moved from different county within same state. Out of people who lived in different houses, 75% moved from different state. Out of people who lived in different houses, 5% moved from abroad.
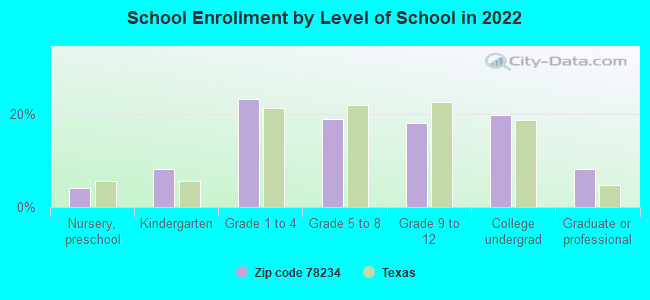
Private vs. public school enrollment:
Students in private schools in grades 1 to 8 (elementary and middle school): 114
Here:
13.5%
Texas:
8.8%
Students in private schools in grades 9 to 12 (high school): 44
Here:
12.2%
Texas:
8.0%
Students in private undergraduate colleges: 52
Here:
13.2%
Texas:
16.2%
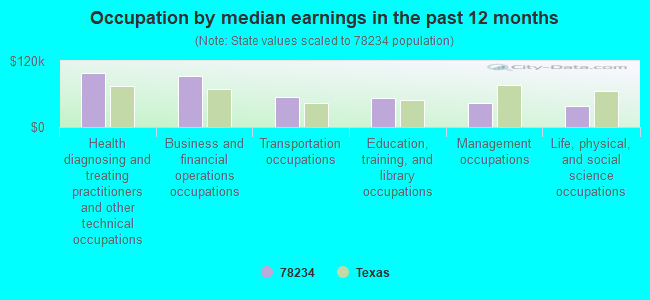
Occupation by median earnings in the past 12 months ($)
97,812Health diagnosing and treating practitioners and other technical occupations
93,160Business and financial operations occupations
53,840Transportation occupations
51,963Education, training, and library occupations
43,329Management occupations
38,558Life, physical, and social science occupations
Companies with federal contracts located in this zip code:
BTG, INC. (MARNE RD BLDG 6142 in SAN ANTONIO, TX) : $139,522 in 4 contractsfrom 2001 to 2005
$120,000 with Federal Technology Service for ADP Systems Analysis Services. Signed on 2001-01-15. Completion date: 2002-02-15.
$9,907, same as above.Signed on 2005-01-28. Completion date: 2005-02-28.
$9,615, same as above.Signed on 2004-09-29. Completion date: 2004-12-31.
$0, same as above.Signed on 2004-12-08. Completion date: 2005-01-31.
KATHARYN M. BYRNE, M.D. (160 ARTILLERY POST ROAD in FORT SAM HOUST, TX; small business)
$90,793 with Army for Other Medical Services. Signed on 1999-10-14. Completion date: 2000-09-30.
CONNIE FRETWELL (5 STAFF POST in SAN ANTONIO, TX; small business)
$31,944 with Army for Program Review/Development Services. Signed on 2002-09-22. Completion date: 2003-09-24.
BARBARA GEORGE (1212 STANLEY RD BLDG 124 in SAN ANTONIO, TX) : $27,042 in 7 contractsfrom 2002 to 2006
Contracts for Maintenance, Repair or Alteration of Real Property -- Conference Space and Facilities, Miscellaneous Items, Food Services, Lease or Rental of Facilities -- Conference Space and Facilities by Army Signed by year:2000: $0; 2001: $0; 2002: $6,600; 2003: $8,600; 2004: $7,789; 2005: $4,053; 2006: $0.
Biggest contracts:
$8,600 with Army for Maintenance, Repair or Alteration of Real Property -- Conference Space and Facilities. Signed on 2003-10-29. Completion date: 2003-11-21.
$5,725 with Army for Miscellaneous Items. Signed on 2004-05-19. Completion date: 2004-06-26.
$4,053 with Army for Food Services. Signed on 2005-11-30. Completion date: 2005-12-03.
$3,600, same as above.Signed on 2002-12-13. Completion date: 2003-09-30.
FORT SAM HOUSTON INDEPENDENT S (1902 WINANS ROAD in SAN ANTONIO, TX)
$13,600 with Army for Education Services. Signed on 2003-07-29. Completion date: 2003-07-26.
JUTTA A AVILES (638 INFANTRY POST RD in FORT SAM HOUST, TX; small business) : $13,260 in 4 contractsin 2003
$9,760 with Army for Relocation Services. Signed on 2003-04-22. Completion date: 2003-09-30.
$4,880 with Army for Financial Services (includes credit card services and any other financial services. See revision to description for code R703 above). Signed on 2003-03-07. Completion date: 2003-09-30.
$0, same as above.Signed on 2003-03-07. Completion date: 2003-09-30.
-$1,380 with Army for Relocation Services. Signed on 2003-08-29. Completion date: 2003-09-30.
ARMY AND AIR FORCE EXCHANGE SE (STANLEY RD BLDG 2840 in SAN ANTONIO, TX)
$8,662 with Army for Clothing, Special Purpose. Signed on 2002-12-11. Completion date: 2003-01-13.
ARMY AND AIR FORCE EXCHANGE SE (4192 FORT SAM HOUSTON in SAN ANTONIO, TX)
$4,751 with Army for Maintenance, Repair or Alteration of Real Property -- Restoration of real property. Signed on 2000-11-13. Completion date: 2001-02-15.
Top industries in this zip code by the number of employees in 2005:
Health Care and Social Assistance: General Medical and Surgical Hospitals (over 1000 employees: 1 establishment)
Administrative and Support and Waste Management and Remediation Services: Janitorial Services (50-99: 1)
Administrative and Support and Waste Management and Remediation Services: Facilities Support Services (20-49: 2)
Professional, Scientific, and Technical Services: Research and Development in the Physical, Engineering, and Life Sciences (20-49: 1, 5-9: 2, 1-4: 4)
Professional, Scientific, and Technical Services: Computer Systems Design Services (20-49: 1, 10-19: 1)
Professional, Scientific, and Technical Services: Human Resources and Executive Search Consulting Services (10-19: 2, 1-4: 2)
Real Estate and Rental and Leasing: Lessors of Residential Buildings and Dwellings (20-49: 1)
Professional, Scientific, and Technical Services: Other Computer Related Services (20-49: 1)
Health Care and Social Assistance: Vocational Rehabilitation Services (20-49: 1)
Finance and Insurance: Direct Health and Medical Insurance Carriers (10-19: 1, 1-4: 1)
People in group quarters in 2010:
3,793 people in military barracks and dormitories (nondisciplinary)
People in group quarters in 2000:
1,394 people in military transient quarters for temporary residents
489 people in military barracks, etc.
Home Mortgage Disclosure Act Aggregated Statistics For Year 2009 (Based on 2 partial tracts)
A) FHA, FSA/RHS & VA Home Purchase Loans
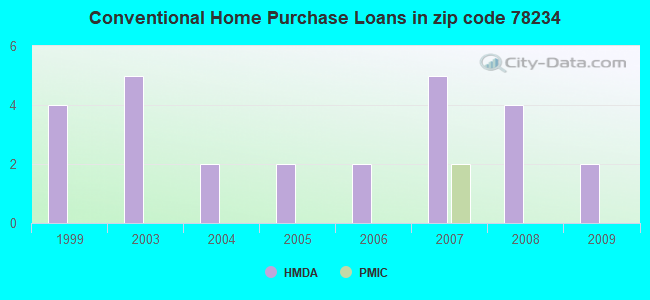
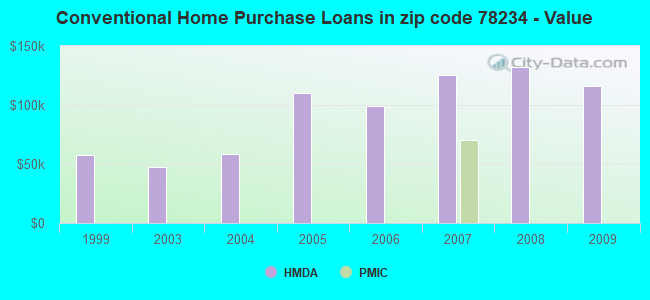
B) Conventional Home Purchase Loans
C) Refinancings
F) Non-occupant Loans on < 5 Family Dwellings (A B C & D)
Number
Average Value
Number
Average Value
Number
Average Value
Number
Average Value
LOANS ORIGINATED
0
$0
2
$116,485
2
$194,145
0
$0
APPLICATIONS APPROVED, NOT ACCEPTED
0
$0
0
$0
0
$0
0
$0
APPLICATIONS DENIED
2
$138,160
0
$0
0
$0
0
$0
APPLICATIONS WITHDRAWN
0
$0
2
$210,400
2
$124,615
2
$124,615
FILES CLOSED FOR INCOMPLETENESS
0
$0
0
$0
0
$0
0
$0
Aggregated Statistics For Year 2008 (Based on 2 partial tracts)
A) FHA, FSA/RHS & VA Home Purchase Loans
B) Conventional Home Purchase Loans
C) Refinancings
G) Loans On Manufactured Home Dwelling (A B C & D)
Number
Average Value
Number
Average Value
Number
Average Value
Number
Average Value
LOANS ORIGINATED
2
$123,710
4
$132,290
0
$0
0
$0
APPLICATIONS APPROVED, NOT ACCEPTED
0
$0
2
$40,635
0
$0
2
$40,635
APPLICATIONS DENIED
0
$0
0
$0
0
$0
0
$0
APPLICATIONS WITHDRAWN
0
$0
0
$0
4
$71,338
0
$0
FILES CLOSED FOR INCOMPLETENESS
0
$0
2
$135,450
0
$0
0
$0
Aggregated Statistics For Year 2007 (Based on 2 partial tracts)
A) FHA, FSA/RHS & VA Home Purchase Loans
B) Conventional Home Purchase Loans
C) Refinancings
D) Home Improvement Loans
G) Loans On Manufactured Home Dwelling (A B C & D)
Number
Average Value
Number
Average Value
Number
Average Value
Number
Average Value
Number
Average Value
LOANS ORIGINATED
0
$0
5
$125,336
0
$0
4
$7,675
0
$0
APPLICATIONS APPROVED, NOT ACCEPTED
0
$0
0
$0
0
$0
0
$0
0
$0
APPLICATIONS DENIED
0
$0
4
$30,250
2
$194,145
2
$2,710
2
$15,350
APPLICATIONS WITHDRAWN
2
$130,030
2
$180,600
4
$58,695
0
$0
2
$130,030
FILES CLOSED FOR INCOMPLETENESS
0
$0
0
$0
2
$57,790
0
$0
0
$0
Aggregated Statistics For Year 2006 (Based on 2 partial tracts)
B) Conventional Home Purchase Loans
C) Refinancings
D) Home Improvement Loans
F) Non-occupant Loans on < 5 Family Dwellings (A B C & D)
G) Loans On Manufactured Home Dwelling (A B C & D)
Number
Average Value
Number
Average Value
Number
Average Value
Number
Average Value
Number
Average Value
LOANS ORIGINATED
2
$99,330
0
$0
4
$8,127
0
$0
0
$0
APPLICATIONS APPROVED, NOT ACCEPTED
4
$80,818
0
$0
0
$0
2
$116,485
2
$116,485
APPLICATIONS DENIED
7
$115,326
2
$27,090
2
$1,805
0
$0
5
$92,828
APPLICATIONS WITHDRAWN
4
$90,300
2
$257,355
0
$0
0
$0
0
$0
FILES CLOSED FOR INCOMPLETENESS
0
$0
0
$0
0
$0
0
$0
0
$0
Aggregated Statistics For Year 2005 (Based on 2 partial tracts)
B) Conventional Home Purchase Loans
C) Refinancings
F) Non-occupant Loans on < 5 Family Dwellings (A B C & D)
G) Loans On Manufactured Home Dwelling (A B C & D)
Number
Average Value
Number
Average Value
Number
Average Value
Number
Average Value
LOANS ORIGINATED
2
$110,165
0
$0
2
$110,165
0
$0
APPLICATIONS APPROVED, NOT ACCEPTED
13
$58,903
2
$90,300
0
$0
2
$25,285
APPLICATIONS DENIED
4
$69,530
9
$161,136
2
$158,930
2
$80,365
APPLICATIONS WITHDRAWN
7
$86,171
2
$361,200
2
$109,265
0
$0
FILES CLOSED FOR INCOMPLETENESS
5
$141,952
0
$0
0
$0
0
$0
Aggregated Statistics For Year 2004 (Based on 2 partial tracts)
A) FHA, FSA/RHS & VA Home Purchase Loans
B) Conventional Home Purchase Loans
C) Refinancings
D) Home Improvement Loans
F) Non-occupant Loans on < 5 Family Dwellings (A B C & D)
G) Loans On Manufactured Home Dwelling (A B C & D)
Number
Average Value
Number
Average Value
Number
Average Value
Number
Average Value
Number
Average Value
Number
Average Value
LOANS ORIGINATED
0
$0
2
$58,695
0
$0
0
$0
0
$0
2
$58,695
APPLICATIONS APPROVED, NOT ACCEPTED
2
$185,115
0
$0
0
$0
0
$0
0
$0
0
$0
APPLICATIONS DENIED
0
$0
13
$65,155
5
$155,316
7
$50,569
4
$122,358
9
$53,177
APPLICATIONS WITHDRAWN
2
$65,015
2
$65,015
2
$47,860
0
$0
2
$47,860
0
$0
FILES CLOSED FOR INCOMPLETENESS
0
$0
0
$0
0
$0
0
$0
0
$0
0
$0
Aggregated Statistics For Year 2003 (Based on 2 partial tracts)
A) FHA, FSA/RHS & VA Home Purchase Loans
B) Conventional Home Purchase Loans
C) Refinancings
D) Home Improvement Loans
F) Non-occupant Loans on < 5 Family Dwellings (A B C & D)
Number
Average Value
Number
Average Value
Number
Average Value
Number
Average Value
Number
Average Value
LOANS ORIGINATED
2
$65,920
5
$47,678
5
$188,546
0
$0
0
$0
APPLICATIONS APPROVED, NOT ACCEPTED
0
$0
4
$110,165
0
$0
0
$0
0
$0
APPLICATIONS DENIED
0
$0
16
$68,402
7
$106,039
2
$36,120
2
$63,210
APPLICATIONS WITHDRAWN
2
$83,980
2
$155,315
5
$82,714
0
$0
0
$0
FILES CLOSED FOR INCOMPLETENESS
0
$0
0
$0
0
$0
0
$0
0
$0
Aggregated Statistics For Year 1999 (Based on 1 partial tract)
B) Conventional Home Purchase Loans
C) Refinancings
F) Non-occupant Loans on < 5 Family Dwellings (A B C & D)
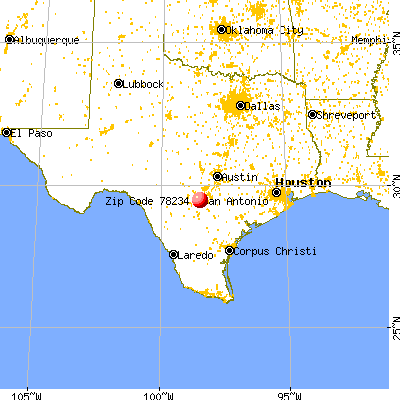


 Nearest zip codes: 78208, 78209, 78202, 78215, 78203, 78218.


 : $139,522 in 4 contracts from 2001 to 2005