Estimated zip code population in 2022: 4,959 Zip code population in 2010: 5,350 Zip code population in 2000: 5,274
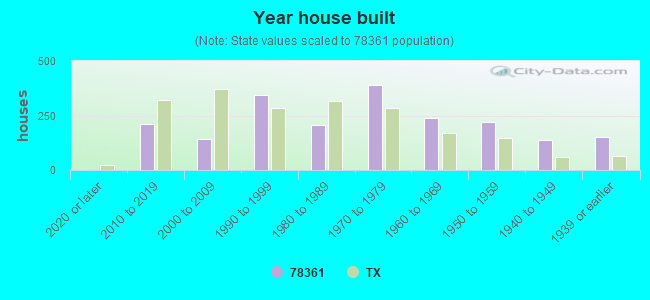
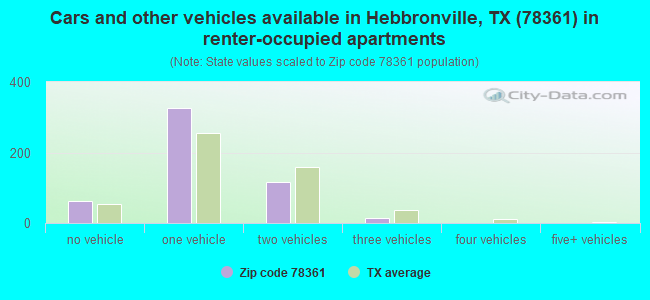
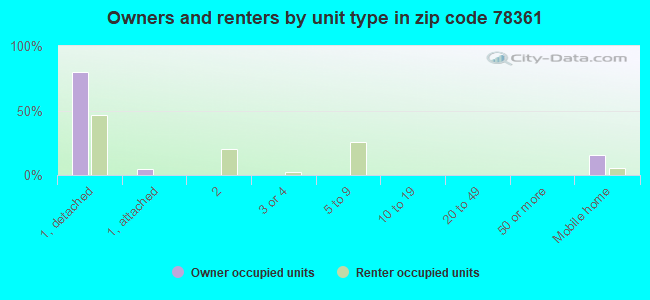
Houses and condos: 2,161 Renter-occupied apartments: 513
% of renters here:
36%
State:
38%
March 2022 cost of living index in zip code 78361: 78.0 (low, U.S. average is 100)
Land area: 1160.7 sq. mi. Water area: 0.4 sq. mi.
Population density: 4 people per square mile
(very low).
OSM Map
General Map
Google Map
MSN Map
OSM Map
General Map
Google Map
MSN Map
OSM Map
General Map
Google Map
MSN Map
OSM Map
General Map
Google Map
MSN Map
Please wait while loading the map...
Real estate property taxes paid for housing units in 2022:
This zip code:
1.6% ($2,107)
Texas:
1.5% ($4,050)
Median real estate property taxes paid for housing units with mortgages in 2022: $2,703 (1.6%) Median real estate property taxes paid for housing units with no mortgage in 2022: $969 (1.3%)
Business Search- 14 Million verified businesses
Males: 2,583
(52.1%)
Females: 2,376
(47.9%)
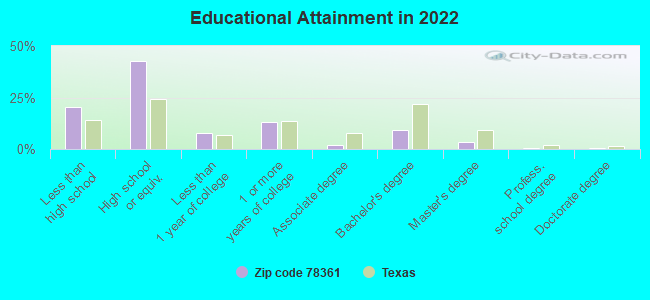
For population 25 years and over in 78361:
High school or higher: 78.2%
Bachelor's degree or higher: 13.4%
Graduate or professional degree: 4.5%
Unemployed: 3.6%
Mean travel time to work (commute): 26.6 minutes
For population 15 years and over in 78361:
Never married: 52.7%
Now married: 39.2%
Separated: 0.0%
Widowed: 2.9%
Divorced: 5.3%
Zip code 78361 compared to state average:
Median household income below state average.
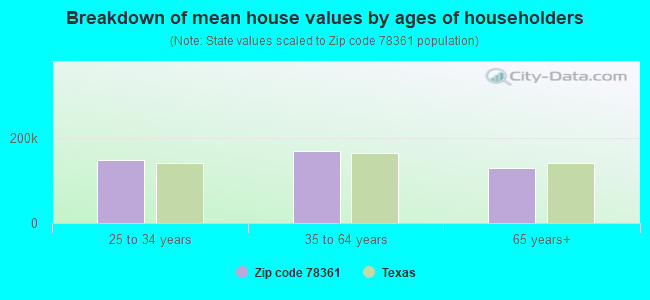
Median house value below state average.
Black race population percentage significantly below state average.
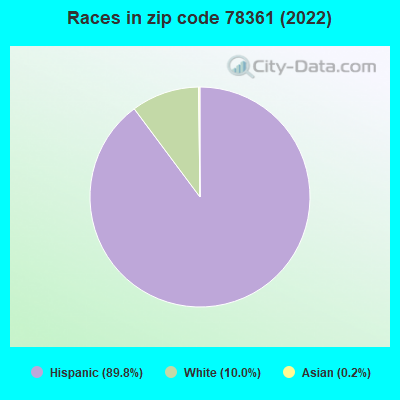
Hispanic race population percentage above state average.
Median age significantly below state average.
Foreign-born population percentage significantly below state average.
Length of stay since moving in significantly above state average.
Percentage of population with a bachelor's degree or higher significantly below state average.
Averages for the 2020 tax year for zip code 78361, filed in 2021:
Average Adjusted Gross Income (AGI) in 2020: $41,140 (Individual Income Tax Returns)
Here:
$41,140
State:
$77,054
Salary/wage: $38,462 (reported on 84.9% of returns)
Here:
$38,462
State:
$62,766
(% of AGI for various income ranges: 1384.9% for AGIs below $25k, 3586.2% for AGIs $25k-50k, 6305.7% for AGIs $50k-75k, 9925.0% for AGIs $75k-100k, 16391.8% for AGIs $100k-200k)
Taxable interest for individuals: $1,073 (reported on 18.0% of returns)
This zip code:
$1,073
Texas:
$2,665
(% of AGI for various income ranges: 7.3% for AGIs below $25k, 9.0% for AGIs $25k-50k, 47.1% for AGIs $50k-75k, 40.0% for AGIs $75k-100k, 149.1% for AGIs $100k-200k)
Ordinary dividends: $3,045 (reported on 5.4% of returns)
Here:
$3,045
State:
$10,044
(% of AGI for various income ranges: 10.5% for AGIs below $25k, 61.0% for AGIs $50k-75k, 114.5% for AGIs $100k-200k)
Net capital gain/loss in AGI: +$3,175 (reported on 3.9% of returns)
Here:
+$3,175
State:
+$39,590
(% of AGI for various income ranges: 3.5% for AGIs below $25k, 70.5% for AGIs $50k-75k, 71.8% for AGIs $100k-200k)
Profit/loss from business: +$3,792 (reported on 19.0% of returns)
Here:
+$3,792
State:
+$10,888
(% of AGI for various income ranges: 136.0% for AGIs below $25k, 19.3% for AGIs $25k-50k, 65.7% for AGIs $50k-75k, 204.5% for AGIs $100k-200k)
Taxable individual retirement arrangement distribution: $11,129 (reported on 3.4% of returns)
78361:
$11,129
Texas:
$24,740
(% of AGI for various income ranges: 66.2% for AGIs $25k-50k, 501.0% for AGIs $75k-100k)
Total itemized deductions: $25,425 (reported on 2.0% of returns)
Here:
$25,425
State:
$40,428
(% of AGI for various income ranges: 484.3% for AGIs $50k-75k)
Charity contributions: $4,900 (reported on 1.5% of returns)
Here:
$4,900
State:
$18,201
(% of AGI for various income ranges: 35.0% for AGIs $25k-50k)
Taxes paid: $5,775 (reported on 2.0% of returns)
78361:
$5,775
State:
$7,821
(% of AGI for various income ranges: 110.0% for AGIs $50k-75k)
Earned income credit: $2,982 (reported on 35.1% of returns)
Here:
$2,982
State:
$2,584
(% of AGI for various income ranges: 213.6% for AGIs below $25k, 119.5% for AGIs $25k-50k)
Percentage of individuals using paid preparers for their 2020 taxes: 91.2%
Here:
91%
State:
92%
(% for various income ranges: 90.8% for AGIs below $25k, 91.8% for AGIs $25k-50k, 92.6% for AGIs $50k-75k, 85.7% for AGIs $75k-100k, 94.1% for AGIs $100k-200k)
Averages for the 2012 tax year for zip code 78361, filed in 2013:
Average Adjusted Gross Income (AGI) in 2012: $42,378 (Individual Income Tax Returns)
Here:
$42,378
State:
$65,384
Salary/wage: $37,839 (reported on 89.0% of returns)
Here:
$37,839
State:
$52,524
(% of AGI for various income ranges: 87.9% for AGIs below $25k, 90.2% for AGIs $25k-50k, 90.1% for AGIs $50k-75k, 85.4% for AGIs $75k-100k, 103.6% for AGIs $100k-200k)
Taxable interest for individuals: $1,486 (reported on 21.1% of returns)
This zip code:
$1,486
Texas:
$2,372
(% of AGI for various income ranges: 0.7% for AGIs below $25k, 0.6% for AGIs $25k-50k, 0.6% for AGIs $50k-75k, 0.5% for AGIs $75k-100k, 1.0% for AGIs $100k-200k, 1.2% for AGIs over 200k)
Ordinary dividends: $3,700 (reported on 5.3% of returns)
Here:
$3,700
State:
$9,721
(% of AGI for various income ranges: 0.1% for AGIs below $25k, 0.5% for AGIs $25k-50k, 0.7% for AGIs $50k-75k, 1.2% for AGIs $100k-200k)
Net capital gain/loss in AGI: +$11,912 (reported on 3.8% of returns)
Here:
+$11,912
State:
+$35,319
(% of AGI for various income ranges: 0.2% for AGIs $50k-75k, 5.7% for AGIs $100k-200k)
Profit/loss from business: +$4,418 (reported on 21.1% of returns)
Here:
+$4,418
State:
+$13,732
(% of AGI for various income ranges: 6.7% for AGIs below $25k, 0.6% for AGIs $50k-75k, 1.1% for AGIs $75k-100k, 6.1% for AGIs $100k-200k)
Taxable individual retirement arrangement distribution: $11,971 (reported on 3.3% of returns)
78361:
$11,971
Texas:
$19,511
(% of AGI for various income ranges: 2.4% for AGIs $25k-50k, 3.3% for AGIs $75k-100k)
Total itemized deductions: $20,841 (25% of AGI, reported on 12.9% of returns)
Here:
$20,841
State:
$24,724
Here:
24.9% of AGI
State:
15.9% of AGI
(% of AGI for various income ranges: 3.0% for AGIs below $25k, 7.0% for AGIs $25k-50k, 11.2% for AGIs $50k-75k, 7.2% for AGIs $75k-100k, 7.2% for AGIs $100k-200k)
Charity contributions: $3,244 (reported on 7.7% of returns)
Here:
$3,244
State:
$6,808
(% of AGI for various income ranges: 0.8% for AGIs $25k-50k, 0.8% for AGIs $50k-75k, 0.9% for AGIs $75k-100k, 0.8% for AGIs $100k-200k)
Taxes paid: $3,688 (reported on 12.0% of returns)
78361:
$3,688
State:
$6,921
(% of AGI for various income ranges: 0.3% for AGIs below $25k, 1.0% for AGIs $25k-50k, 1.6% for AGIs $50k-75k, 1.5% for AGIs $75k-100k, 1.6% for AGIs $100k-200k)
Earned income credit: $2,632 (reported on 35.4% of returns)
Here:
$2,632
State:
$2,570
(% of AGI for various income ranges: 12.1% for AGIs below $25k, 1.9% for AGIs $25k-50k)
Percentage of individuals using paid preparers for their 2012 taxes: 56.0%
Here:
56%
State:
51%
(% for various income ranges: 53.8% for AGIs below $25k, 51.1% for AGIs $25k-50k, 60.7% for AGIs $50k-75k, 60.0% for AGIs $75k-100k, 66.7% for AGIs $100k-200k, 100.0% for AGIs over 200k)
Averages for the 2004 tax year for zip code 78361, filed in 2005:
Average Adjusted Gross Income (AGI) in 2004: $35,868 (Individual Income Tax Returns)
Here:
$35,868
State:
$47,881
Salary/wage: $25,458 (reported on 87.7% of returns)
Here:
$25,458
State:
$41,947
(% of AGI for various income ranges: 121.4% for AGIs below $10k, 85.8% for AGIs $10k-25k, 86.9% for AGIs $25k-50k, 84.1% for AGIs $50k-75k, 67.7% for AGIs $75k-100k, 15.7% for AGIs over 100k)
Taxable interest for individuals: $3,810 (reported on 23.9% of returns)
This zip code:
$3,810
Texas:
$2,255
(% of AGI for various income ranges: 2.1% for AGIs below $10k, 0.8% for AGIs $10k-25k, 1.1% for AGIs $25k-50k, 1.4% for AGIs $50k-75k, 1.4% for AGIs $75k-100k, 5.4% for AGIs over 100k)
Taxable dividends: $5,969 (reported on 8.2% of returns)
Here:
$5,969
State:
$4,261
(% of AGI for various income ranges: 1.5% for AGIs below $10k, 0.6% for AGIs $10k-25k, 0.9% for AGIs $25k-50k, 0.9% for AGIs $50k-75k, 1.8% for AGIs $75k-100k, 2.2% for AGIs over 100k)
Net capital gain/loss: +$2,989 (reported on 4.7% of returns)
Here:
+$2,989
State:
+$16,110
(% of AGI for various income ranges: 0.6% for AGIs below $10k, -0.1% for AGIs $25k-50k, 0.7% for AGIs $50k-75k, 1.1% for AGIs $75k-100k, 0.5% for AGIs over 100k)
Profit/loss from business: +$7,756 (reported on 15.9% of returns)
Here:
+$7,756
State:
+$11,013
(% of AGI for various income ranges: 8.3% for AGIs below $10k, 4.2% for AGIs $10k-25k, 0.3% for AGIs $25k-50k, -0.5% for AGIs $50k-75k, 6.3% for AGIs $75k-100k, 6.1% for AGIs over 100k)
IRA payment deduction: $3,667 (reported on 0.9% of returns)
78361:
$3,667
Texas:
$3,120
Total itemized deductions: $18,148 (31% of AGI, reported on 10.7% of returns)
Here:
$18,148
State:
$19,631
Here:
30.6% of AGI
State:
18.9% of AGI
(% of AGI for various income ranges: 2.2% for AGIs $10k-25k, 10.2% for AGIs $25k-50k, 9.8% for AGIs $50k-75k, 6.2% for AGIs $75k-100k, 1.4% for AGIs over 100k)
Charity contributions deductions: $2,314 (4% of AGI, reported on 8.1% of returns)
Here:
$2,314
State:
$4,753
Here:
3.6% of AGI
State:
4.2% of AGI
(% of AGI for various income ranges: 1.9% for AGIs below $10k, 0.6% for AGIs $25k-50k, 0.9% for AGIs $50k-75k, 0.6% for AGIs $75k-100k, 0.4% for AGIs over 100k)
Total tax: $6,297 (reported on 58.6% of returns)
78361:
$6,297
State:
$9,058
(% of AGI for various income ranges: 2.6% for AGIs below $10k, 2.7% for AGIs $10k-25k, 5.0% for AGIs $25k-50k, 7.8% for AGIs $50k-75k, 11.4% for AGIs $75k-100k, 19.4% for AGIs over 100k)
Earned income credit: $2,072 (reported on 35.5% of returns)
Here:
$2,072
State:
$2,024
Percentage of individuals using paid preparers for their 2004 taxes: 64.7%
Here:
65%
State:
57%
(% for various income ranges: 56.4% for AGIs below $10k, 67.3% for AGIs $10k-25k, 64.0% for AGIs $25k-50k, 71.9% for AGIs $50k-75k, 71.8% for AGIs $75k-100k, 75.7% for AGIs over 100k)
Household received Food Stamps/SNAP in the past 12 months: 419 Household did not receive Food Stamps/SNAP in the past 12 months: 1,010
Women who had a birth in the past 12 months: 125 (90 now married, 34 unmarried) Women who did not have a birth in the past 12 months: 1,039 (248 now married, 797 unmarried)
Housing units in zip code 78361 with a mortgage: 430 Median monthly owner costs for units with a mortgage: $1,366 Median monthly owner costs for units without a mortgage: $387
Residents with income below the poverty level in 2022:
This zip code:
29.0%
Whole state:
14.0%
Residents with income below 50% of the poverty level in 2022:
This zip code:
17.0%
Whole state:
7.4%
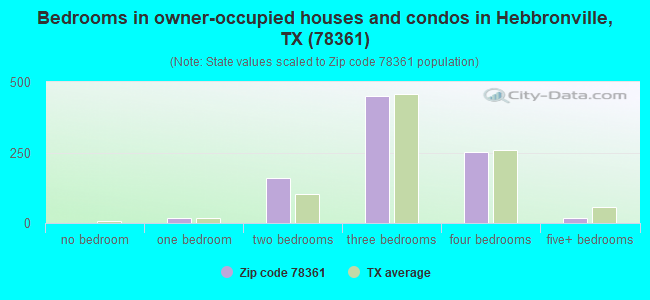
Median number of rooms in houses and condos:
Here:
6.2
State:
6.3
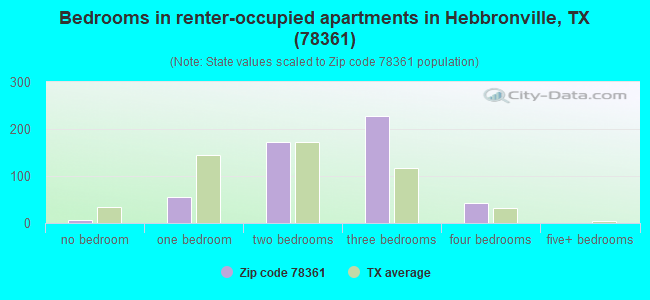
Median number of rooms in apartments:
Here:
4.0
State:
4.0
Notable locations in this zip code not listed on our city pages
In group quarters: 44 (-1 institutionalized population)
Size of family households: 346 2-persons, 113 3-persons, 277 4-persons, 100 5-persons, 107 6-persons, 36 7-or-more-persons
Size of nonfamily households: 391 1-person, 36 2-persons
471 married couples with children.
722 single-parent households (292 men, 430 women).
39.1% of residents of 78361 zip code speak English at home.
60.1% of residents speak Spanish at home (90% very well, 9% well, 1% not well).
1.4% of residents speak Asian or Pacific Island language at home (100% very well).
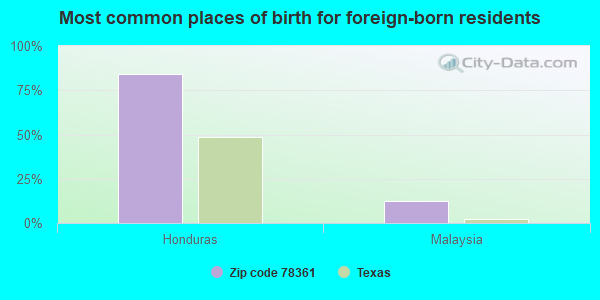
Foreign born population: 83 (1.7%) (48.9% of them are naturalized citizens)
This zip code:
1.7%
Whole state:
17.2%
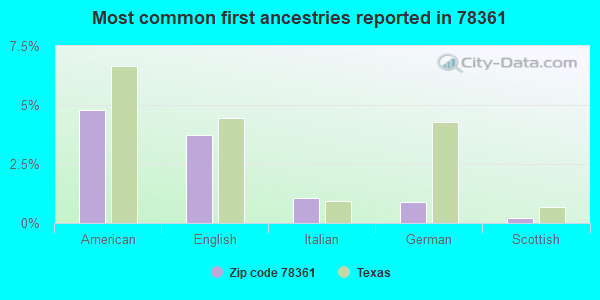
84%Honduras
12%Malaysia
5%American
4%English
1%Italian
1%German
0%Scottish
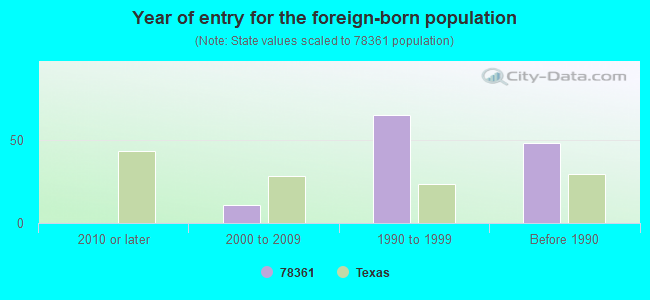
Year of entry for the foreign-born population
02010 or later
112000 to 2009
651990 to 1999
48Before 1990
Facilities with environmental interests located in this zip code:
BAKER HUGHES OILFIELD OPERATIONS INC (819 E GALBRAITH ST in HEBBRONVILLE, TX)
Conditionally Exempt Small Quantity Generators, less than 100 kg/month of hazardous waste (Resource Conservation and Recovery Act (tracking hazardous waste))
Housing units lacking complete plumbing facilities: 12.6% Housing units lacking complete kitchen facilities: 11.2%
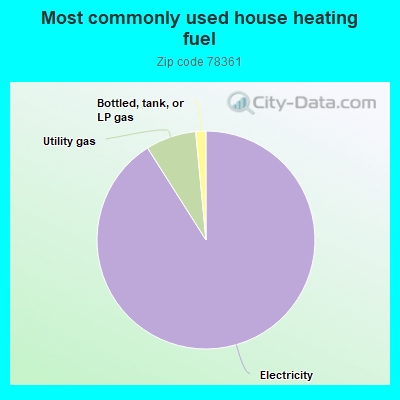
91.1%Electricity
7.5%Utility gas
1.5%Bottled, tank, or LP gas
Population in 1990: 5,078. Population change in the 1990s: +196 (+3.9%).
Place of birth for U.S.-born residents:
This state: 4,608
Northeast: 16
Midwest: 65
South: 12
West: 60
61% of the 78361 zip code residents lived in the same house 5 years ago. Out of people who lived in different houses, 74% lived in this county. Out of people who lived in different counties, 50% lived in Texas.
92% of the 78361 zip code residents lived in the same house 1 year ago. Out of people who lived in different houses, 34% moved from this county. Out of people who lived in different houses, 61% moved from different county within same state. Out of people who lived in different houses, 8% moved from different state.
Private vs. public school enrollment:
Students in private schools in grades 1 to 8 (elementary and middle school):
Here:
0.0%
Texas:
8.8%
Students in private schools in grades 9 to 12 (high school): 6
Here:
3.8%
Texas:
8.0%
Students in private undergraduate colleges:
Here:
0.0%
Texas:
16.2%
Occupation by median earnings in the past 12 months ($)
63,789Farming, fishing, and forestry occupations
48,221Installation, maintenance, and repair occupations
40,690Office and administrative support occupations
36,231Construction and extraction occupations
35,962Transportation occupations
33,177Management occupations
Top industries in this zip code by the number of employees in 2005:
Health Care and Social Assistance: Home Health Care Services (250-499 employees: 1 establishment)
Finance and Insurance: Commercial Banking (20-49: 2, 5-9: 1)
Health Care and Social Assistance: Services for the Elderly and Persons with Disabilities (20-49: 1, 5-9: 1)
Mining: Support Activities for Oil and Gas Operations (10-19: 2, 1-4: 2)
Administrative and Support and Waste Management and Remediation Services: Other Waste Collection (20-49: 1)
Accommodation and Food Services: Limited-Service Restaurants (10-19: 2, 1-4: 1)
People in group quarters in 2010:
16 people in local jails and other municipal confinement facilities
People in group quarters in 2000:
34 people in nursing homes
7 people in agriculture workers' dormitories on farms
2 people in local jails and other confinement facilities (including police lockups)
Most common first names in zip code 78361 among deceased individuals
Name
Count
Lived (average)
Maria
54
77.8 years
Jose
31
76.4 years
Juan
24
73.4 years
Guadalupe
19
75.8 years
Manuel
15
76.3 years
Francisco
14
77.1 years
Pedro
13
73.8 years
Roberto
13
66.0 years
Antonio
12
75.7 years
Petra
11
84.1 years
Most common last names in zip code 78361 among deceased individuals
Last name
Count
Lived (average)
Garza
86
76.2 years
Ramirez
54
77.7 years
Perez
51
77.7 years
Garcia
45
79.0 years
Gonzalez
39
77.8 years
Martinez
39
78.3 years
Saenz
36
72.6 years
Salinas
30
75.4 years
Canales
29
74.7 years
Gomez
27
76.4 years
Businesses in zip code 78361
Name
Count
Name
Count
Alco Stores
1
Quiznos
1
Best Western
1
RadioShack
1
Chevrolet
1
True Value
1
Church's Chicken
1
U-Haul
1
Dairy Queen
1
UPS
1
FedEx
1
Discuss Hebbronville, Texas (TX) on our hugely popular Texas forum.

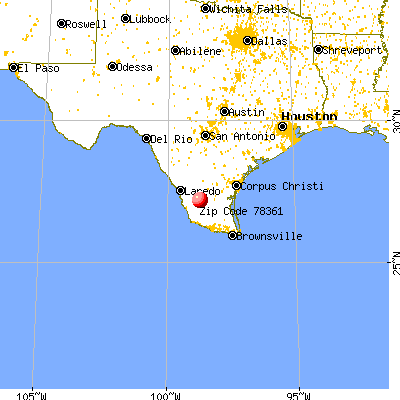


 Nearest zip codes: 78369, 78344, 78076, 78376, 78564, 78588.