Estimated zip code population in 2022: 4,491 Zip code population in 2010: 3,539 Zip code population in 2000: 3,075
Houses and condos: 2,494 Renter-occupied apartments: 289
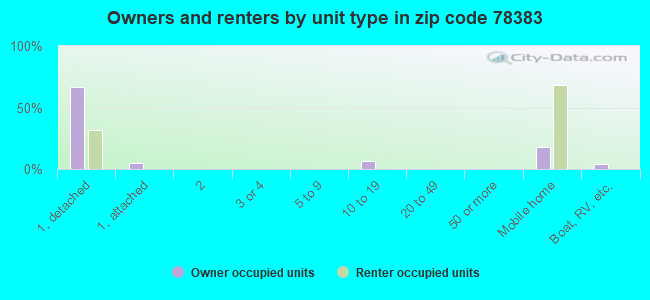
% of renters here:
17%
State:
38%
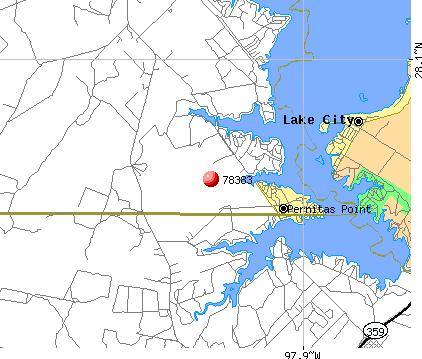
March 2022 cost of living index in zip code 78383: 80.4 (low, U.S. average is 100)
Land area: 152.9 sq. mi. Water area: 7.0 sq. mi.
Population density: 29 people per square mile
(very low).
OSM Map
General Map
Google Map
MSN Map
OSM Map
General Map
Google Map
MSN Map
OSM Map
General Map
Google Map
MSN Map
OSM Map
General Map
Google Map
MSN Map
Please wait while loading the map...
Real estate property taxes paid for housing units in 2022:
This zip code:
0.7% ($1,806)
Texas:
1.5% ($4,050)
Median real estate property taxes paid for housing units with mortgages in 2022: $3,526 (1.0%) Median real estate property taxes paid for housing units with no mortgage in 2022: $1,262 (1.0%)
Averages for the 2020 tax year for zip code 78383, filed in 2021:
Average Adjusted Gross Income (AGI) in 2020: $73,900 (Individual Income Tax Returns)
Here:
$73,900
State:
$77,054
Salary/wage: $60,724 (reported on 78.9% of returns)
Here:
$60,724
State:
$62,766
(% of AGI for various income ranges: 1202.1% for AGIs below $25k, 3225.5% for AGIs $25k-50k, 5755.9% for AGIs $50k-75k, 8248.3% for AGIs $75k-100k, 17213.8% for AGIs $100k-200k, 60940.0% for AGIs over 200k)
Taxable interest for individuals: $1,415 (reported on 31.3% of returns)
This zip code:
$1,415
Texas:
$2,665
(% of AGI for various income ranges: 20.5% for AGIs below $25k, 24.8% for AGIs $25k-50k, 47.6% for AGIs $50k-75k, 22.5% for AGIs $75k-100k, 103.1% for AGIs $100k-200k, 1036.7% for AGIs over 200k)
Ordinary dividends: $5,954 (reported on 15.7% of returns)
Here:
$5,954
State:
$10,044
(% of AGI for various income ranges: 6.7% for AGIs below $25k, 32.1% for AGIs $25k-50k, 30.0% for AGIs $50k-75k, 25.8% for AGIs $75k-100k, 191.9% for AGIs $100k-200k, 3466.7% for AGIs over 200k)
Net capital gain/loss in AGI: +$22,061 (reported on 13.9% of returns)
Here:
+$22,061
State:
+$39,590
(% of AGI for various income ranges: 2.1% for AGIs below $25k, 32.8% for AGIs $25k-50k, 21.8% for AGIs $50k-75k, 34.2% for AGIs $75k-100k, 581.2% for AGIs $100k-200k, 13210.0% for AGIs over 200k)
Profit/loss from business: +$12,939 (reported on 18.7% of returns)
Here:
+$12,939
State:
+$10,888
(% of AGI for various income ranges: 137.9% for AGIs below $25k, 120.7% for AGIs $25k-50k, 250.6% for AGIs $50k-75k, 130.8% for AGIs $75k-100k, 288.1% for AGIs $100k-200k, 6930.0% for AGIs over 200k)
Taxable individual retirement arrangement distribution: $30,236 (reported on 8.4% of returns)
78383:
$30,236
Texas:
$24,740
(% of AGI for various income ranges: 47.9% for AGIs below $25k, 159.3% for AGIs $25k-50k, 378.2% for AGIs $50k-75k, 480.0% for AGIs $75k-100k, 1478.1% for AGIs $100k-200k)
Total itemized deductions: $45,820 (reported on 6.0% of returns)
Here:
$45,820
State:
$40,428
(% of AGI for various income ranges: 757.1% for AGIs $50k-75k, 683.8% for AGIs $100k-200k, 7336.7% for AGIs over 200k)
Charity contributions: $13,367 (reported on 5.4% of returns)
Here:
$13,367
State:
$18,201
(% of AGI for various income ranges: 30.0% for AGIs $25k-50k, 160.6% for AGIs $100k-200k, 2863.3% for AGIs over 200k)
Taxes paid: $6,890 (reported on 6.0% of returns)
78383:
$6,890
State:
$7,821
(% of AGI for various income ranges: 111.2% for AGIs $50k-75k, 155.0% for AGIs $100k-200k, 840.0% for AGIs over 200k)
Earned income credit: $2,528 (reported on 19.3% of returns)
Here:
$2,528
State:
$2,584
(% of AGI for various income ranges: 151.3% for AGIs below $25k, 75.5% for AGIs $25k-50k)
Percentage of individuals using paid preparers for their 2020 taxes: 89.8%
Here:
90%
State:
92%
(% for various income ranges: 86.8% for AGIs below $25k, 91.7% for AGIs $25k-50k, 87.5% for AGIs $50k-75k, 94.1% for AGIs $75k-100k, 92.3% for AGIs $100k-200k, 90.0% for AGIs over 200k)
Averages for the 2012 tax year for zip code 78383, filed in 2013:
Average Adjusted Gross Income (AGI) in 2012: $86,560 (Individual Income Tax Returns)
Here:
$86,560
State:
$65,384
Salary/wage: $58,706 (reported on 80.3% of returns)
Here:
$58,706
State:
$52,524
(% of AGI for various income ranges: 73.6% for AGIs below $25k, 75.4% for AGIs $25k-50k, 74.7% for AGIs $50k-75k, 76.0% for AGIs $75k-100k, 79.3% for AGIs $100k-200k, 24.3% for AGIs over 200k)
Taxable interest for individuals: $1,530 (reported on 28.3% of returns)
This zip code:
$1,530
Texas:
$2,372
(% of AGI for various income ranges: 1.4% for AGIs below $25k, 0.5% for AGIs $25k-50k, 0.5% for AGIs $50k-75k, 0.4% for AGIs $75k-100k, 0.3% for AGIs $100k-200k, 0.5% for AGIs over 200k)
Ordinary dividends: $10,210 (reported on 13.2% of returns)
Here:
$10,210
State:
$9,721
(% of AGI for various income ranges: 0.4% for AGIs below $25k, 0.3% for AGIs $25k-50k, 0.3% for AGIs $50k-75k, 1.0% for AGIs $75k-100k, 0.4% for AGIs $100k-200k, 3.0% for AGIs over 200k)
Net capital gain/loss in AGI: +$30,438 (reported on 10.5% of returns)
Here:
+$30,438
State:
+$35,319
(% of AGI for various income ranges: 0.2% for AGIs $25k-50k, 0.8% for AGIs $100k-200k, 8.2% for AGIs over 200k)
Profit/loss from business: +$17,412 (reported on 21.1% of returns)
Here:
+$17,412
State:
+$13,732
(% of AGI for various income ranges: 7.2% for AGIs below $25k, 3.1% for AGIs $25k-50k, 3.2% for AGIs $50k-75k, 1.6% for AGIs $75k-100k, 7.5% for AGIs $100k-200k, 3.1% for AGIs over 200k)
Taxable individual retirement arrangement distribution: $18,285 (reported on 8.6% of returns)
78383:
$18,285
Texas:
$19,511
(% of AGI for various income ranges: 2.1% for AGIs below $25k, 2.0% for AGIs $25k-50k, 4.3% for AGIs $50k-75k, 4.1% for AGIs $75k-100k, 2.9% for AGIs $100k-200k)
Total itemized deductions: $22,957 (11% of AGI, reported on 23.0% of returns)
Here:
$22,957
State:
$24,724
Here:
11.1% of AGI
State:
15.9% of AGI
(% of AGI for various income ranges: 7.4% for AGIs below $25k, 5.9% for AGIs $25k-50k, 8.5% for AGIs $50k-75k, 7.1% for AGIs $75k-100k, 8.2% for AGIs $100k-200k, 4.0% for AGIs over 200k)
Charity contributions: $5,467 (reported on 17.8% of returns)
Here:
$5,467
State:
$6,808
(% of AGI for various income ranges: 1.1% for AGIs $25k-50k, 1.5% for AGIs $50k-75k, 0.8% for AGIs $75k-100k, 1.2% for AGIs $100k-200k, 1.2% for AGIs over 200k)
Taxes paid: $5,052 (reported on 21.7% of returns)
78383:
$5,052
State:
$6,921
(% of AGI for various income ranges: 0.7% for AGIs below $25k, 1.0% for AGIs $25k-50k, 1.5% for AGIs $50k-75k, 1.4% for AGIs $75k-100k, 2.0% for AGIs $100k-200k, 0.9% for AGIs over 200k)
Earned income credit: $2,389 (reported on 18.4% of returns)
Here:
$2,389
State:
$2,570
(% of AGI for various income ranges: 8.5% for AGIs below $25k, 1.2% for AGIs $25k-50k)
Percentage of individuals using paid preparers for their 2012 taxes: 59.9%
Here:
60%
State:
51%
(% for various income ranges: 52.8% for AGIs below $25k, 62.5% for AGIs $25k-50k, 54.5% for AGIs $50k-75k, 60.0% for AGIs $75k-100k, 69.6% for AGIs $100k-200k, 85.7% for AGIs over 200k)
Averages for the 2004 tax year for zip code 78383, filed in 2005:
Average Adjusted Gross Income (AGI) in 2004: $83,968 (Individual Income Tax Returns)
Here:
$83,968
State:
$47,881
Salary/wage: $44,267 (reported on 82.4% of returns)
Here:
$44,267
State:
$41,947
(% of AGI for various income ranges: 90.9% for AGIs below $10k, 75.4% for AGIs $10k-25k, 79.7% for AGIs $25k-50k, 77.9% for AGIs $50k-75k, 84.4% for AGIs $75k-100k, 17.1% for AGIs over 100k)
Taxable interest for individuals: $1,383 (reported on 36.0% of returns)
This zip code:
$1,383
Texas:
$2,255
(% of AGI for various income ranges: 1.2% for AGIs $10k-25k, 1.2% for AGIs $25k-50k, 0.9% for AGIs $50k-75k, 0.5% for AGIs $75k-100k, 0.4% for AGIs over 100k)
Taxable dividends: $1,745 (reported on 17.5% of returns)
Here:
$1,745
State:
$4,261
(% of AGI for various income ranges: 0.7% for AGIs $10k-25k, 0.3% for AGIs $25k-50k, 0.5% for AGIs $50k-75k, 0.3% for AGIs $75k-100k, 0.3% for AGIs over 100k)
Net capital gain/loss: +$73,086 (reported on 13.1% of returns)
Here:
+$73,086
State:
+$16,110
(% of AGI for various income ranges: -0.3% for AGIs $10k-25k, -0.2% for AGIs $25k-50k, 0.7% for AGIs $50k-75k, 0.1% for AGIs $75k-100k, 19.5% for AGIs over 100k)
Profit/loss from business: +$8,590 (reported on 18.7% of returns)
Here:
+$8,590
State:
+$11,013
(% of AGI for various income ranges: 3.9% for AGIs $10k-25k, 2.6% for AGIs $25k-50k, -0.3% for AGIs $50k-75k, -0.6% for AGIs $75k-100k, 2.5% for AGIs over 100k)
IRA payment deduction: $3,292 (reported on 2.2% of returns)
78383:
$3,292
Texas:
$3,120
Total itemized deductions: $18,643 (9% of AGI, reported on 24.5% of returns)
Here:
$18,643
State:
$19,631
Here:
8.7% of AGI
State:
18.9% of AGI
(% of AGI for various income ranges: 6.6% for AGIs $10k-25k, 8.0% for AGIs $25k-50k, 8.5% for AGIs $50k-75k, 12.2% for AGIs $75k-100k, 2.8% for AGIs over 100k)
Charity contributions deductions: $3,665 (2% of AGI, reported on 19.8% of returns)
Here:
$3,665
State:
$4,753
Here:
2.1% of AGI
State:
4.2% of AGI
(% of AGI for various income ranges: 0.6% for AGIs $10k-25k, 0.7% for AGIs $25k-50k, 1.0% for AGIs $50k-75k, 2.0% for AGIs $75k-100k, 0.7% for AGIs over 100k)
Total tax: $13,727 (reported on 76.9% of returns)
78383:
$13,727
State:
$9,058
(% of AGI for various income ranges: 3.0% for AGIs $10k-25k, 6.0% for AGIs $25k-50k, 9.1% for AGIs $50k-75k, 10.7% for AGIs $75k-100k, 16.1% for AGIs over 100k)
Earned income credit: $2,192 (reported on 16.0% of returns)
Here:
$2,192
State:
$2,024
Percentage of individuals using paid preparers for their 2004 taxes: 61.8%
Here:
62%
State:
57%
(% for various income ranges: 33.3% for AGIs below $10k, 63.6% for AGIs $10k-25k, 63.8% for AGIs $25k-50k, 54.9% for AGIs $50k-75k, 67.0% for AGIs $75k-100k, 70.3% for AGIs over 100k)
Household received Food Stamps/SNAP in the past 12 months: 122 Household did not receive Food Stamps/SNAP in the past 12 months: 1,574
Women who had a birth in the past 12 months: 34 (0 now married, 32 unmarried) Women who did not have a birth in the past 12 months: 713 (412 now married, 298 unmarried)
Housing units in zip code 78383 with a mortgage: 683 Median monthly owner costs for units with a mortgage: $1,978 Median monthly owner costs for units without a mortgage: $433
Residents with income below the poverty level in 2022:
This zip code:
18.3%
Whole state:
14.0%
Residents with income below 50% of the poverty level in 2022:
This zip code:
3.6%
Whole state:
7.4%
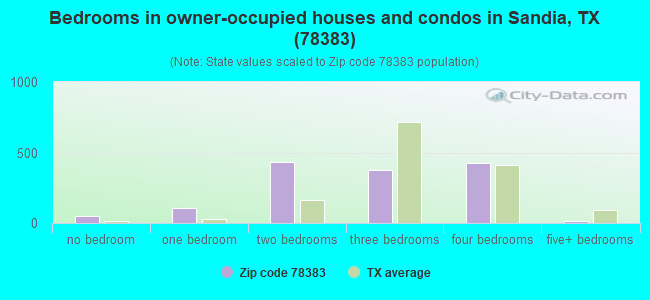
Median number of rooms in houses and condos:
Here:
6.0
State:
6.3
Median number of rooms in apartments:
Here:
4.7
State:
4.0
Notable locations in this zip code not listed on our city pages
Notable locations in zip code 78383: Camp Merrill (A), Brushy Windmill (B), Fort Ramirez Ruins (C), House Windmill (D), Huisache Windmill (E), Javelina Windmill (F), Old Casa Blanca Fort (G), Old Turkey Windmill (H), Shawondasse Camp (I), Wade Ranch (J), Zephyr Encampment (K), Sandia Ambulance Services (L), Lagarto Volunteer Fire Department (M), Sandia Fire Department (N). Display/hide their locations on the map
Creeks: Ramirena Creek (A), Longoria Creek (B), Julian Creek (C), Lagarto Creek (D), Lain Creek (E), Penitas Creek (F), Charquitas Creek (G), Barbone Creek (H). Display/hide their locations on the map
In group quarters: 52 (-1 institutionalized population)
Size of family households: 749 2-persons, 64 3-persons, 184 4-persons, 69 5-persons, 52 6-persons, 63 7-or-more-persons
Size of nonfamily households: 443 1-person, 80 2-persons
480 married couples with children.
459 single-parent households (459 women).
77.3% of residents of 78383 zip code speak English at home.
18.1% of residents speak Spanish at home (47% very well, 8% well, 44% not well).
1.5% of residents speak other Indo-European language at home (82% very well, 18% well).
2.2% of residents speak Asian or Pacific Island language at home (100% very well).
0.7% of residents speak other language at home (93% very well, 7% not at all).
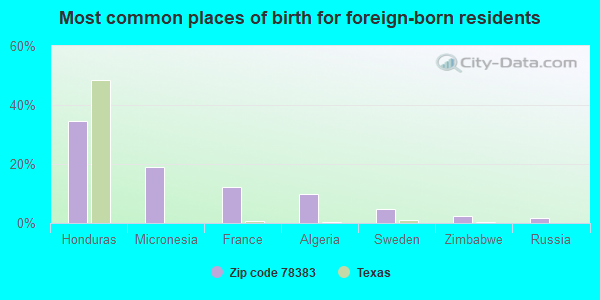
Foreign born population: 284 (6.3%) (64.4% of them are naturalized citizens)
This zip code:
6.3%
Whole state:
17.2%
35%Honduras
19%Micronesia
12%France
10%Algeria
5%Sweden
3%Zimbabwe
2%Russia
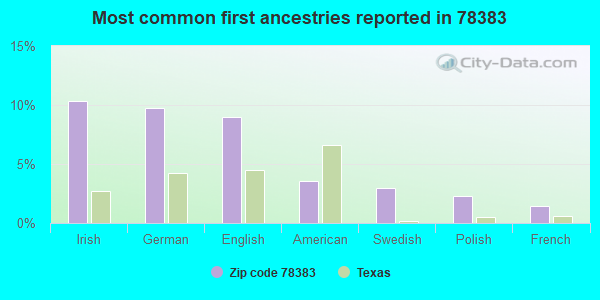
10%Irish
10%German
9%English
4%American
3%Swedish
2%Polish
1%French
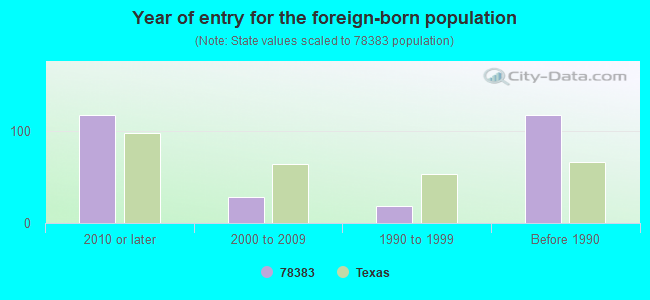
Year of entry for the foreign-born population
1182010 or later
282000 to 2009
191990 to 1999
118Before 1990
Housing units lacking complete plumbing facilities: 16.8% Housing units lacking complete kitchen facilities: 13.9%
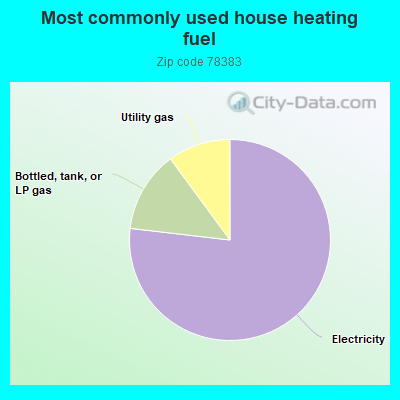
77.0%Electricity
13.1%Bottled, tank, or LP gas
10.1%Utility gas
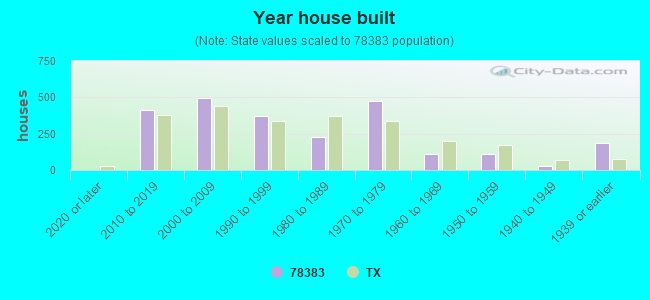
Population in 1990: 2,053. Population change in the 1990s: +1,022 (+49.8%).
Place of birth for U.S.-born residents:
This state: 3,328
Northeast: 71
Midwest: 388
South: 307
West: 84
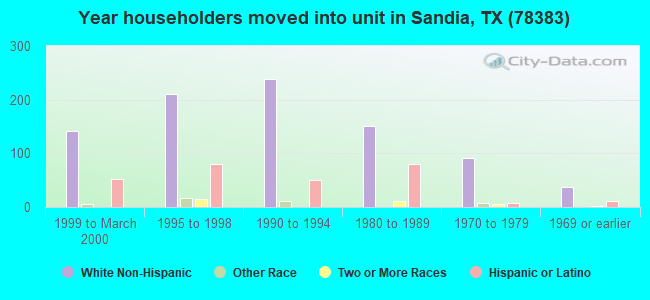
60% of the 78383 zip code residents lived in the same house 5 years ago. Out of people who lived in different houses, 30% lived in this county. Out of people who lived in different counties, 50% lived in Texas.
93% of the 78383 zip code residents lived in the same house 1 year ago. Out of people who lived in different houses, 25% moved from this county. Out of people who lived in different houses, 74% moved from different county within same state. Out of people who lived in different houses, 4% moved from different state.
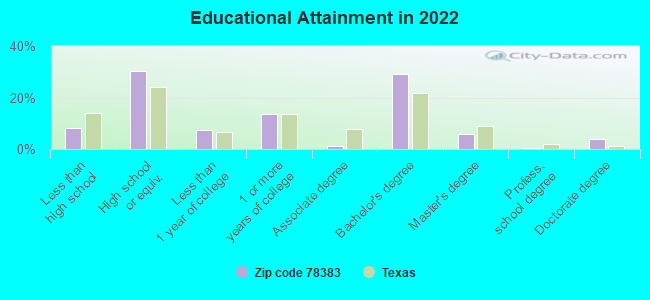
Private vs. public school enrollment:
Students in private schools in grades 1 to 8 (elementary and middle school): 47
Here:
13.7%
Texas:
8.8%
Students in private schools in grades 9 to 12 (high school): 25
Here:
13.8%
Texas:
8.0%
Students in private undergraduate colleges: 2
Here:
16.6%
Texas:
16.2%
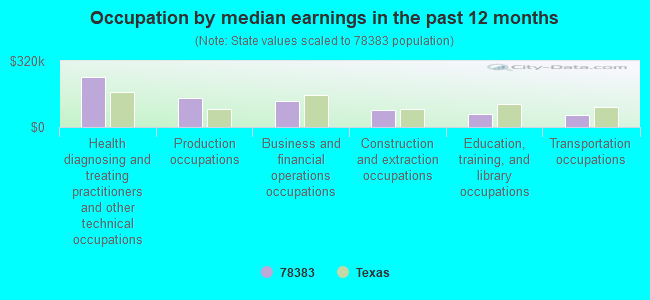
Occupation by median earnings in the past 12 months ($)
243,769Health diagnosing and treating practitioners and other technical occupations
141,453Production occupations
124,322Business and financial operations occupations
80,776Construction and extraction occupations
61,262Education, training, and library occupations
56,018Transportation occupations
Top industries in this zip code by the number of employees in 2005:
Accommodation and Food Services: Full-Service Restaurants (10-19 employees: 2 establishments)
Other Services (except Public Administration): Religious Organizations (5-9: 2, 1-4: 1)
Educational Services: Sports and Recreation Instruction (5-9: 2)
Construction: New Single-Family Housing Construction (except Operative Builders) (5-9: 1)
Real Estate and Rental and Leasing: Lessors of Other Real Estate Property (5-9: 1)
Administrative and Support and Waste Management and Remediation Services: Septic Tank and Related Services (5-9: 1)
Mining: Support Activities for Oil and Gas Operations (1-4: 2)
Administrative and Support and Waste Management and Remediation Services: Landscaping Services (1-4: 1)
People in group quarters in 2010:
5 people in workers' group living quarters and job corps centers
People in group quarters in 2000:
24 people in religious group quarters
Fatal accident statistics in 2012:
Fatal accident count: 1
Vehicles involved in fatal accidents: 3
Fatal accidents caused by drunken drivers: 1
Fatalities: 2
Persons involved in fatal accidents: 9
Pedestrians involved in fatal accidents: 0
Fatal accident statistics in 2011:
Fatal accident count: 1
Vehicles involved in fatal accidents: 1
Fatal accidents caused by drunken drivers: 1
Fatalities: 1
Persons involved in fatal accidents: 1
Pedestrians involved in fatal accidents: 0
Most common first names in zip code 78383 among deceased individuals
Name
Count
Lived (average)
John
18
74.5 years
James
16
70.6 years
Robert
15
68.3 years
Thomas
11
68.3 years
William
10
73.1 years
Charles
10
70.4 years
Mary
10
74.9 years
Frank
8
68.4 years
Henry
8
79.4 years
George
7
72.0 years
Most common last names in zip code 78383 among deceased individuals
Last name
Count
Lived (average)
Smith
19
78.1 years
Jones
9
77.4 years
Garcia
8
80.5 years
Crisp
7
73.6 years
Miller
7
77.1 years
Knolle
6
86.2 years
Cox
6
81.5 years
Perez
6
70.0 years
Machen
5
78.4 years
Blair
5
75.6 years
Discuss Sandia, Texas (TX) on our hugely popular Texas forum.

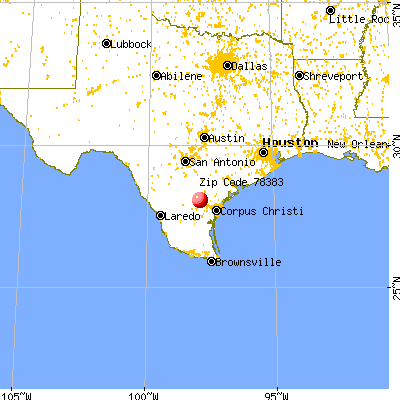


 Nearest zip codes: 78372, 78368, 78022, 78391, 78352, 78339.