Estimated zip code population in 2022: 4,244 Zip code population in 2010: 4,039 Zip code population in 2000: 5,274
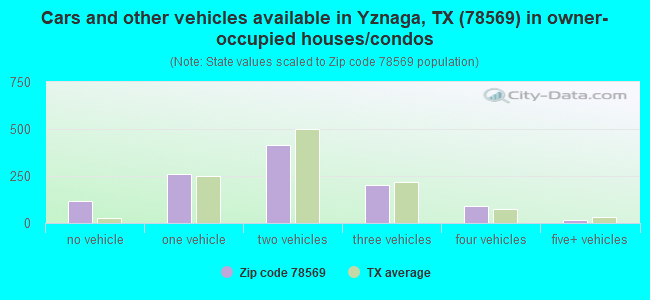
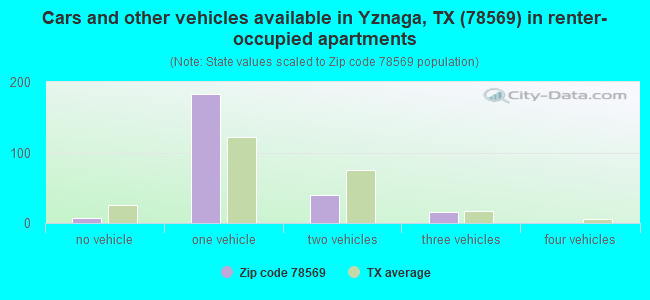
Houses and condos: 1,555 Renter-occupied apartments: 244
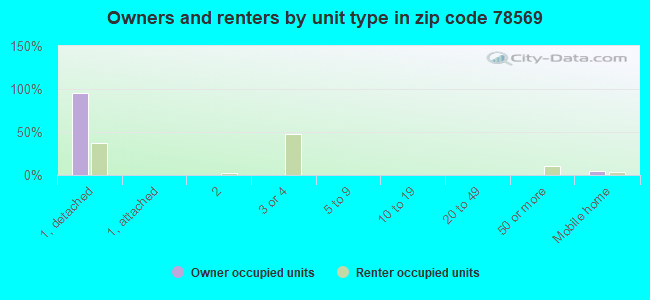
% of renters here:
18%
State:
38%
March 2022 cost of living index in zip code 78569: 75.6 (low, U.S. average is 100)
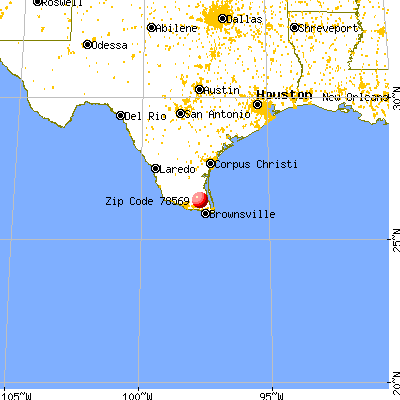
Land area: 132.8 sq. mi. Water area: 1.0 sq. mi.
Population density: 32 people per square mile
(very low).
OSM Map
General Map
Google Map
MSN Map
OSM Map
General Map
Google Map
MSN Map
OSM Map
General Map
Google Map
MSN Map
OSM Map
General Map
Google Map
MSN Map
Please wait while loading the map...
Real estate property taxes paid for housing units in 2022:
This zip code:
1.1% ($1,355)
Texas:
1.5% ($4,050)
Median real estate property taxes paid for housing units with mortgages in 2022: $3,649 (1.9%) Median real estate property taxes paid for housing units with no mortgage in 2022: $1,153 (1.5%)
Business Search- 14 Million verified businesses
Males: 2,271
(53.5%)
Females: 1,972
(46.5%)
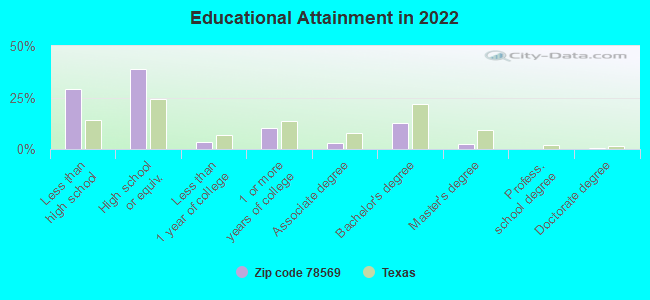
For population 25 years and over in 78569:
High school or higher: 70.2%
Bachelor's degree or higher: 15.8%
Graduate or professional degree: 3.0%
Unemployed: 3.6%
Mean travel time to work (commute): 26.0 minutes
For population 15 years and over in 78569:
Never married: 39.1%
Now married: 44.9%
Separated: 2.8%
Widowed: 4.9%
Divorced: 8.3%
Zip code 78569 compared to state average:
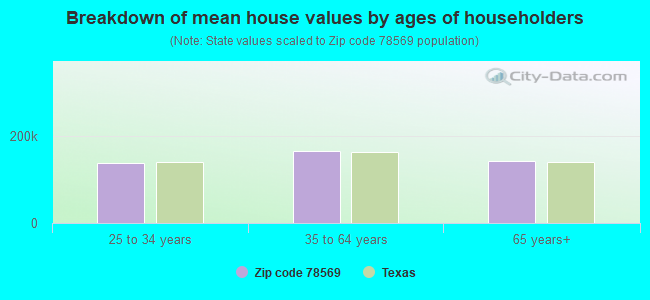
Median house value significantly below state average.
Black race population percentage significantly below state average.
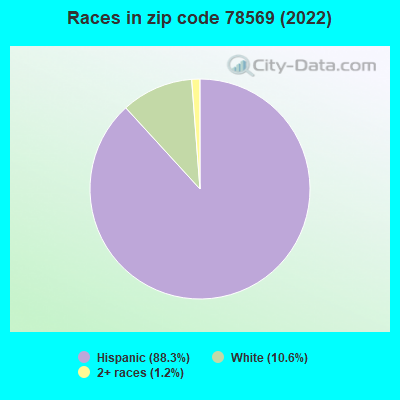
Hispanic race population percentage above state average.
Median age above state average.
Renting percentage below state average.
Length of stay since moving in significantly above state average.
Percentage of population with a bachelor's degree or higher below state average.
Averages for the 2020 tax year for zip code 78569, filed in 2021:
Average Adjusted Gross Income (AGI) in 2020: $41,949 (Individual Income Tax Returns)
Here:
$41,949
State:
$77,054
Salary/wage: $37,064 (reported on 86.9% of returns)
Here:
$37,064
State:
$62,766
(% of AGI for various income ranges: 1325.5% for AGIs below $25k, 3493.5% for AGIs $25k-50k, 6435.9% for AGIs $50k-75k, 10387.1% for AGIs $75k-100k, 17297.5% for AGIs $100k-200k)
Taxable interest for individuals: $794 (reported on 10.3% of returns)
This zip code:
$794
Texas:
$2,665
(% of AGI for various income ranges: 2.1% for AGIs below $25k, 1.7% for AGIs $25k-50k, 7.6% for AGIs $50k-75k, 136.2% for AGIs $100k-200k)
Ordinary dividends: $1,700 (reported on 2.9% of returns)
Here:
$1,700
State:
$10,044
(% of AGI for various income ranges: 7.8% for AGIs $25k-50k, 61.3% for AGIs $100k-200k)
Net capital gain/loss in AGI: +$3,443 (reported on 4.0% of returns)
Here:
+$3,443
State:
+$39,590
(% of AGI for various income ranges: 9.1% for AGIs $25k-50k, 248.7% for AGIs $100k-200k)
Profit/loss from business: +$4,393 (reported on 16.6% of returns)
Here:
+$4,393
State:
+$10,888
(% of AGI for various income ranges: 95.3% for AGIs below $25k, 51.1% for AGIs $25k-50k, 85.3% for AGIs $50k-75k, 32.9% for AGIs $75k-100k, 350.0% for AGIs $100k-200k)
Taxable individual retirement arrangement distribution: $19,125 (reported on 2.3% of returns)
78569:
$19,125
Texas:
$24,740
(% of AGI for various income ranges: 21.0% for AGIs below $25k, 907.1% for AGIs $75k-100k)
Total itemized deductions: $31,050 (reported on 2.3% of returns)
Here:
$31,050
State:
$40,428
(% of AGI for various income ranges: 730.6% for AGIs $50k-75k)
Charity contributions: $6,633 (reported on 1.7% of returns)
Here:
$6,633
State:
$18,201
(% of AGI for various income ranges: 117.1% for AGIs $50k-75k)
Taxes paid: $6,267 (reported on 1.7% of returns)
78569:
$6,267
State:
$7,821
(% of AGI for various income ranges: 110.6% for AGIs $50k-75k)
Earned income credit: $2,905 (reported on 32.6% of returns)
Here:
$2,905
State:
$2,584
(% of AGI for various income ranges: 182.7% for AGIs below $25k, 113.7% for AGIs $25k-50k)
Percentage of individuals using paid preparers for their 2020 taxes: 92.0%
Here:
92%
State:
92%
(% for various income ranges: 90.9% for AGIs below $25k, 92.5% for AGIs $25k-50k, 90.9% for AGIs $50k-75k, 90.0% for AGIs $75k-100k, 100.0% for AGIs $100k-200k, 100.0% for AGIs over 200k)
Averages for the 2012 tax year for zip code 78569, filed in 2013:
Average Adjusted Gross Income (AGI) in 2012: $36,102 (Individual Income Tax Returns)
Here:
$36,102
State:
$65,384
Salary/wage: $30,225 (reported on 86.8% of returns)
Here:
$30,225
State:
$52,524
(% of AGI for various income ranges: 79.5% for AGIs below $25k, 85.6% for AGIs $25k-50k, 78.9% for AGIs $50k-75k, 82.2% for AGIs $75k-100k, 47.8% for AGIs $100k-200k)
Taxable interest for individuals: $626 (reported on 11.9% of returns)
This zip code:
$626
Texas:
$2,372
(% of AGI for various income ranges: 0.1% for AGIs $25k-50k, 0.3% for AGIs $50k-75k, 0.4% for AGIs $100k-200k)
Ordinary dividends: $2,583 (reported on 3.8% of returns)
Here:
$2,583
State:
$9,721
Net capital gain/loss in AGI: +$1,075 (reported on 2.5% of returns)
Here:
+$1,075
State:
+$35,319
Profit/loss from business: +$7,721 (reported on 18.2% of returns)
Here:
+$7,721
State:
+$13,732
(% of AGI for various income ranges: 10.4% for AGIs below $25k, 1.6% for AGIs $25k-50k, 4.5% for AGIs $50k-75k, 7.1% for AGIs $75k-100k)
Taxable individual retirement arrangement distribution: $7,867 (reported on 3.8% of returns)
78569:
$7,867
Texas:
$19,511
Total itemized deductions: $19,084 (23% of AGI, reported on 11.9% of returns)
Here:
$19,084
State:
$24,724
Here:
23.4% of AGI
State:
15.9% of AGI
(% of AGI for various income ranges: 6.7% for AGIs $25k-50k, 8.4% for AGIs $50k-75k, 10.3% for AGIs $75k-100k, 7.3% for AGIs $100k-200k)
Charity contributions: $4,779 (reported on 8.8% of returns)
Here:
$4,779
State:
$6,808
(% of AGI for various income ranges: 0.7% for AGIs $25k-50k, 0.9% for AGIs $50k-75k, 1.7% for AGIs $75k-100k, 2.3% for AGIs $100k-200k)
Taxes paid: $3,539 (reported on 11.3% of returns)
78569:
$3,539
State:
$6,921
(% of AGI for various income ranges: 1.0% for AGIs $25k-50k, 1.4% for AGIs $50k-75k, 1.8% for AGIs $75k-100k, 1.6% for AGIs $100k-200k)
Earned income credit: $2,822 (reported on 42.8% of returns)
Here:
$2,822
State:
$2,570
(% of AGI for various income ranges: 14.7% for AGIs below $25k, 2.2% for AGIs $25k-50k)
Percentage of individuals using paid preparers for their 2012 taxes: 63.5%
Here:
64%
State:
51%
(% for various income ranges: 65.1% for AGIs below $25k, 65.9% for AGIs $25k-50k, 57.1% for AGIs $50k-75k, 50.0% for AGIs $75k-100k, 60.0% for AGIs $100k-200k)
Averages for the 2004 tax year for zip code 78569, filed in 2005:
Average Adjusted Gross Income (AGI) in 2004: $26,518 (Individual Income Tax Returns)
Here:
$26,518
State:
$47,881
Salary/wage: $22,318 (reported on 89.1% of returns)
Here:
$22,318
State:
$41,947
(% of AGI for various income ranges: 90.1% for AGIs below $10k, 87.0% for AGIs $10k-25k, 88.9% for AGIs $25k-50k, 76.4% for AGIs $50k-75k, 82.6% for AGIs $75k-100k, 30.3% for AGIs over 100k)
Taxable interest for individuals: $1,827 (reported on 14.9% of returns)
This zip code:
$1,827
Texas:
$2,255
(% of AGI for various income ranges: 1.1% for AGIs below $10k, 0.2% for AGIs $10k-25k, 0.9% for AGIs $25k-50k, 1.0% for AGIs $50k-75k, 0.7% for AGIs $75k-100k, 2.5% for AGIs over 100k)
Taxable dividends: $4,625 (reported on 4.9% of returns)
Here:
$4,625
State:
$4,261
(% of AGI for various income ranges: 0.3% for AGIs below $10k, 0.0% for AGIs $10k-25k, 0.1% for AGIs $25k-50k, 0.1% for AGIs $50k-75k, 4.2% for AGIs over 100k)
Net capital gain/loss: +$4,679 (reported on 3.6% of returns)
Here:
+$4,679
State:
+$16,110
(% of AGI for various income ranges: -0.8% for AGIs below $10k, 0.4% for AGIs $25k-50k, 0.0% for AGIs $50k-75k, 3.0% for AGIs over 100k)
Profit/loss from business: +$4,962 (reported on 16.0% of returns)
Here:
+$4,962
State:
+$11,013
(% of AGI for various income ranges: 14.5% for AGIs below $10k, 6.2% for AGIs $10k-25k, 0.3% for AGIs $25k-50k, 1.3% for AGIs $50k-75k, -0.1% for AGIs $75k-100k, 2.5% for AGIs over 100k)
Profit/loss from farming: +$1,967 (reported on 4.1% of returns)
Here:
+$1,967
State:
-$9,403
(% of AGI for various income ranges: 0.1% for AGIs $10k-25k, -1.1% for AGIs $25k-50k, 0.5% for AGIs $50k-75k, 2.6% for AGIs over 100k)
IRA payment deduction: $3,412 (reported on 1.2% of returns)
78569:
$3,412
Texas:
$3,120
Total itemized deductions: $16,591 (23% of AGI, reported on 7.8% of returns)
Here:
$16,591
State:
$19,631
Here:
23.0% of AGI
State:
18.9% of AGI
(% of AGI for various income ranges: 2.8% for AGIs $10k-25k, 3.8% for AGIs $25k-50k, 8.3% for AGIs $50k-75k, 7.9% for AGIs $75k-100k, 6.0% for AGIs over 100k)
Charity contributions deductions: $3,796 (5% of AGI, reported on 6.3% of returns)
Here:
$3,796
State:
$4,753
Here:
4.9% of AGI
State:
4.2% of AGI
(% of AGI for various income ranges: 0.3% for AGIs $10k-25k, 0.4% for AGIs $25k-50k, 1.1% for AGIs $50k-75k, 0.8% for AGIs $75k-100k, 2.7% for AGIs over 100k)
Total tax: $4,276 (reported on 53.4% of returns)
78569:
$4,276
State:
$9,058
(% of AGI for various income ranges: 3.1% for AGIs below $10k, 2.6% for AGIs $10k-25k, 5.2% for AGIs $25k-50k, 8.3% for AGIs $50k-75k, 11.3% for AGIs $75k-100k, 20.9% for AGIs over 100k)
Earned income credit: $2,229 (reported on 49.5% of returns)
Here:
$2,229
State:
$2,024
Percentage of individuals using paid preparers for their 2004 taxes: 67.3%
Here:
67%
State:
57%
(% for various income ranges: 63.8% for AGIs below $10k, 72.2% for AGIs $10k-25k, 64.9% for AGIs $25k-50k, 57.1% for AGIs $50k-75k, 51.7% for AGIs $75k-100k, 87.0% for AGIs over 100k)
Household received Food Stamps/SNAP in the past 12 months: 320 Household did not receive Food Stamps/SNAP in the past 12 months: 1,032
Women who had a birth in the past 12 months: 53 (54 now married, 0 unmarried) Women who did not have a birth in the past 12 months: 866 (364 now married, 502 unmarried)
Housing units in zip code 78569 with a mortgage: 290 Median monthly owner costs for units with a mortgage: $1,557 Median monthly owner costs for units without a mortgage: $345
Residents with income below the poverty level in 2022:
This zip code:
13.2%
Whole state:
14.0%
Residents with income below 50% of the poverty level in 2022:
This zip code:
8.8%
Whole state:
7.4%
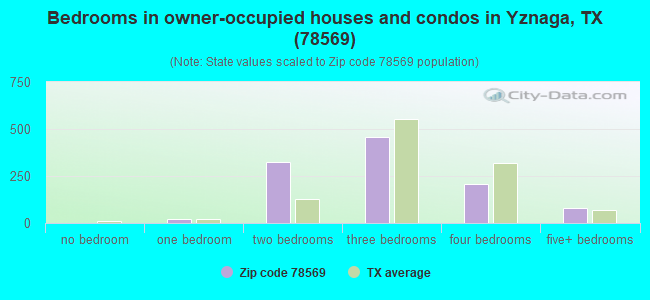
Median number of rooms in houses and condos:
Here:
5.3
State:
6.3
Median number of rooms in apartments:
Here:
2.7
State:
4.0
Notable locations in this zip code not listed on our city pages
Notable locations in zip code 78569: Aldale Ranch (A), Bracero Camp (B), La Jarita Ranch (C), Los Coyotes Gin (D), Tres Norias Ranch (E), Willamar Camp (F), Lyford Volunteer Fire Department (G). Display/hide their locations on the map
Cemeteries: Cementerio de las Burras (1), Tanquesitos Cemetery (2), Noyola Cemetery (3), La Jarita Cemetery (4), San Antonio Cemetery (5), Santa Rita Cemetery (6). Display/hide their locations on the map
In group quarters: 3 (-1 institutionalized population)
Size of family households: 303 2-persons, 263 3-persons, 197 4-persons, 94 5-persons, 57 6-persons, 44 7-or-more-persons
Size of nonfamily households: 337 1-person, 43 2-persons
414 married couples with children.
173 single-parent households (29 men, 144 women).
27.6% of residents of 78569 zip code speak English at home.
72.9% of residents speak Spanish at home (78% very well, 10% well, 5% not well, 7% not at all).
0.1% of residents speak Asian or Pacific Island language at home (100% very well).
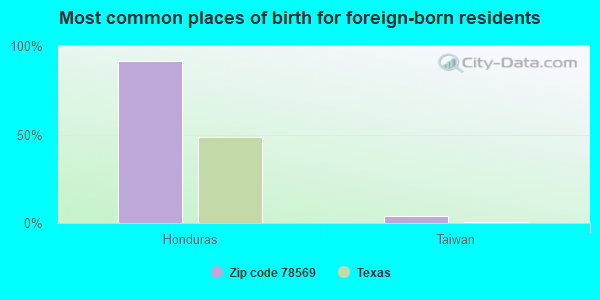
Foreign born population: 511 (12.0%) (70.7% of them are naturalized citizens)
This zip code:
12.0%
Whole state:
17.2%
91%Honduras
4%Taiwan
1%Syria
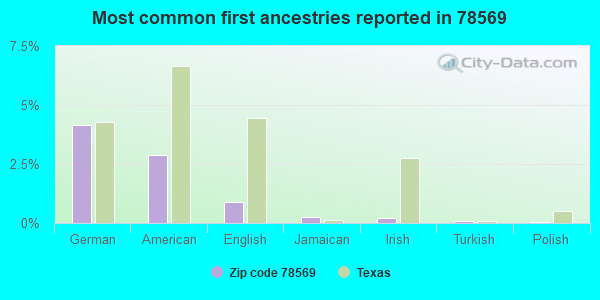
4%German
3%American
1%English
0%Jamaican
0%Irish
0%Turkish
0%Polish
Year of entry for the foreign-born population
562010 or later
402000 to 2009
1771990 to 1999
268Before 1990
Housing units lacking complete plumbing facilities: 5.8% Housing units lacking complete kitchen facilities: 8.0%
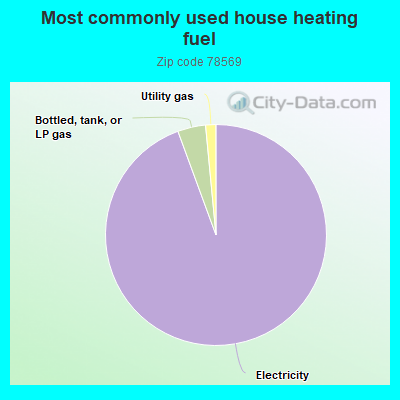
94.5%Electricity
4.1%Bottled, tank, or LP gas
1.5%Utility gas
Population in 1990: 2,757. Population change in the 1990s: +2,517 (+91.3%).
Place of birth for U.S.-born residents:
This state: 3,358
Midwest: 61
South: 110
West: 101
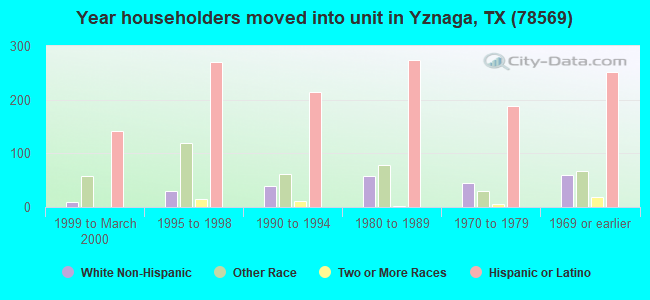
76% of the 78569 zip code residents lived in the same house 5 years ago. Out of people who lived in different houses, 67% lived in this county. Out of people who lived in different counties, 50% lived in Texas.
100% of the 78569 zip code residents lived in the same house 1 year ago. Out of people who lived in different houses, 212% moved from this county.
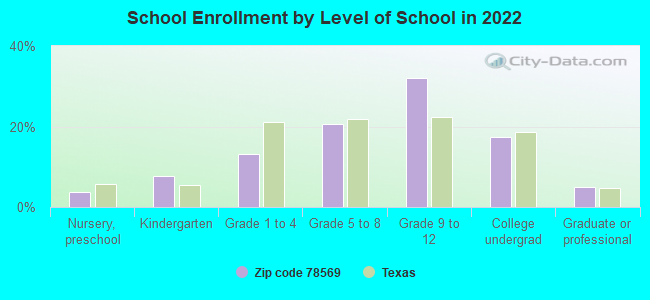
Private vs. public school enrollment:
Students in private schools in grades 1 to 8 (elementary and middle school):
Here:
0.0%
Texas:
8.8%
Students in private schools in grades 9 to 12 (high school):
Here:
0.0%
Texas:
8.0%
Students in private undergraduate colleges: 21
Here:
13.5%
Texas:
16.2%
Occupation by median earnings in the past 12 months ($)
71,712Health diagnosing and treating practitioners and other technical occupations
67,814Installation, maintenance, and repair occupations
56,271Management occupations
50,357Production occupations
39,126Farming, fishing, and forestry occupations
33,991Office and administrative support occupations
Top industries in this zip code by the number of employees in 2005:
Accommodation and Food Services: Full-Service Restaurants (5-9 employees: 2 establishments)
Health Care and Social Assistance: Child Day Care Services (5-9: 1)
Other Services (except Public Administration): Religious Organizations (1-4: 3)
Construction: Commercial and Institutional Building Construction (1-4: 1)
Other Services (except Public Administration): Voluntary Health Organizations (1-4: 1)
Fatal accident statistics in 2012:
Fatal accident count: 1
Vehicles involved in fatal accidents: 1
Fatal accidents caused by drunken drivers: 0
Fatalities: 1
Persons involved in fatal accidents: 8
Pedestrians involved in fatal accidents: 0
Fatal accident statistics in 2010:
Fatal accident count: 1
Vehicles involved in fatal accidents: 2
Fatal accidents caused by drunken drivers: 0
Fatalities: 1
Persons involved in fatal accidents: 2
Pedestrians involved in fatal accidents: 0
Home Mortgage Disclosure Act Aggregated Statistics For Year 2009 (Based on 4 partial tracts)
A) FHA, FSA/RHS & VA Home Purchase Loans
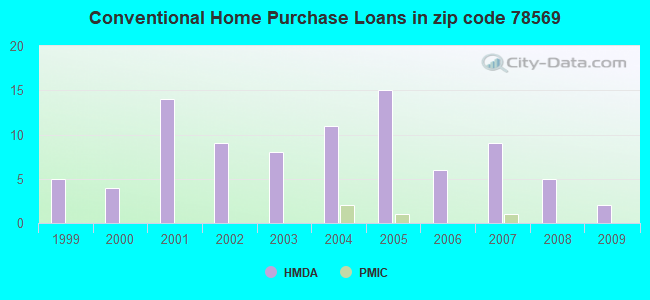
B) Conventional Home Purchase Loans
C) Refinancings
D) Home Improvement Loans
F) Non-occupant Loans on < 5 Family Dwellings (A B C & D)
Number
Average Value
Number
Average Value
Number
Average Value
Number
Average Value
Number
Average Value
LOANS ORIGINATED
3
$86,360
2
$67,185
7
$87,069
1
$40,460
0
$0
APPLICATIONS APPROVED, NOT ACCEPTED
0
$0
0
$0
1
$91,610
1
$25,610
0
$0
APPLICATIONS DENIED
1
$105,560
1
$114,810
5
$93,838
7
$26,659
1
$44,180
APPLICATIONS WITHDRAWN
0
$0
0
$0
1
$131,130
0
$0
0
$0
FILES CLOSED FOR INCOMPLETENESS
1
$91,140
0
$0
1
$121,370
0
$0
0
$0
Aggregated Statistics For Year 2008 (Based on 4 partial tracts)
A) FHA, FSA/RHS & VA Home Purchase Loans
B) Conventional Home Purchase Loans
C) Refinancings
D) Home Improvement Loans
F) Non-occupant Loans on < 5 Family Dwellings (A B C & D)
G) Loans On Manufactured Home Dwelling (A B C & D)
Number
Average Value
Number
Average Value
Number
Average Value
Number
Average Value
Number
Average Value
Number
Average Value
LOANS ORIGINATED
2
$86,910
5
$72,130
6
$98,605
2
$45,595
2
$46,250
1
$33,350
APPLICATIONS APPROVED, NOT ACCEPTED
0
$0
1
$40,460
5
$88,360
1
$65,910
0
$0
0
$0
APPLICATIONS DENIED
1
$68,820
5
$61,940
15
$62,686
10
$24,904
0
$0
3
$26,663
APPLICATIONS WITHDRAWN
1
$124,160
2
$49,665
3
$148,930
1
$17,490
0
$0
0
$0
FILES CLOSED FOR INCOMPLETENESS
1
$80,630
0
$0
1
$31,160
1
$46,660
0
$0
0
$0
Aggregated Statistics For Year 2007 (Based on 4 partial tracts)
A) FHA, FSA/RHS & VA Home Purchase Loans
B) Conventional Home Purchase Loans
C) Refinancings
D) Home Improvement Loans
F) Non-occupant Loans on < 5 Family Dwellings (A B C & D)
G) Loans On Manufactured Home Dwelling (A B C & D)
Number
Average Value
Number
Average Value
Number
Average Value
Number
Average Value
Number
Average Value
Number
Average Value
LOANS ORIGINATED
0
$0
9
$118,164
12
$84,017
8
$29,920
2
$129,270
0
$0
APPLICATIONS APPROVED, NOT ACCEPTED
0
$0
2
$30,990
5
$61,448
2
$22,320
0
$0
1
$35,700
APPLICATIONS DENIED
1
$73,940
9
$123,866
21
$82,440
13
$29,767
1
$63,240
1
$50,690
APPLICATIONS WITHDRAWN
0
$0
3
$69,597
5
$106,092
1
$43,250
0
$0
0
$0
FILES CLOSED FOR INCOMPLETENESS
0
$0
0
$0
2
$39,190
1
$51,900
0
$0
0
$0
Aggregated Statistics For Year 2006 (Based on 4 partial tracts)
B) Conventional Home Purchase Loans
C) Refinancings
D) Home Improvement Loans
F) Non-occupant Loans on < 5 Family Dwellings (A B C & D)
G) Loans On Manufactured Home Dwelling (A B C & D)
Number
Average Value
Number
Average Value
Number
Average Value
Number
Average Value
Number
Average Value
LOANS ORIGINATED
6
$96,875
17
$104,232
3
$27,380
2
$89,050
0
$0
APPLICATIONS APPROVED, NOT ACCEPTED
5
$73,940
4
$122,780
0
$0
0
$0
1
$29,780
APPLICATIONS DENIED
13
$71,729
19
$68,462
8
$21,144
2
$61,845
2
$38,365
APPLICATIONS WITHDRAWN
5
$92,664
5
$85,362
1
$68,360
1
$47,500
0
$0
FILES CLOSED FOR INCOMPLETENESS
0
$0
2
$120,900
0
$0
0
$0
0
$0
Aggregated Statistics For Year 2005 (Based on 4 partial tracts)
A) FHA, FSA/RHS & VA Home Purchase Loans
B) Conventional Home Purchase Loans
C) Refinancings
D) Home Improvement Loans
F) Non-occupant Loans on < 5 Family Dwellings (A B C & D)
G) Loans On Manufactured Home Dwelling (A B C & D)
Number
Average Value
Number
Average Value
Number
Average Value
Number
Average Value
Number
Average Value
Number
Average Value
LOANS ORIGINATED
4
$70,215
15
$60,099
13
$75,668
3
$30,267
2
$65,335
4
$20,688
APPLICATIONS APPROVED, NOT ACCEPTED
0
$0
4
$46,280
5
$54,592
3
$32,667
1
$65,100
1
$28,830
APPLICATIONS DENIED
2
$75,330
9
$62,916
23
$61,340
10
$30,503
2
$68,125
3
$26,350
APPLICATIONS WITHDRAWN
0
$0
3
$99,423
12
$73,437
1
$61,900
0
$0
0
$0
FILES CLOSED FOR INCOMPLETENESS
0
$0
1
$67,620
3
$86,297
0
$0
0
$0
0
$0
Aggregated Statistics For Year 2004 (Based on 4 partial tracts)
A) FHA, FSA/RHS & VA Home Purchase Loans
B) Conventional Home Purchase Loans
C) Refinancings
D) Home Improvement Loans
F) Non-occupant Loans on < 5 Family Dwellings (A B C & D)
G) Loans On Manufactured Home Dwelling (A B C & D)
Number
Average Value
Number
Average Value
Number
Average Value
Number
Average Value
Number
Average Value
Number
Average Value
LOANS ORIGINATED
2
$83,935
11
$70,353
18
$57,259
3
$38,823
2
$57,995
2
$36,610
APPLICATIONS APPROVED, NOT ACCEPTED
0
$0
1
$68,720
5
$43,152
2
$16,045
0
$0
0
$0
APPLICATIONS DENIED
1
$44,090
14
$56,830
19
$48,695
12
$17,384
2
$101,370
3
$29,230
APPLICATIONS WITHDRAWN
0
$0
3
$125,370
11
$65,983
1
$38,590
0
$0
0
$0
FILES CLOSED FOR INCOMPLETENESS
0
$0
0
$0
1
$98,580
0
$0
0
$0
0
$0
Aggregated Statistics For Year 2003 (Based on 4 partial tracts)
A) FHA, FSA/RHS & VA Home Purchase Loans
B) Conventional Home Purchase Loans
C) Refinancings
D) Home Improvement Loans
F) Non-occupant Loans on < 5 Family Dwellings (A B C & D)
Number
Average Value
Number
Average Value
Number
Average Value
Number
Average Value
Number
Average Value
LOANS ORIGINATED
1
$56,270
8
$69,919
15
$60,011
3
$18,043
1
$27,220
APPLICATIONS APPROVED, NOT ACCEPTED
0
$0
2
$48,875
7
$59,254
1
$18,320
0
$0
APPLICATIONS DENIED
0
$0
4
$45,115
24
$56,788
16
$13,662
1
$83,700
APPLICATIONS WITHDRAWN
0
$0
3
$60,533
6
$56,173
0
$0
1
$109,740
FILES CLOSED FOR INCOMPLETENESS
0
$0
0
$0
0
$0
0
$0
0
$0
Aggregated Statistics For Year 2002 (Based on 4 partial tracts)
A) FHA, FSA/RHS & VA Home Purchase Loans
B) Conventional Home Purchase Loans
C) Refinancings
D) Home Improvement Loans
F) Non-occupant Loans on < 5 Family Dwellings (A B C & D)
Number
Average Value
Number
Average Value
Number
Average Value
Number
Average Value
Number
Average Value
LOANS ORIGINATED
1
$73,940
9
$59,173
9
$53,487
6
$7,673
1
$48,790
APPLICATIONS APPROVED, NOT ACCEPTED
0
$0
3
$40,710
3
$33,170
1
$8,640
0
$0
APPLICATIONS DENIED
0
$0
10
$43,864
11
$38,976
14
$8,960
1
$18,140
APPLICATIONS WITHDRAWN
0
$0
3
$24,070
3
$56,887
1
$9,020
0
$0
FILES CLOSED FOR INCOMPLETENESS
0
$0
0
$0
2
$96,490
0
$0
0
$0
Aggregated Statistics For Year 2001 (Based on 4 partial tracts)
A) FHA, FSA/RHS & VA Home Purchase Loans
B) Conventional Home Purchase Loans
C) Refinancings
D) Home Improvement Loans
F) Non-occupant Loans on < 5 Family Dwellings (A B C & D)
Number
Average Value
Number
Average Value
Number
Average Value
Number
Average Value
Number
Average Value
LOANS ORIGINATED
1
$110,210
14
$31,386
12
$51,499
20
$2,764
2
$26,970
APPLICATIONS APPROVED, NOT ACCEPTED
0
$0
7
$39,459
4
$36,968
1
$16,910
0
$0
APPLICATIONS DENIED
0
$0
15
$32,439
16
$42,751
11
$9,927
2
$42,315
APPLICATIONS WITHDRAWN
0
$0
1
$17,210
5
$42,316
3
$8,060
0
$0
FILES CLOSED FOR INCOMPLETENESS
0
$0
0
$0
3
$53,630
0
$0
0
$0
Aggregated Statistics For Year 2000 (Based on 4 partial tracts)
A) FHA, FSA/RHS & VA Home Purchase Loans
B) Conventional Home Purchase Loans
C) Refinancings
D) Home Improvement Loans
F) Non-occupant Loans on < 5 Family Dwellings (A B C & D)
Number
Average Value
Number
Average Value
Number
Average Value
Number
Average Value
Number
Average Value
LOANS ORIGINATED
1
$76,950
4
$35,340
8
$76,081
22
$4,749
0
$0
APPLICATIONS APPROVED, NOT ACCEPTED
3
$34,877
4
$35,590
2
$33,945
0
$0
0
$0
APPLICATIONS DENIED
1
$25,110
26
$31,160
9
$37,561
12
$9,789
2
$24,880
APPLICATIONS WITHDRAWN
1
$43,250
2
$19,995
4
$49,988
0
$0
0
$0
FILES CLOSED FOR INCOMPLETENESS
0
$0
0
$0
2
$36,735
0
$0
0
$0
Aggregated Statistics For Year 1999 (Based on 2 partial tracts)
B) Conventional Home Purchase Loans
C) Refinancings
D) Home Improvement Loans
F) Non-occupant Loans on < 5 Family Dwellings (A B C & D)
Detailed PMIC statistics for the following Tracts:0243.02
, 0246.00
2002 - 2017 National Fire Incident Reporting System (NFIRS) incidents
Based on the data from the years 2002 - 2017 the average number of fire incidents per year is 14. The highest number of fire incidents - 51 took place in 2011, and the least - 1 in 2017. The data has a decreasing trend.
When looking into fire subcategories, the most incidents belonged to: Outside Fires (59.3%), and Structure Fires (16.4%).
Fire incident types reported to NFIRS in Zip Code 78569


+$1,967
-$9,403
(% of AGI for various income ranges: 0.1% for AGIs $10k-25k, -1.1% for AGIs $25k-50k, 0.5% for AGIs $50k-75k, 2.6% for AGIs over 100k) Nearest zip codes: 78594, 78535, 78580, 78593, 78550, 78590.


 Based on the data from the years 2002 - 2017 the average number of fire incidents per year is 14. The highest number of fire incidents - 51 took place in 2011, and the least - 1 in 2017. The data has a decreasing trend.
 When looking into fire subcategories, the most incidents belonged to: Outside Fires (59.3%), and Structure Fires (16.4%).