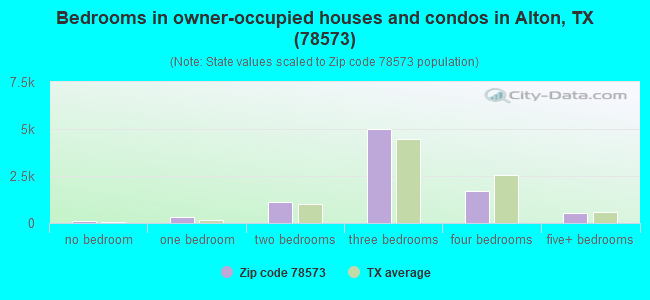
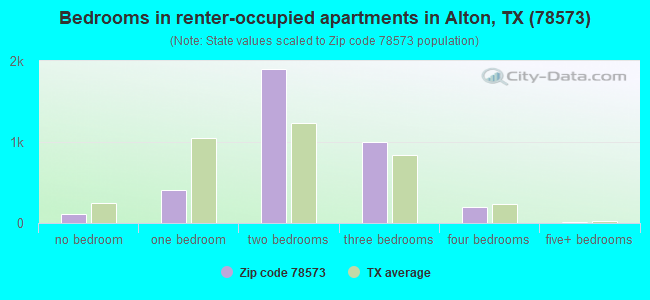
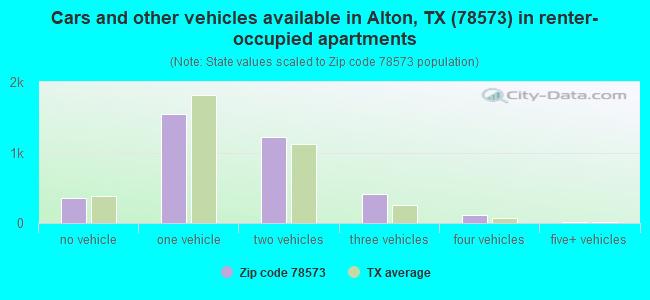
Houses and condos: 13,498 Renter-occupied apartments: 3,677
% of renters here:
30%
State:
38%
March 2022 cost of living index in zip code 78573: 79.4 (low, U.S. average is 100)
Land area: 34.1 sq. mi. Water area: 0.0 sq. mi.
Population density: 1,310 people per square mile
(low).
OSM Map
Google Map
MSN Map
OSM Map
General Map
Google Map
MSN Map
OSM Map
Google Map
MSN Map
OSM Map
Google Map
MSN Map
Please wait while loading the map...
Real estate property taxes paid for housing units in 2022:
This zip code:
1.6% ($2,414)
Texas:
1.5% ($4,050)
Median real estate property taxes paid for housing units with mortgages in 2022: $3,566 (1.8%) Median real estate property taxes paid for housing units with no mortgage in 2022: $1,785 (1.6%)
Business Search- 14 Million verified businesses
Males: 22,101
(49.4%)
Females: 22,624
(50.6%)
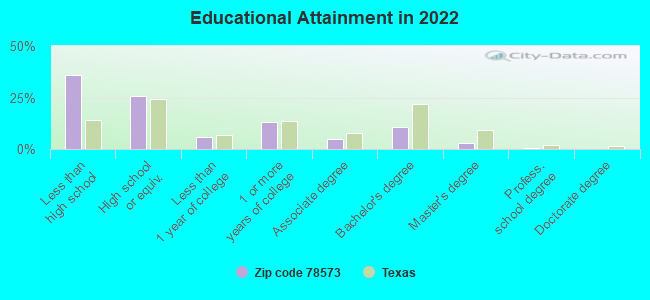
For population 25 years and over in 78573:
High school or higher: 61.9%
Bachelor's degree or higher: 14.0%
Graduate or professional degree: 3.5%
Unemployed: 8.7%
Mean travel time to work (commute): 26.4 minutes
For population 15 years and over in 78573:
Never married: 35.4%
Now married: 50.8%
Separated: 2.6%
Widowed: 3.7%
Divorced: 7.5%
Zip code 78573 compared to state average:
Median household income below state average.
Median house value below state average.
Unemployed percentage above state average.
Black race population percentage significantly below state average.
Hispanic race population percentage above state average.
Median age below state average.
Foreign-born population percentage above state average.
Length of stay since moving in significantly above state average.
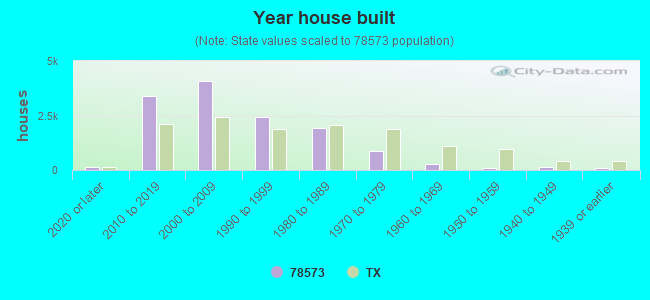
House age below state average.
Percentage of population with a bachelor's degree or higher significantly below state average.
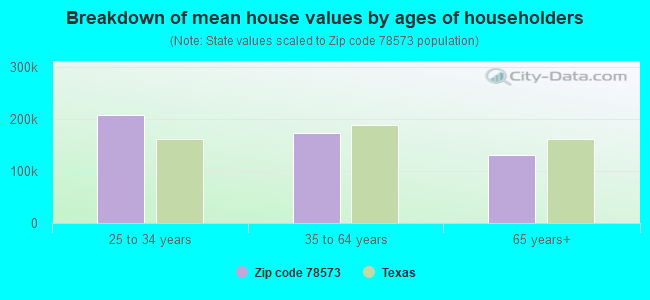
Estimated median house/condo value in 2022: $151,354
78573:
$151,354
Texas:
$275,400
According to our research of Texas and other state lists, there were 72 registered sex offenders living in 78573 zip code as of May 20, 2024. The ratio of all residents to sex offenders in zip code 78573 is 534 to 1. The ratio of registered sex offenders to all residents in this zip code is near the state average.
Median resident age:
This zip code:
28.0 years
Texas median age:
35.6 years
Average household size:
This zip code:
3.6 people
Texas:
2.6 people
Averages for the 2020 tax year for zip code 78573, filed in 2021:
Average Adjusted Gross Income (AGI) in 2020: $43,689 (Individual Income Tax Returns)
Here:
$43,689
State:
$77,054
Salary/wage: $37,952 (reported on 84.2% of returns)
Here:
$37,952
State:
$62,766
(% of AGI for various income ranges: 1226.6% for AGIs below $25k, 3467.3% for AGIs $25k-50k, 6517.9% for AGIs $50k-75k, 9813.9% for AGIs $75k-100k, 17130.5% for AGIs $100k-200k, 82435.0% for AGIs over 200k)
Taxable interest for individuals: $3,518 (reported on 9.0% of returns)
This zip code:
$3,518
Texas:
$2,665
(% of AGI for various income ranges: 2.8% for AGIs below $25k, 6.1% for AGIs $25k-50k, 16.3% for AGIs $50k-75k, 40.8% for AGIs $75k-100k, 129.0% for AGIs $100k-200k, 4737.5% for AGIs over 200k)
Ordinary dividends: $10,704 (reported on 3.2% of returns)
Here:
$10,704
State:
$10,044
(% of AGI for various income ranges: 1.7% for AGIs below $25k, 1.7% for AGIs $25k-50k, 7.6% for AGIs $50k-75k, 20.6% for AGIs $75k-100k, 113.4% for AGIs $100k-200k, 5987.5% for AGIs over 200k)
Net capital gain/loss in AGI: +$16,276 (reported on 4.4% of returns)
Here:
+$16,276
State:
+$39,590
(% of AGI for various income ranges: 2.2% for AGIs below $25k, 17.7% for AGIs $25k-50k, 26.5% for AGIs $50k-75k, 73.3% for AGIs $75k-100k, 494.0% for AGIs $100k-200k, 9713.8% for AGIs over 200k)
Profit/loss from business: +$8,131 (reported on 27.5% of returns)
Here:
+$8,131
State:
+$10,888
(% of AGI for various income ranges: 227.4% for AGIs below $25k, 76.2% for AGIs $25k-50k, 41.2% for AGIs $50k-75k, 201.1% for AGIs $75k-100k, 549.8% for AGIs $100k-200k, 18726.2% for AGIs over 200k)
Taxable individual retirement arrangement distribution: $15,253 (reported on 1.9% of returns)
78573:
$15,253
Texas:
$24,740
(% of AGI for various income ranges: 6.4% for AGIs below $25k, 20.2% for AGIs $25k-50k, 52.7% for AGIs $50k-75k, 83.8% for AGIs $75k-100k, 236.0% for AGIs $100k-200k, 1136.2% for AGIs over 200k)
Total itemized deductions: $34,887 (reported on 3.5% of returns)
Here:
$34,887
State:
$40,428
(% of AGI for various income ranges: 15.0% for AGIs below $25k, 76.7% for AGIs $25k-50k, 263.0% for AGIs $50k-75k, 460.6% for AGIs $75k-100k, 703.3% for AGIs $100k-200k, 7071.3% for AGIs over 200k)
Charity contributions: $10,620 (reported on 2.7% of returns)
Here:
$10,620
State:
$18,201
(% of AGI for various income ranges: 1.2% for AGIs below $25k, 9.9% for AGIs $25k-50k, 44.9% for AGIs $50k-75k, 96.6% for AGIs $75k-100k, 167.9% for AGIs $100k-200k, 2622.5% for AGIs over 200k)
Taxes paid: $8,059 (reported on 3.4% of returns)
78573:
$8,059
State:
$7,821
(% of AGI for various income ranges: 2.8% for AGIs below $25k, 15.9% for AGIs $25k-50k, 69.6% for AGIs $50k-75k, 118.4% for AGIs $75k-100k, 181.2% for AGIs $100k-200k, 1170.0% for AGIs over 200k)
Earned income credit: $3,099 (reported on 38.2% of returns)
Here:
$3,099
State:
$2,584
(% of AGI for various income ranges: 217.6% for AGIs below $25k, 142.1% for AGIs $25k-50k, 3.2% for AGIs $50k-75k)
Percentage of individuals using paid preparers for their 2020 taxes: 90.5%
Here:
90%
State:
92%
(% for various income ranges: 88.8% for AGIs below $25k, 92.2% for AGIs $25k-50k, 93.1% for AGIs $50k-75k, 91.9% for AGIs $75k-100k, 91.3% for AGIs $100k-200k, 88.9% for AGIs over 200k)
Averages for the 2012 tax year for zip code 78573, filed in 2013:
Average Adjusted Gross Income (AGI) in 2012: $36,486 (Individual Income Tax Returns)
Here:
$36,486
State:
$65,384
Salary/wage: $31,625 (reported on 85.6% of returns)
Here:
$31,625
State:
$52,524
(% of AGI for various income ranges: 76.1% for AGIs below $25k, 89.3% for AGIs $25k-50k, 88.1% for AGIs $50k-75k, 86.5% for AGIs $75k-100k, 78.9% for AGIs $100k-200k, 39.0% for AGIs over 200k)
Taxable interest for individuals: $3,444 (reported on 8.7% of returns)
This zip code:
$3,444
Texas:
$2,372
(% of AGI for various income ranges: 0.3% for AGIs below $25k, 0.1% for AGIs $25k-50k, 0.5% for AGIs $50k-75k, 0.5% for AGIs $75k-100k, 1.0% for AGIs $100k-200k, 2.3% for AGIs over 200k)
Ordinary dividends: $10,395 (reported on 3.1% of returns)
Here:
$10,395
State:
$9,721
(% of AGI for various income ranges: 0.1% for AGIs below $25k, 0.2% for AGIs $25k-50k, 0.2% for AGIs $75k-100k, 0.5% for AGIs $100k-200k, 3.4% for AGIs over 200k)
Net capital gain/loss in AGI: +$24,638 (reported on 2.7% of returns)
Here:
+$24,638
State:
+$35,319
(% of AGI for various income ranges: 0.1% for AGIs below $25k, 0.1% for AGIs $25k-50k, 0.3% for AGIs $50k-75k, 1.5% for AGIs $100k-200k, 7.4% for AGIs over 200k)
Profit/loss from business: +$9,801 (reported on 28.0% of returns)
Here:
+$9,801
State:
+$13,732
(% of AGI for various income ranges: 19.3% for AGIs below $25k, 3.3% for AGIs $25k-50k, 1.8% for AGIs $50k-75k, 2.5% for AGIs $75k-100k, 5.2% for AGIs $100k-200k, 6.6% for AGIs over 200k)
Taxable individual retirement arrangement distribution: $11,573 (reported on 1.9% of returns)
78573:
$11,573
Texas:
$19,511
(% of AGI for various income ranges: 0.3% for AGIs below $25k, 0.5% for AGIs $25k-50k, 0.7% for AGIs $50k-75k, 1.0% for AGIs $75k-100k, 1.8% for AGIs $100k-200k)
Total itemized deductions: $22,522 (21% of AGI, reported on 15.7% of returns)
Here:
$22,522
State:
$24,724
Here:
21.4% of AGI
State:
15.9% of AGI
(% of AGI for various income ranges: 2.6% for AGIs below $25k, 10.6% for AGIs $25k-50k, 16.5% for AGIs $50k-75k, 14.8% for AGIs $75k-100k, 13.4% for AGIs $100k-200k, 7.3% for AGIs over 200k)
Charity contributions: $3,601 (reported on 9.8% of returns)
Here:
$3,601
State:
$6,808
(% of AGI for various income ranges: 0.1% for AGIs below $25k, 0.7% for AGIs $25k-50k, 0.9% for AGIs $50k-75k, 1.1% for AGIs $75k-100k, 1.8% for AGIs $100k-200k, 1.6% for AGIs over 200k)
Taxes paid: $5,339 (reported on 14.6% of returns)
78573:
$5,339
State:
$6,921
(% of AGI for various income ranges: 0.5% for AGIs below $25k, 1.7% for AGIs $25k-50k, 2.9% for AGIs $50k-75k, 3.1% for AGIs $75k-100k, 3.8% for AGIs $100k-200k, 2.4% for AGIs over 200k)
Earned income credit: $3,203 (reported on 48.9% of returns)
Here:
$3,203
State:
$2,570
(% of AGI for various income ranges: 16.2% for AGIs below $25k, 3.1% for AGIs $25k-50k)
Percentage of individuals using paid preparers for their 2012 taxes: 69.7%
Here:
70%
State:
51%
(% for various income ranges: 69.6% for AGIs below $25k, 68.2% for AGIs $25k-50k, 71.0% for AGIs $50k-75k, 67.9% for AGIs $75k-100k, 73.5% for AGIs $100k-200k, 88.9% for AGIs over 200k)
Averages for the 2004 tax year for zip code 78573, filed in 2005:
Average Adjusted Gross Income (AGI) in 2004: $32,053 (Individual Income Tax Returns)
Here:
$32,053
State:
$47,881
Salary/wage: $27,611 (reported on 82.7% of returns)
Here:
$27,611
State:
$41,947
(% of AGI for various income ranges: 105.5% for AGIs below $10k, 79.0% for AGIs $10k-25k, 85.2% for AGIs $25k-50k, 77.5% for AGIs $50k-75k, 77.0% for AGIs $75k-100k, 51.0% for AGIs over 100k)
Taxable interest for individuals: $2,810 (reported on 18.6% of returns)
This zip code:
$2,810
Texas:
$2,255
(% of AGI for various income ranges: 2.2% for AGIs below $10k, 0.8% for AGIs $10k-25k, 0.6% for AGIs $25k-50k, 1.1% for AGIs $50k-75k, 0.7% for AGIs $75k-100k, 3.1% for AGIs over 100k)
Taxable dividends: $2,913 (reported on 5.6% of returns)
Here:
$2,913
State:
$4,261
(% of AGI for various income ranges: 1.1% for AGIs below $10k, 0.2% for AGIs $10k-25k, 0.3% for AGIs $25k-50k, 0.1% for AGIs $50k-75k, 0.0% for AGIs $75k-100k, 1.0% for AGIs over 100k)
Net capital gain/loss: +$13,760 (reported on 5.2% of returns)
Here:
+$13,760
State:
+$16,110
(% of AGI for various income ranges: -0.9% for AGIs below $10k, 0.1% for AGIs $10k-25k, 0.5% for AGIs $25k-50k, 0.3% for AGIs $50k-75k, 1.7% for AGIs $75k-100k, 5.7% for AGIs over 100k)
Profit/loss from business: +$10,404 (reported on 27.3% of returns)
Here:
+$10,404
State:
+$11,013
(% of AGI for various income ranges: 25.5% for AGIs below $10k, 13.7% for AGIs $10k-25k, 4.9% for AGIs $25k-50k, 8.2% for AGIs $50k-75k, -1.1% for AGIs $75k-100k, 9.1% for AGIs over 100k)
IRA payment deduction: $3,261 (reported on 0.9% of returns)
78573:
$3,261
Texas:
$3,120
Total itemized deductions: $19,814 (22% of AGI, reported on 14.3% of returns)
Here:
$19,814
State:
$19,631
Here:
22.0% of AGI
State:
18.9% of AGI
(% of AGI for various income ranges: 3.7% for AGIs $10k-25k, 11.8% for AGIs $25k-50k, 13.9% for AGIs $50k-75k, 16.3% for AGIs $75k-100k, 7.6% for AGIs over 100k)
Charity contributions deductions: $4,416 (4% of AGI, reported on 10.6% of returns)
Here:
$4,416
State:
$4,753
Here:
4.4% of AGI
State:
4.2% of AGI
(% of AGI for various income ranges: 0.3% for AGIs $10k-25k, 1.0% for AGIs $25k-50k, 1.9% for AGIs $50k-75k, 3.1% for AGIs $75k-100k, 2.1% for AGIs over 100k)
Total tax: $6,657 (reported on 59.6% of returns)
78573:
$6,657
State:
$9,058
(% of AGI for various income ranges: 7.5% for AGIs below $10k, 3.7% for AGIs $10k-25k, 5.1% for AGIs $25k-50k, 8.3% for AGIs $50k-75k, 10.8% for AGIs $75k-100k, 24.4% for AGIs over 100k)
Earned income credit: $2,502 (reported on 45.8% of returns)
Here:
$2,502
State:
$2,024
Percentage of individuals using paid preparers for their 2004 taxes: 74.5%
Here:
74%
State:
57%
(% for various income ranges: 72.3% for AGIs below $10k, 75.4% for AGIs $10k-25k, 72.5% for AGIs $25k-50k, 69.6% for AGIs $50k-75k, 83.6% for AGIs $75k-100k, 90.2% for AGIs over 100k)
Household received Food Stamps/SNAP in the past 12 months: 4,355 Household did not receive Food Stamps/SNAP in the past 12 months: 8,242
Women who had a birth in the past 12 months: 770 (395 now married, 367 unmarried) Women who did not have a birth in the past 12 months: 11,039 (4,797 now married, 6,244 unmarried)
Housing units in zip code 78573 with a mortgage: 3,519 (113 second mortgage, 85 both second mortgage and home equity loan) Houses without a mortgage: 39
Median monthly owner costs for units with a mortgage: $1,466 Median monthly owner costs for units without a mortgage: $455
Residents with income below the poverty level in 2022:
This zip code:
24.5%
Whole state:
14.0%
Residents with income below 50% of the poverty level in 2022:
This zip code:
14.3%
Whole state:
7.4%
Median number of rooms in houses and condos:
Here:
5.3
State:
6.3
Median number of rooms in apartments:
Here:
3.9
State:
4.0
Notable locations in this zip code not listed on our city pages
Notable locations in zip code 78573: Alton Volunteer Fire Department (A), Alton Police Department (B), Palmhurst Police Department (C), Mission Fire Department Station 4 (D). Display/hide their locations on the map
8,118 married couples with children.
3,833 single-parent households (409 men, 3,424 women).
12.6% of residents of 78573 zip code speak English at home.
86.9% of residents speak Spanish at home (62% very well, 13% well, 11% not well, 14% not at all).
0.1% of residents speak other Indo-European language at home (100% very well).
0.1% of residents speak Asian or Pacific Island language at home (59% very well, 41% not well).
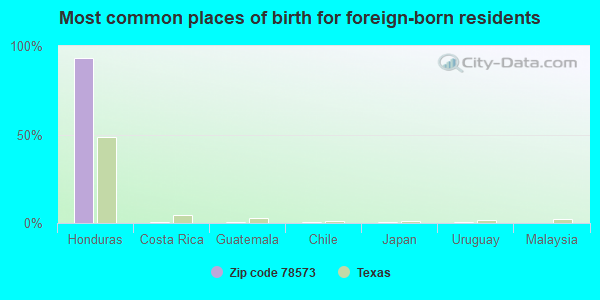
Foreign born population: 13,186 (29.5%) (26.3% of them are naturalized citizens)
This zip code:
29.5%
Whole state:
17.2%
93%Honduras
0%Costa Rica
0%Guatemala
0%Chile
0%Japan
0%Uruguay
0%Malaysia
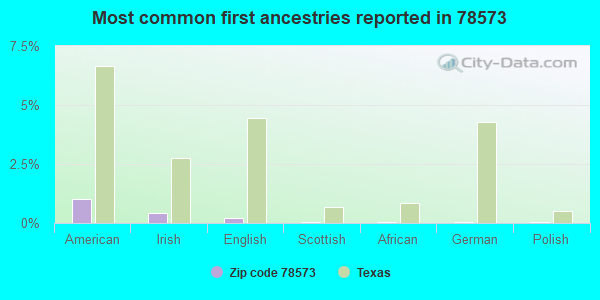
1%American
0%Irish
0%English
0%Scottish
0%African
0%German
0%Polish
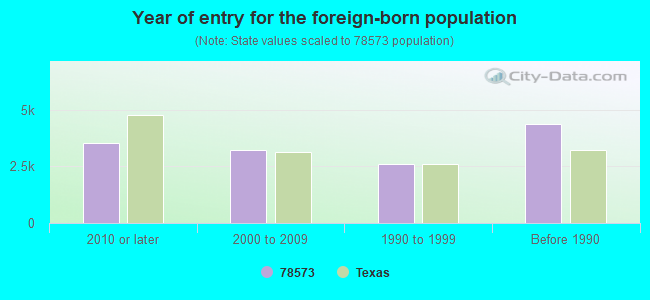
Year of entry for the foreign-born population
3,5572010 or later
3,2182000 to 2009
2,6191990 to 1999
4,375Before 1990
Housing units lacking complete plumbing facilities: 1.4% Housing units lacking complete kitchen facilities: 2.6%
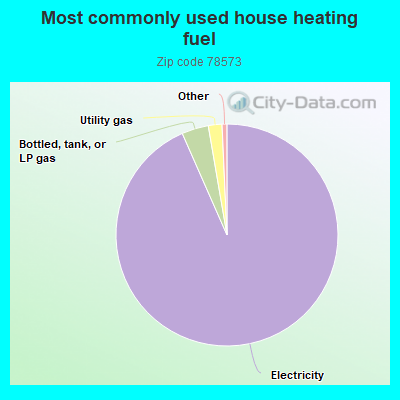
93.4%Electricity
3.9%Bottled, tank, or LP gas
2.0%Utility gas
Place of birth for U.S.-born residents:
This state: 27,251
Northeast: 108
Midwest: 1,496
South: 723
West: 911
93% of the 78573 zip code residents lived in the same house 1 year ago. Out of people who lived in different houses, 55% moved from this county. Out of people who lived in different houses, 19% moved from different county within same state. Out of people who lived in different houses, 5% moved from different state. Out of people who lived in different houses, 24% moved from abroad.
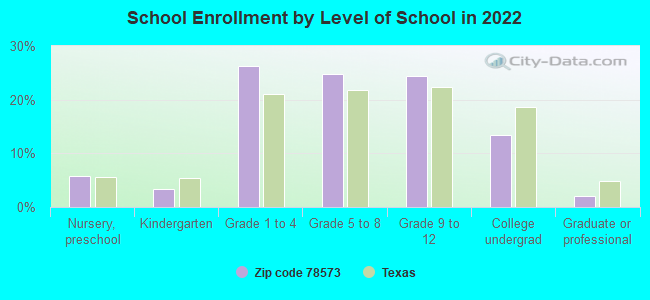
Private vs. public school enrollment:
Students in private schools in grades 1 to 8 (elementary and middle school): 36
Here:
0.5%
Texas:
8.8%
Students in private schools in grades 9 to 12 (high school): 80
Here:
2.3%
Texas:
8.0%
Students in private undergraduate colleges: 168
Here:
8.8%
Texas:
16.2%
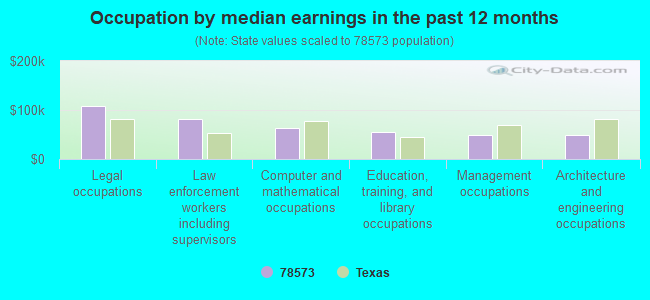
Occupation by median earnings in the past 12 months ($)
108,963Legal occupations
81,547Law enforcement workers including supervisors
62,574Computer and mathematical occupations
54,380Education, training, and library occupations
49,960Management occupations
49,958Architecture and engineering occupations
Companies with federal contracts located in this zip code:
LEALCO INCORPORATED (21/2 MILES WEST OF MISSION EXP 83 in MISSION, TX; small business) 35 employees, $1500000 revenue. Minority Owned Business
$5,413 with Animal and Plant Health Inspection Service for Miscellaneous Items. Signed on 2004-09-29. Completion date: 2005-03-30.
Top industries in this zip code by the number of employees in 2005:
Mining: Support Activities for Oil and Gas Operations (50-99 employees: 1 establishment, 10-19 employees: 1 establishment)
Other Services (except Public Administration): Religious Organizations (20-49: 1, 5-9: 2, 1-4: 4)
Construction: Industrial Building Construction (20-49: 1, 1-4: 1)
Health Care and Social Assistance: Child Day Care Services (10-19: 1, 5-9: 1, 1-4: 3)
Health Care and Social Assistance: Offices of Physicians (except Mental Health Specialists) (5-9: 4)
Fatal accident statistics in 2014:
Fatal accident count: 3
Vehicles involved in fatal accidents: 4
Fatal accidents caused by drunken drivers: 0
Fatalities: 3
Persons involved in fatal accidents: 11
Pedestrians involved in fatal accidents: 0
Fatal accident statistics in 2012:
Fatal accident count: 3
Vehicles involved in fatal accidents: 6
Fatal accidents caused by drunken drivers: 2
Fatalities: 3
Persons involved in fatal accidents: 12
Pedestrians involved in fatal accidents: 0
2003 - 2018 National Fire Incident Reporting System (NFIRS) incidents
According to the data from the years 2003 - 2018 the average number of fire incidents per year is 24. The highest number of fire incidents - 148 took place in 2008, and the least - 2 in 2003. The data has a rising trend.
When looking into fire subcategories, the most incidents belonged to: Outside Fires (85.8%), and Structure Fires (9.2%).
Fire incident types reported to NFIRS in Zip Code 78573


 According to the data from the years 2003 - 2018 the average number of fire incidents per year is 24. The highest number of fire incidents - 148 took place in 2008, and the least - 2 in 2003. The data has a rising trend.
 When looking into fire subcategories, the most incidents belonged to: Outside Fires (85.8%), and Structure Fires (9.2%).