Estimated zip code population in 2022: 6,555 Zip code population in 2010: 6,623 Zip code population in 2000: 5,034
Houses and condos: 3,072 Renter-occupied apartments: 379
% of renters here:
17%
State:
38%
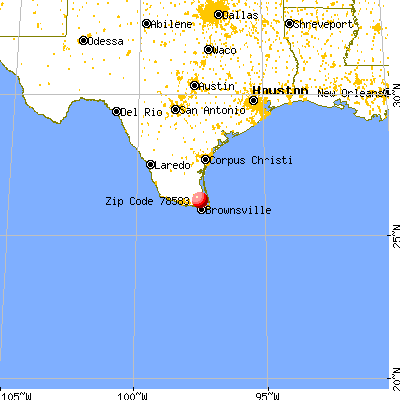
March 2022 cost of living index in zip code 78583: 78.7 (low, U.S. average is 100)
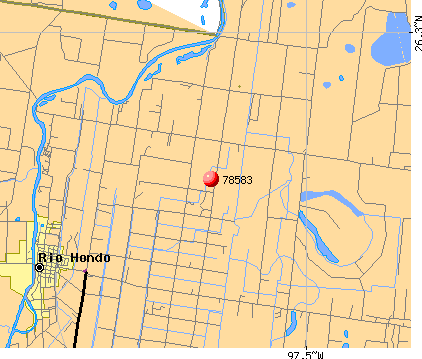
Land area: 88.3 sq. mi. Water area: 5.1 sq. mi.
Population density: 74 people per square mile
(very low).
OSM Map
General Map
Google Map
MSN Map
OSM Map
General Map
Google Map
MSN Map
OSM Map
General Map
Google Map
MSN Map
OSM Map
General Map
Google Map
MSN Map
Please wait while loading the map...
Real estate property taxes paid for housing units in 2022:
This zip code:
1.1% ($1,640)
Texas:
1.5% ($4,050)
Median real estate property taxes paid for housing units with mortgages in 2022: $1,868 (1.1%) Median real estate property taxes paid for housing units with no mortgage in 2022: $1,539 (1.2%)
Averages for the 2020 tax year for zip code 78583, filed in 2021:
Average Adjusted Gross Income (AGI) in 2020: $43,399 (Individual Income Tax Returns)
Here:
$43,399
State:
$77,054
Salary/wage: $38,526 (reported on 83.2% of returns)
Here:
$38,526
State:
$62,766
(% of AGI for various income ranges: 1266.4% for AGIs below $25k, 3478.6% for AGIs $25k-50k, 6538.2% for AGIs $50k-75k, 9812.0% for AGIs $75k-100k, 15102.3% for AGIs $100k-200k)
Taxable interest for individuals: $2,081 (reported on 11.6% of returns)
This zip code:
$2,081
Texas:
$2,665
(% of AGI for various income ranges: 15.6% for AGIs below $25k, 12.9% for AGIs $25k-50k, 7.7% for AGIs $50k-75k, 36.0% for AGIs $75k-100k, 93.8% for AGIs $100k-200k)
Ordinary dividends: $3,391 (reported on 4.1% of returns)
Here:
$3,391
State:
$10,044
(% of AGI for various income ranges: 5.8% for AGIs below $25k, 27.3% for AGIs $50k-75k, 197.7% for AGIs $100k-200k)
Net capital gain/loss in AGI: +$20,527 (reported on 5.6% of returns)
Here:
+$20,527
State:
+$39,590
(% of AGI for various income ranges: 0.8% for AGIs below $25k, 13.8% for AGIs $25k-50k, 61.8% for AGIs $50k-75k, 2187.7% for AGIs $100k-200k)
Profit/loss from business: +$7,011 (reported on 17.2% of returns)
Here:
+$7,011
State:
+$10,888
(% of AGI for various income ranges: 136.2% for AGIs below $25k, 84.4% for AGIs $25k-50k, 70.9% for AGIs $50k-75k, 164.0% for AGIs $75k-100k, 790.0% for AGIs $100k-200k)
Taxable individual retirement arrangement distribution: $19,309 (reported on 4.1% of returns)
78583:
$19,309
Texas:
$24,740
(% of AGI for various income ranges: 14.3% for AGIs below $25k, 33.8% for AGIs $25k-50k, 280.9% for AGIs $50k-75k, 880.0% for AGIs $100k-200k)
Total itemized deductions: $35,229 (reported on 2.6% of returns)
Here:
$35,229
State:
$40,428
(% of AGI for various income ranges: 241.5% for AGIs $25k-50k, 670.8% for AGIs $100k-200k)
Charity contributions: $11,050 (reported on 1.5% of returns)
Here:
$11,050
State:
$18,201
(% of AGI for various income ranges: 11.4% for AGIs $25k-50k, 367.0% for AGIs $75k-100k)
Taxes paid: $6,600 (reported on 1.9% of returns)
78583:
$6,600
State:
$7,821
(% of AGI for various income ranges: 26.1% for AGIs $25k-50k, 121.5% for AGIs $100k-200k)
Earned income credit: $2,802 (reported on 32.5% of returns)
Here:
$2,802
State:
$2,584
(% of AGI for various income ranges: 173.3% for AGIs below $25k, 114.7% for AGIs $25k-50k)
Percentage of individuals using paid preparers for their 2020 taxes: 90.7%
Here:
91%
State:
92%
(% for various income ranges: 90.0% for AGIs below $25k, 92.4% for AGIs $25k-50k, 89.7% for AGIs $50k-75k, 93.3% for AGIs $75k-100k, 90.5% for AGIs $100k-200k, 75.0% for AGIs over 200k)
Averages for the 2012 tax year for zip code 78583, filed in 2013:
Average Adjusted Gross Income (AGI) in 2012: $36,027 (Individual Income Tax Returns)
Here:
$36,027
State:
$65,384
Salary/wage: $33,257 (reported on 84.9% of returns)
Here:
$33,257
State:
$52,524
(% of AGI for various income ranges: 80.0% for AGIs below $25k, 85.1% for AGIs $25k-50k, 76.9% for AGIs $50k-75k, 78.3% for AGIs $75k-100k, 71.4% for AGIs $100k-200k)
Taxable interest for individuals: $1,280 (reported on 14.6% of returns)
This zip code:
$1,280
Texas:
$2,372
(% of AGI for various income ranges: 0.7% for AGIs below $25k, 0.3% for AGIs $25k-50k, 0.5% for AGIs $50k-75k, 0.9% for AGIs $100k-200k)
Ordinary dividends: $2,723 (reported on 5.4% of returns)
Here:
$2,723
State:
$9,721
(% of AGI for various income ranges: 0.4% for AGIs below $25k, 0.5% for AGIs $25k-50k, 0.7% for AGIs $50k-75k, 0.3% for AGIs $100k-200k)
Net capital gain/loss in AGI: +$3,170 (reported on 4.2% of returns)
Here:
+$3,170
State:
+$35,319
(% of AGI for various income ranges: 1.0% for AGIs $50k-75k, 0.6% for AGIs $100k-200k)
Profit/loss from business: +$5,590 (reported on 17.6% of returns)
Here:
+$5,590
State:
+$13,732
(% of AGI for various income ranges: 9.5% for AGIs below $25k, 2.0% for AGIs $25k-50k, 1.1% for AGIs $50k-75k, 0.6% for AGIs $100k-200k)
Taxable individual retirement arrangement distribution: $12,150 (reported on 5.0% of returns)
78583:
$12,150
Texas:
$19,511
(% of AGI for various income ranges: 1.1% for AGIs below $25k, 1.0% for AGIs $25k-50k, 2.8% for AGIs $50k-75k, 6.0% for AGIs $75k-100k)
Total itemized deductions: $18,497 (23% of AGI, reported on 13.0% of returns)
Here:
$18,497
State:
$24,724
Here:
23.1% of AGI
State:
15.9% of AGI
(% of AGI for various income ranges: 2.9% for AGIs below $25k, 5.8% for AGIs $25k-50k, 8.7% for AGIs $50k-75k, 9.1% for AGIs $75k-100k, 7.9% for AGIs $100k-200k)
Charity contributions: $3,622 (reported on 9.6% of returns)
Here:
$3,622
State:
$6,808
(% of AGI for various income ranges: 0.2% for AGIs below $25k, 0.6% for AGIs $25k-50k, 1.1% for AGIs $50k-75k, 1.6% for AGIs $75k-100k, 1.5% for AGIs $100k-200k)
Taxes paid: $4,004 (reported on 11.7% of returns)
78583:
$4,004
State:
$6,921
(% of AGI for various income ranges: 0.3% for AGIs below $25k, 0.9% for AGIs $25k-50k, 1.6% for AGIs $50k-75k, 1.9% for AGIs $75k-100k, 2.0% for AGIs $100k-200k)
Earned income credit: $2,802 (reported on 38.5% of returns)
Here:
$2,802
State:
$2,570
(% of AGI for various income ranges: 12.0% for AGIs below $25k, 2.5% for AGIs $25k-50k)
Percentage of individuals using paid preparers for their 2012 taxes: 59.8%
Here:
60%
State:
51%
(% for various income ranges: 59.5% for AGIs below $25k, 60.7% for AGIs $25k-50k, 55.6% for AGIs $50k-75k, 58.3% for AGIs $75k-100k, 69.2% for AGIs $100k-200k)
Averages for the 2004 tax year for zip code 78583, filed in 2005:
Average Adjusted Gross Income (AGI) in 2004: $26,749 (Individual Income Tax Returns)
Here:
$26,749
State:
$47,881
Salary/wage: $25,751 (reported on 87.7% of returns)
Here:
$25,751
State:
$41,947
(% of AGI for various income ranges: 134.3% for AGIs below $10k, 85.5% for AGIs $10k-25k, 85.9% for AGIs $25k-50k, 86.4% for AGIs $50k-75k, 81.1% for AGIs $75k-100k, 67.6% for AGIs over 100k)
Taxable interest for individuals: $1,755 (reported on 18.1% of returns)
This zip code:
$1,755
Texas:
$2,255
(% of AGI for various income ranges: 4.4% for AGIs below $10k, 1.0% for AGIs $10k-25k, 1.2% for AGIs $25k-50k, 0.9% for AGIs $50k-75k, 0.3% for AGIs $75k-100k, 1.7% for AGIs over 100k)
Taxable dividends: $1,480 (reported on 6.9% of returns)
Here:
$1,480
State:
$4,261
(% of AGI for various income ranges: 1.3% for AGIs below $10k, 0.2% for AGIs $10k-25k, 0.4% for AGIs $25k-50k, 0.3% for AGIs $50k-75k, 0.1% for AGIs $75k-100k, 0.7% for AGIs over 100k)
Net capital gain/loss: +$8,917 (reported on 6.2% of returns)
Here:
+$8,917
State:
+$16,110
(% of AGI for various income ranges: -0.3% for AGIs below $10k, -0.2% for AGIs $10k-25k, 0.3% for AGIs $25k-50k, 2.2% for AGIs $50k-75k, 2.1% for AGIs $75k-100k, 10.3% for AGIs over 100k)
Profit/loss from business: +$4,211 (reported on 15.5% of returns)
Here:
+$4,211
State:
+$11,013
(% of AGI for various income ranges: 13.1% for AGIs below $10k, 5.6% for AGIs $10k-25k, 1.1% for AGIs $25k-50k, -0.3% for AGIs $50k-75k, 4.2% for AGIs $75k-100k)
IRA payment deduction: $2,962 (reported on 1.2% of returns)
78583:
$2,962
Texas:
$3,120
Total itemized deductions: $15,545 (25% of AGI, reported on 9.3% of returns)
Here:
$15,545
State:
$19,631
Here:
25.3% of AGI
State:
18.9% of AGI
(% of AGI for various income ranges: 2.8% for AGIs $10k-25k, 5.2% for AGIs $25k-50k, 8.0% for AGIs $50k-75k, 6.9% for AGIs $75k-100k, 7.1% for AGIs over 100k)
Charity contributions deductions: $2,586 (4% of AGI, reported on 7.3% of returns)
Here:
$2,586
State:
$4,753
Here:
3.9% of AGI
State:
4.2% of AGI
(% of AGI for various income ranges: 0.3% for AGIs $10k-25k, 0.5% for AGIs $25k-50k, 1.0% for AGIs $50k-75k, 0.8% for AGIs $75k-100k, 1.6% for AGIs over 100k)
Total tax: $3,378 (reported on 55.9% of returns)
78583:
$3,378
State:
$9,058
(% of AGI for various income ranges: 4.2% for AGIs below $10k, 2.6% for AGIs $10k-25k, 5.0% for AGIs $25k-50k, 8.0% for AGIs $50k-75k, 11.5% for AGIs $75k-100k, 15.3% for AGIs over 100k)
Earned income credit: $2,220 (reported on 42.0% of returns)
Here:
$2,220
State:
$2,024
Percentage of individuals using paid preparers for their 2004 taxes: 66.0%
Here:
66%
State:
57%
(% for various income ranges: 60.5% for AGIs below $10k, 70.8% for AGIs $10k-25k, 64.1% for AGIs $25k-50k, 65.4% for AGIs $50k-75k, 64.7% for AGIs $75k-100k, 68.5% for AGIs over 100k)
Household received Food Stamps/SNAP in the past 12 months: 507 Household did not receive Food Stamps/SNAP in the past 12 months: 1,718
Women who did not have a birth in the past 12 months: 1,500 (651 now married, 849 unmarried)
Housing units in zip code 78583 with a mortgage: 851 (91 second mortgage, 47 both second mortgage and home equity loan) Median monthly owner costs for units with a mortgage: $1,248 Median monthly owner costs for units without a mortgage: $491
Residents with income below the poverty level in 2022:
This zip code:
16.7%
Whole state:
14.0%
Residents with income below 50% of the poverty level in 2022:
This zip code:
7.7%
Whole state:
7.4%
Median number of rooms in houses and condos:
Here:
5.2
State:
6.3
Median number of rooms in apartments:
Here:
4.0
State:
4.0
Notable locations in this zip code not listed on our city pages
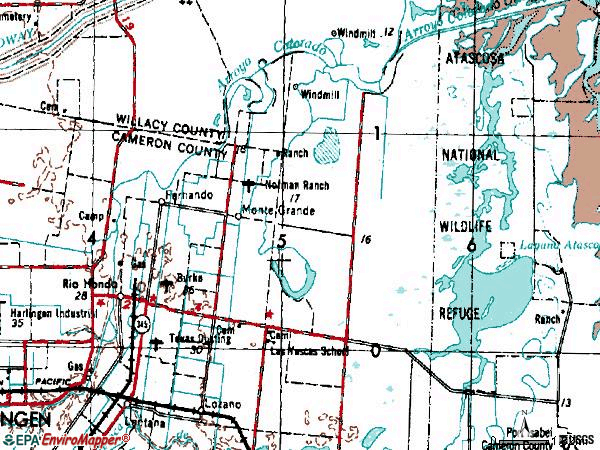
Notable locations in zip code 78583: Seaway Village Marina (A), Arroyo City RV Resort Marina (B), Channel View RV Park Marina (C), El Ranchito (D), La Leona Ranch (E), Los Coyotes Ranch (F), Miradores Ranch (G), Rancho Nuevo (H), Totman Ranch (I), Rio Hondo Fire Department (J), Rio Hondo Police Department (K), Texas Air Museum (L). Display/hide their locations on the map
Reservoirs: Reservoir Number Seven (A), Negro Tank (B), Los Patos Tank (C), Los Angeles Tank (D), Jasper Tank (E), Espuela Tank (F), El Sivolo Pond (G), El Preseno Lake (H). Display/hide their locations on the map
Parks in zip code 78583 include: Las Palomas Wildlife Management Area - Arroyo Colorado Unit (1), Laguna Atascosa National Wildlife Refuge (2). Display/hide their locations on the map
Size of family households: 653 2-persons, 471 3-persons, 339 4-persons, 189 5-persons, 119 6-persons, 3 7-or-more-persons
Size of nonfamily households: 392 1-person, 24 2-persons, 4 3-persons
852 married couples with children.
390 single-parent households (104 men, 286 women).
28.5% of residents of 78583 zip code speak English at home.
71.4% of residents speak Spanish at home (77% very well, 9% well, 7% not well, 7% not at all).
0.1% of residents speak other Indo-European language at home (100% very well).
0.2% of residents speak Asian or Pacific Island language at home (100% well).
Foreign born population: 1,158 (17.7%) (40.1% of them are naturalized citizens)
This zip code:
17.7%
Whole state:
17.2%
93%Honduras
1%Chile
1%Thailand
4%English
2%Italian
2%German
1%American
1%Irish
1%Hungarian
0%European
Year of entry for the foreign-born population
1422010 or later
3922000 to 2009
1231990 to 1999
552Before 1990
Facilities with environmental interests located in this zip code:
ARROYO AQUACULTURE ASSOCIATION INCORPORATED (FM 2925 in RIO HONDO, TX)
National Pollutant Discharge Elimination System NON-MAJOR (Tracking pollutant discharge elimination systems) - permit Business SIC classification: FISH HATCHERIES AND PRESERVES Organizations: ARROYO AQUACULTURE ASSOC. (CONTACT/OWNER)
Alternative names: TAIWAN SHRIMP VILLAGE ASSOC.
ARROYO COLORADO TIDAL (SEGMENT 2201) ( in , TX)
SUPERFUND (Superfund database)
Housing units lacking complete plumbing facilities: 1.9% Housing units lacking complete kitchen facilities: 4.3%
92.2%Electricity
4.4%Utility gas
3.4%Bottled, tank, or LP gas
Population in 1990: 4,990. Population change in the 1990s: +44 (+0.9%).
Place of birth for U.S.-born residents:
This state: 4,511
Northeast: 71
Midwest: 250
South: 376
West: 19
71% of the 78583 zip code residents lived in the same house 5 years ago. Out of people who lived in different houses, 68% lived in this county. Out of people who lived in different counties, 50% lived in Texas.
94% of the 78583 zip code residents lived in the same house 1 year ago. Out of people who lived in different houses, 72% moved from this county. Out of people who lived in different houses, 16% moved from different county within same state. Out of people who lived in different houses, 11% moved from different state.
Private vs. public school enrollment:
Students in private schools in grades 1 to 8 (elementary and middle school):
Here:
0.0%
Texas:
8.8%
Students in private schools in grades 9 to 12 (high school): 7
Here:
2.0%
Texas:
8.0%
Students in private undergraduate colleges:
Here:
0.0%
Texas:
16.2%
Occupation by median earnings in the past 12 months ($)
142,123Management occupations
51,681Installation, maintenance, and repair occupations
50,869Health technologists and technicians
43,770Business and financial operations occupations
42,436Production occupations
42,177Construction and extraction occupations
Top industries in this zip code by the number of employees in 2005:
Utilities: Water Supply and Irrigation Systems (20-49 employees: 1 establishment)
Health Care and Social Assistance: Child Day Care Services (10-19: 1, 5-9: 1)
Wholesale Trade: Petroleum Bulk Stations and Terminals (10-19: 1)
Construction: Power and Communication Line and Related Structures Construction (10-19: 1)
Health Care and Social Assistance: Offices of Physicians (except Mental Health Specialists) (10-19: 1)
Other Services (except Public Administration): Religious Organizations (5-9: 1, 1-4: 2)
Construction: Poured Concrete Foundation and Structure Contractors (5-9: 1, 1-4: 1)
Fatal accident statistics in 2013:
Fatal accident count: 2
Vehicles involved in fatal accidents: 2
Fatal accidents caused by drunken drivers: 2
Fatalities: 2
Persons involved in fatal accidents: 3
Pedestrians involved in fatal accidents: 0
Fatal accident statistics in 2011:
Fatal accident count: 1
Vehicles involved in fatal accidents: 1
Fatal accidents caused by drunken drivers: 1
Fatalities: 1
Persons involved in fatal accidents: 1
Pedestrians involved in fatal accidents: 0
Home Mortgage Disclosure Act Aggregated Statistics For Year 2009 (Based on 8 partial tracts)
A) FHA, FSA/RHS & VA Home Purchase Loans
B) Conventional Home Purchase Loans
C) Refinancings
D) Home Improvement Loans
E) Loans on Dwellings For 5+ Families
F) Non-occupant Loans on < 5 Family Dwellings (A B C & D)
G) Loans On Manufactured Home Dwelling (A B C & D)
Number
Average Value
Number
Average Value
Number
Average Value
Number
Average Value
Number
Average Value
Number
Average Value
Number
Average Value
LOANS ORIGINATED
23
$104,551
23
$123,727
35
$107,397
7
$40,221
1
$274,400
10
$134,511
1
$10,980
APPLICATIONS APPROVED, NOT ACCEPTED
4
$56,412
3
$83,910
10
$73,682
2
$13,690
0
$0
0
$0
4
$41,152
APPLICATIONS DENIED
6
$143,397
14
$111,063
65
$69,844
36
$17,729
1
$1,601,800
10
$103,813
6
$20,828
APPLICATIONS WITHDRAWN
4
$196,648
9
$133,756
25
$89,196
9
$31,341
0
$0
5
$100,178
0
$0
FILES CLOSED FOR INCOMPLETENESS
4
$183,578
1
$50,490
4
$158,810
1
$56,010
0
$0
0
$0
0
$0
Aggregated Statistics For Year 2008 (Based on 8 partial tracts)
A) FHA, FSA/RHS & VA Home Purchase Loans
B) Conventional Home Purchase Loans
C) Refinancings
D) Home Improvement Loans
F) Non-occupant Loans on < 5 Family Dwellings (A B C & D)
G) Loans On Manufactured Home Dwelling (A B C & D)
Number
Average Value
Number
Average Value
Number
Average Value
Number
Average Value
Number
Average Value
Number
Average Value
LOANS ORIGINATED
22
$95,291
30
$107,352
41
$92,916
19
$16,189
15
$110,903
3
$40,983
APPLICATIONS APPROVED, NOT ACCEPTED
5
$80,488
5
$40,822
9
$66,978
2
$68,455
1
$82,320
3
$31,503
APPLICATIONS DENIED
5
$117,438
23
$88,190
82
$89,595
72
$25,505
8
$76,280
9
$37,443
APPLICATIONS WITHDRAWN
2
$97,350
6
$71,238
28
$135,709
6
$29,870
3
$61,797
1
$37,870
FILES CLOSED FOR INCOMPLETENESS
1
$74,640
2
$83,690
7
$124,696
0
$0
1
$255,140
0
$0
Aggregated Statistics For Year 2007 (Based on 8 partial tracts)
A) FHA, FSA/RHS & VA Home Purchase Loans
B) Conventional Home Purchase Loans
C) Refinancings
D) Home Improvement Loans
E) Loans on Dwellings For 5+ Families
F) Non-occupant Loans on < 5 Family Dwellings (A B C & D)
G) Loans On Manufactured Home Dwelling (A B C & D)
Number
Average Value
Number
Average Value
Number
Average Value
Number
Average Value
Number
Average Value
Number
Average Value
Number
Average Value
LOANS ORIGINATED
17
$85,966
65
$102,227
63
$93,935
33
$30,168
3
$517,533
30
$114,407
4
$100,550
APPLICATIONS APPROVED, NOT ACCEPTED
1
$53,780
9
$88,950
25
$92,384
5
$11,910
1
$85,060
1
$24,890
4
$44,765
APPLICATIONS DENIED
4
$67,945
18
$103,296
156
$85,158
59
$23,953
0
$0
18
$80,403
4
$47,918
APPLICATIONS WITHDRAWN
0
$0
7
$91,306
33
$91,045
2
$48,440
0
$0
3
$99,880
0
$0
FILES CLOSED FOR INCOMPLETENESS
0
$0
4
$84,430
4
$68,212
1
$10,980
0
$0
0
$0
0
$0
Aggregated Statistics For Year 2006 (Based on 8 partial tracts)
A) FHA, FSA/RHS & VA Home Purchase Loans
B) Conventional Home Purchase Loans
C) Refinancings
D) Home Improvement Loans
E) Loans on Dwellings For 5+ Families
F) Non-occupant Loans on < 5 Family Dwellings (A B C & D)
G) Loans On Manufactured Home Dwelling (A B C & D)
Number
Average Value
Number
Average Value
Number
Average Value
Number
Average Value
Number
Average Value
Number
Average Value
Number
Average Value
LOANS ORIGINATED
10
$87,669
87
$85,396
81
$86,451
26
$23,667
1
$1,156,870
26
$86,115
4
$32,670
APPLICATIONS APPROVED, NOT ACCEPTED
0
$0
42
$78,927
21
$77,499
7
$22,866
0
$0
10
$103,142
4
$30,805
APPLICATIONS DENIED
2
$66,165
47
$77,510
101
$78,733
65
$26,884
0
$0
9
$75,853
11
$22,347
APPLICATIONS WITHDRAWN
4
$121,622
18
$78,186
55
$78,800
7
$52,807
0
$0
7
$80,547
0
$0
FILES CLOSED FOR INCOMPLETENESS
0
$0
2
$57,875
11
$93,053
2
$28,625
0
$0
0
$0
0
$0
Aggregated Statistics For Year 2005 (Based on 8 partial tracts)
A) FHA, FSA/RHS & VA Home Purchase Loans
B) Conventional Home Purchase Loans
C) Refinancings
D) Home Improvement Loans
E) Loans on Dwellings For 5+ Families
F) Non-occupant Loans on < 5 Family Dwellings (A B C & D)
G) Loans On Manufactured Home Dwelling (A B C & D)
Number
Average Value
Number
Average Value
Number
Average Value
Number
Average Value
Number
Average Value
Number
Average Value
Number
Average Value
LOANS ORIGINATED
19
$82,786
100
$89,142
107
$94,429
21
$29,883
2
$441,110
42
$123,230
11
$49,445
APPLICATIONS APPROVED, NOT ACCEPTED
2
$82,965
33
$69,476
29
$62,169
7
$35,587
1
$477,460
8
$48,375
5
$32,420
APPLICATIONS DENIED
2
$48,020
52
$90,927
127
$75,107
43
$33,375
0
$0
22
$122,161
10
$29,248
APPLICATIONS WITHDRAWN
2
$120,725
19
$115,882
49
$100,157
12
$104,782
0
$0
8
$186,390
1
$34,570
FILES CLOSED FOR INCOMPLETENESS
0
$0
5
$97,438
22
$85,200
0
$0
0
$0
1
$35,120
0
$0
Aggregated Statistics For Year 2004 (Based on 8 partial tracts)
A) FHA, FSA/RHS & VA Home Purchase Loans
B) Conventional Home Purchase Loans
C) Refinancings
D) Home Improvement Loans
E) Loans on Dwellings For 5+ Families
F) Non-occupant Loans on < 5 Family Dwellings (A B C & D)
G) Loans On Manufactured Home Dwelling (A B C & D)
Number
Average Value
Number
Average Value
Number
Average Value
Number
Average Value
Number
Average Value
Number
Average Value
Number
Average Value
LOANS ORIGINATED
15
$83,778
74
$95,442
117
$83,108
16
$38,451
1
$186,590
44
$103,305
7
$70,916
APPLICATIONS APPROVED, NOT ACCEPTED
1
$48,840
23
$61,236
26
$90,005
7
$24,326
0
$0
7
$126,990
4
$32,528
APPLICATIONS DENIED
2
$73,515
43
$89,625
119
$69,925
61
$22,748
0
$0
21
$72,838
17
$46,540
APPLICATIONS WITHDRAWN
4
$95,325
12
$76,665
50
$78,171
8
$38,469
0
$0
3
$91,713
3
$56,550
FILES CLOSED FOR INCOMPLETENESS
0
$0
1
$114,150
14
$87,621
0
$0
0
$0
1
$52,140
0
$0
Aggregated Statistics For Year 2003 (Based on 8 partial tracts)
A) FHA, FSA/RHS & VA Home Purchase Loans
B) Conventional Home Purchase Loans
C) Refinancings
D) Home Improvement Loans
E) Loans on Dwellings For 5+ Families
F) Non-occupant Loans on < 5 Family Dwellings (A B C & D)
Number
Average Value
Number
Average Value
Number
Average Value
Number
Average Value
Number
Average Value
Number
Average Value
LOANS ORIGINATED
26
$79,206
104
$65,201
146
$84,372
16
$31,008
1
$86,160
30
$63,213
APPLICATIONS APPROVED, NOT ACCEPTED
3
$102,077
21
$55,845
30
$79,251
5
$27,460
0
$0
5
$32,640
APPLICATIONS DENIED
5
$82,958
43
$54,013
94
$71,149
37
$13,062
0
$0
13
$59,645
APPLICATIONS WITHDRAWN
1
$86,710
8
$85,879
36
$87,910
2
$11,840
0
$0
2
$141,885
FILES CLOSED FOR INCOMPLETENESS
1
$42,260
4
$75,298
2
$63,110
1
$56,010
0
$0
0
$0
Aggregated Statistics For Year 2002 (Based on 8 partial tracts)
A) FHA, FSA/RHS & VA Home Purchase Loans
B) Conventional Home Purchase Loans
C) Refinancings
D) Home Improvement Loans
E) Loans on Dwellings For 5+ Families
F) Non-occupant Loans on < 5 Family Dwellings (A B C & D)
Number
Average Value
Number
Average Value
Number
Average Value
Number
Average Value
Number
Average Value
Number
Average Value
LOANS ORIGINATED
20
$68,644
71
$74,306
72
$76,701
20
$12,894
3
$510,933
21
$71,677
APPLICATIONS APPROVED, NOT ACCEPTED
3
$96,030
18
$51,003
20
$65,910
3
$45,900
0
$0
2
$64,720
APPLICATIONS DENIED
8
$82,218
33
$56,260
48
$60,995
48
$10,307
0
$0
8
$50,466
APPLICATIONS WITHDRAWN
0
$0
4
$80,608
19
$73,407
1
$99,570
0
$0
4
$69,698
FILES CLOSED FOR INCOMPLETENESS
1
$155,570
5
$48,984
4
$92,325
0
$0
0
$0
1
$14,270
Aggregated Statistics For Year 2001 (Based on 8 partial tracts)
A) FHA, FSA/RHS & VA Home Purchase Loans
B) Conventional Home Purchase Loans
C) Refinancings
D) Home Improvement Loans
F) Non-occupant Loans on < 5 Family Dwellings (A B C & D)
Number
Average Value
Number
Average Value
Number
Average Value
Number
Average Value
Number
Average Value
LOANS ORIGINATED
31
$67,402
75
$63,605
67
$67,930
17
$11,341
22
$76,451
APPLICATIONS APPROVED, NOT ACCEPTED
2
$84,240
17
$52,264
15
$51,401
3
$4,000
2
$56,005
APPLICATIONS DENIED
4
$62,252
29
$32,828
43
$40,417
22
$11,438
4
$11,718
APPLICATIONS WITHDRAWN
4
$78,550
2
$50,215
22
$59,682
2
$19,290
0
$0
FILES CLOSED FOR INCOMPLETENESS
0
$0
0
$0
5
$81,440
1
$6,590
1
$135,660
Aggregated Statistics For Year 2000 (Based on 8 partial tracts)
A) FHA, FSA/RHS & VA Home Purchase Loans
B) Conventional Home Purchase Loans
C) Refinancings
D) Home Improvement Loans
E) Loans on Dwellings For 5+ Families
F) Non-occupant Loans on < 5 Family Dwellings (A B C & D)
Number
Average Value
Number
Average Value
Number
Average Value
Number
Average Value
Number
Average Value
Number
Average Value
LOANS ORIGINATED
40
$62,478
103
$88,664
32
$73,152
13
$14,305
2
$463,735
26
$66,203
APPLICATIONS APPROVED, NOT ACCEPTED
45
$66,897
46
$57,615
18
$58,115
6
$13,670
0
$0
6
$45,635
APPLICATIONS DENIED
7
$47,436
75
$46,181
21
$30,280
25
$7,180
0
$0
7
$27,686
APPLICATIONS WITHDRAWN
2
$74,635
12
$58,374
12
$56,998
1
$2,490
0
$0
1
$51,030
FILES CLOSED FOR INCOMPLETENESS
2
$66,405
1
$180,010
4
$65,855
0
$0
0
$0
1
$19,760
Aggregated Statistics For Year 1999 (Based on 4 partial tracts)
A) FHA, FSA/RHS & VA Home Purchase Loans
B) Conventional Home Purchase Loans
C) Refinancings
D) Home Improvement Loans
E) Loans on Dwellings For 5+ Families
F) Non-occupant Loans on < 5 Family Dwellings (A B C & D)
Detailed PMIC statistics for the following Tracts:0101.00
, 0108.00
2002 - 2018 National Fire Incident Reporting System (NFIRS) incidents
Based on the data from the years 2002 - 2018 the average number of fire incidents per year is 7. The highest number of fire incidents - 27 took place in 2014, and the least - 0 in 2012. The data has a dropping trend.
When looking into fire subcategories, the most incidents belonged to: Outside Fires (55.9%), and Structure Fires (26.8%).
Fire incident types reported to NFIRS in Zip Code 78583


 Nearest zip codes: 78566, 78550, 78586, 78597, 78575, 78535.


 Based on the data from the years 2002 - 2018 the average number of fire incidents per year is 7. The highest number of fire incidents - 27 took place in 2014, and the least - 0 in 2012. The data has a dropping trend.
 When looking into fire subcategories, the most incidents belonged to: Outside Fires (55.9%), and Structure Fires (26.8%).