Estimated zip code population in 2022: 7,663 Zip code population in 2010: 4,952 Zip code population in 2000: 3,558
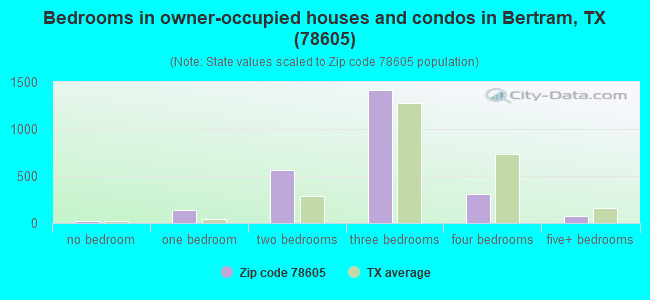
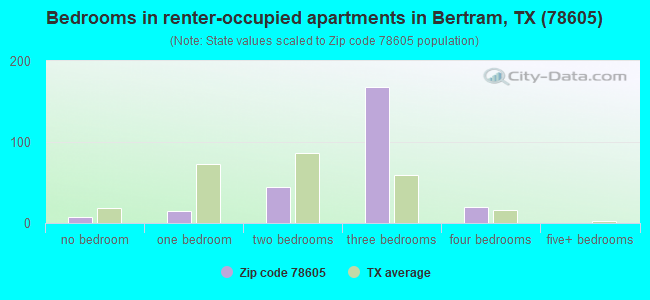
Houses and condos: 2,945 Renter-occupied apartments: 259
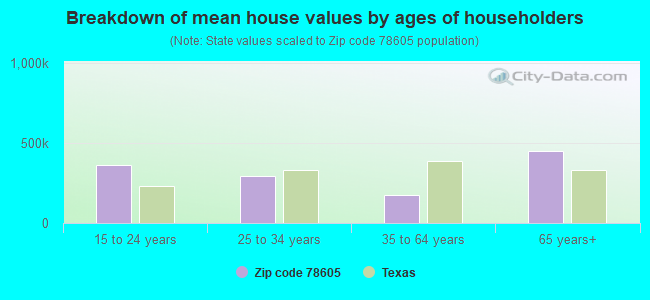
% of renters here:
9%
State:
38%
March 2022 cost of living index in zip code 78605: 79.8 (low, U.S. average is 100)
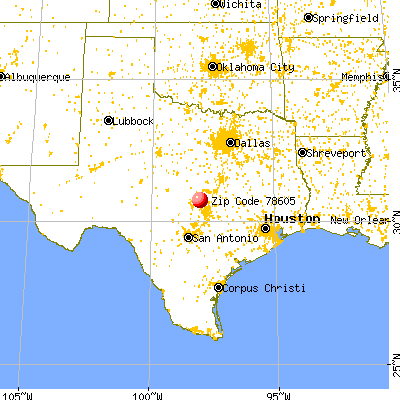
Land area: 163.5 sq. mi. Water area: 0.4 sq. mi.
Population density: 47 people per square mile
(very low).
OSM Map
General Map
Google Map
MSN Map
OSM Map
General Map
Google Map
MSN Map
OSM Map
General Map
Google Map
MSN Map
OSM Map
General Map
Google Map
MSN Map
Please wait while loading the map...
Real estate property taxes paid for housing units in 2022:
This zip code:
0.8% ($1,773)
Texas:
1.5% ($4,050)
Median real estate property taxes paid for housing units with mortgages in 2022: $2,949 (1.0%) Median real estate property taxes paid for housing units with no mortgage in 2022: $1,042 (0.7%)
Averages for the 2020 tax year for zip code 78605, filed in 2021:
Average Adjusted Gross Income (AGI) in 2020: $75,454 (Individual Income Tax Returns)
Here:
$75,454
State:
$77,054
Salary/wage: $61,129 (reported on 80.0% of returns)
Here:
$61,129
State:
$62,766
(% of AGI for various income ranges: 1251.2% for AGIs below $25k, 3698.5% for AGIs $25k-50k, 6568.2% for AGIs $50k-75k, 9333.8% for AGIs $75k-100k, 18679.3% for AGIs $100k-200k, 63555.0% for AGIs over 200k)
Taxable interest for individuals: $1,716 (reported on 26.9% of returns)
This zip code:
$1,716
Texas:
$2,665
(% of AGI for various income ranges: 14.7% for AGIs below $25k, 29.1% for AGIs $25k-50k, 40.6% for AGIs $50k-75k, 72.9% for AGIs $75k-100k, 79.6% for AGIs $100k-200k, 1577.5% for AGIs over 200k)
Ordinary dividends: $5,516 (reported on 14.8% of returns)
Here:
$5,516
State:
$10,044
(% of AGI for various income ranges: 25.8% for AGIs below $25k, 31.3% for AGIs $25k-50k, 60.3% for AGIs $50k-75k, 145.0% for AGIs $75k-100k, 157.9% for AGIs $100k-200k, 2930.0% for AGIs over 200k)
Net capital gain/loss in AGI: +$18,439 (reported on 15.1% of returns)
Here:
+$18,439
State:
+$39,590
(% of AGI for various income ranges: 19.2% for AGIs below $25k, 35.9% for AGIs $25k-50k, 125.2% for AGIs $50k-75k, 101.2% for AGIs $75k-100k, 380.4% for AGIs $100k-200k, 16135.0% for AGIs over 200k)
Profit/loss from business: +$13,793 (reported on 24.3% of returns)
Here:
+$13,793
State:
+$10,888
(% of AGI for various income ranges: 302.9% for AGIs below $25k, 345.0% for AGIs $25k-50k, 444.2% for AGIs $50k-75k, 313.8% for AGIs $75k-100k, 775.0% for AGIs $100k-200k, 5420.0% for AGIs over 200k)
Taxable individual retirement arrangement distribution: $21,709 (reported on 7.2% of returns)
78605:
$21,709
Texas:
$24,740
(% of AGI for various income ranges: 44.7% for AGIs below $25k, 98.9% for AGIs $25k-50k, 241.2% for AGIs $50k-75k, 249.2% for AGIs $75k-100k, 922.9% for AGIs $100k-200k)
Total itemized deductions: $32,090 (reported on 6.6% of returns)
Here:
$32,090
State:
$40,428
(% of AGI for various income ranges: 438.5% for AGIs $50k-75k, 263.3% for AGIs $75k-100k, 664.3% for AGIs $100k-200k, 6197.5% for AGIs over 200k)
Charity contributions: $10,807 (reported on 4.6% of returns)
Here:
$10,807
State:
$18,201
(% of AGI for various income ranges: 82.7% for AGIs $50k-75k, 150.0% for AGIs $100k-200k, 2050.0% for AGIs over 200k)
Taxes paid: $6,600 (reported on 6.6% of returns)
78605:
$6,600
State:
$7,821
(% of AGI for various income ranges: 10.0% for AGIs below $25k, 49.4% for AGIs $50k-75k, 62.9% for AGIs $75k-100k, 155.0% for AGIs $100k-200k, 1282.5% for AGIs over 200k)
Earned income credit: $2,373 (reported on 14.8% of returns)
Here:
$2,373
State:
$2,584
(% of AGI for various income ranges: 111.7% for AGIs below $25k, 75.7% for AGIs $25k-50k)
Percentage of individuals using paid preparers for their 2020 taxes: 91.1%
Here:
91%
State:
92%
(% for various income ranges: 89.8% for AGIs below $25k, 91.5% for AGIs $25k-50k, 91.7% for AGIs $50k-75k, 91.2% for AGIs $75k-100k, 92.0% for AGIs $100k-200k, 92.9% for AGIs over 200k)
Averages for the 2012 tax year for zip code 78605, filed in 2013:
Average Adjusted Gross Income (AGI) in 2012: $56,324 (Individual Income Tax Returns)
Here:
$56,324
State:
$65,384
Salary/wage: $49,141 (reported on 79.8% of returns)
Here:
$49,141
State:
$52,524
(% of AGI for various income ranges: 71.7% for AGIs below $25k, 80.4% for AGIs $25k-50k, 78.7% for AGIs $50k-75k, 69.5% for AGIs $75k-100k, 74.2% for AGIs $100k-200k, 49.2% for AGIs over 200k)
Taxable interest for individuals: $2,444 (reported on 26.8% of returns)
This zip code:
$2,444
Texas:
$2,372
(% of AGI for various income ranges: 0.7% for AGIs below $25k, 0.6% for AGIs $25k-50k, 1.0% for AGIs $50k-75k, 1.0% for AGIs $75k-100k, 0.7% for AGIs $100k-200k, 2.5% for AGIs over 200k)
Ordinary dividends: $7,627 (reported on 14.1% of returns)
Here:
$7,627
State:
$9,721
(% of AGI for various income ranges: 0.9% for AGIs below $25k, 0.6% for AGIs $25k-50k, 0.4% for AGIs $50k-75k, 0.8% for AGIs $75k-100k, 0.8% for AGIs $100k-200k, 6.2% for AGIs over 200k)
Net capital gain/loss in AGI: +$27,700 (reported on 11.7% of returns)
Here:
+$27,700
State:
+$35,319
(% of AGI for various income ranges: 0.3% for AGIs $50k-75k, 1.7% for AGIs $75k-100k, 2.3% for AGIs $100k-200k, 22.6% for AGIs over 200k)
Profit/loss from business: +$11,669 (reported on 23.9% of returns)
Here:
+$11,669
State:
+$13,732
(% of AGI for various income ranges: 17.1% for AGIs below $25k, 6.2% for AGIs $25k-50k, 4.6% for AGIs $50k-75k, 2.3% for AGIs $75k-100k, 6.5% for AGIs $100k-200k)
Taxable individual retirement arrangement distribution: $23,581 (reported on 9.9% of returns)
78605:
$23,581
Texas:
$19,511
(% of AGI for various income ranges: 1.7% for AGIs below $25k, 2.1% for AGIs $25k-50k, 2.1% for AGIs $50k-75k, 6.2% for AGIs $75k-100k, 10.7% for AGIs $100k-200k)
Total itemized deductions: $21,060 (18% of AGI, reported on 22.1% of returns)
Here:
$21,060
State:
$24,724
Here:
17.7% of AGI
State:
15.9% of AGI
(% of AGI for various income ranges: 6.1% for AGIs below $25k, 6.2% for AGIs $25k-50k, 9.4% for AGIs $50k-75k, 11.1% for AGIs $75k-100k, 10.7% for AGIs $100k-200k, 5.5% for AGIs over 200k)
Charity contributions: $5,485 (reported on 15.5% of returns)
Here:
$5,485
State:
$6,808
(% of AGI for various income ranges: 0.3% for AGIs below $25k, 0.8% for AGIs $25k-50k, 0.9% for AGIs $50k-75k, 2.0% for AGIs $75k-100k, 1.8% for AGIs $100k-200k, 2.3% for AGIs over 200k)
Taxes paid: $4,885 (reported on 22.1% of returns)
78605:
$4,885
State:
$6,921
(% of AGI for various income ranges: 1.1% for AGIs below $25k, 1.3% for AGIs $25k-50k, 2.2% for AGIs $50k-75k, 2.6% for AGIs $75k-100k, 2.5% for AGIs $100k-200k, 1.5% for AGIs over 200k)
Earned income credit: $2,249 (reported on 21.1% of returns)
Here:
$2,249
State:
$2,570
(% of AGI for various income ranges: 7.9% for AGIs below $25k, 1.2% for AGIs $25k-50k)
Percentage of individuals using paid preparers for their 2012 taxes: 48.8%
Here:
49%
State:
51%
(% for various income ranges: 48.7% for AGIs below $25k, 44.8% for AGIs $25k-50k, 48.4% for AGIs $50k-75k, 50.0% for AGIs $75k-100k, 55.0% for AGIs $100k-200k, 66.7% for AGIs over 200k)
Averages for the 2004 tax year for zip code 78605, filed in 2005:
Average Adjusted Gross Income (AGI) in 2004: $43,991 (Individual Income Tax Returns)
Here:
$43,991
State:
$47,881
Salary/wage: $38,368 (reported on 81.2% of returns)
Here:
$38,368
State:
$41,947
(% of AGI for various income ranges: 218.5% for AGIs below $10k, 78.1% for AGIs $10k-25k, 81.1% for AGIs $25k-50k, 80.3% for AGIs $50k-75k, 78.2% for AGIs $75k-100k, 49.0% for AGIs over 100k)
Taxable interest for individuals: $1,406 (reported on 32.5% of returns)
This zip code:
$1,406
Texas:
$2,255
(% of AGI for various income ranges: 15.8% for AGIs below $10k, 1.8% for AGIs $10k-25k, 0.7% for AGIs $25k-50k, 0.8% for AGIs $50k-75k, 0.4% for AGIs $75k-100k, 1.1% for AGIs over 100k)
Taxable dividends: $3,137 (reported on 13.2% of returns)
Here:
$3,137
State:
$4,261
(% of AGI for various income ranges: 10.4% for AGIs below $10k, 0.9% for AGIs $10k-25k, 0.3% for AGIs $25k-50k, 0.3% for AGIs $50k-75k, 0.4% for AGIs $75k-100k, 1.8% for AGIs over 100k)
Net capital gain/loss: +$16,683 (reported on 14.4% of returns)
Here:
+$16,683
State:
+$16,110
(% of AGI for various income ranges: 11.6% for AGIs below $10k, 0.2% for AGIs $10k-25k, 0.8% for AGIs $25k-50k, 1.3% for AGIs $50k-75k, 1.9% for AGIs $75k-100k, 14.2% for AGIs over 100k)
Profit/loss from business: +$7,161 (reported on 23.4% of returns)
Here:
+$7,161
State:
+$11,013
(% of AGI for various income ranges: 24.0% for AGIs below $10k, 7.5% for AGIs $10k-25k, 2.9% for AGIs $25k-50k, 2.3% for AGIs $50k-75k, 8.4% for AGIs $75k-100k, 1.7% for AGIs over 100k)
IRA payment deduction: $3,276 (reported on 1.7% of returns)
78605:
$3,276
Texas:
$3,120
Total itemized deductions: $17,065 (18% of AGI, reported on 23.9% of returns)
Here:
$17,065
State:
$19,631
Here:
17.8% of AGI
State:
18.9% of AGI
(% of AGI for various income ranges: 8.2% for AGIs $10k-25k, 8.8% for AGIs $25k-50k, 10.8% for AGIs $50k-75k, 12.0% for AGIs $75k-100k, 8.0% for AGIs over 100k)
Charity contributions deductions: $4,421 (4% of AGI, reported on 16.8% of returns)
Here:
$4,421
State:
$4,753
Here:
4.0% of AGI
State:
4.2% of AGI
(% of AGI for various income ranges: 0.8% for AGIs $10k-25k, 1.1% for AGIs $25k-50k, 1.6% for AGIs $50k-75k, 1.9% for AGIs $75k-100k, 2.4% for AGIs over 100k)
Total tax: $5,897 (reported on 73.4% of returns)
78605:
$5,897
State:
$9,058
(% of AGI for various income ranges: 12.1% for AGIs below $10k, 4.2% for AGIs $10k-25k, 6.3% for AGIs $25k-50k, 8.9% for AGIs $50k-75k, 11.4% for AGIs $75k-100k, 13.8% for AGIs over 100k)
Earned income credit: $1,963 (reported on 19.0% of returns)
Here:
$1,963
State:
$2,024
Percentage of individuals using paid preparers for their 2004 taxes: 56.3%
Here:
56%
State:
57%
(% for various income ranges: 47.7% for AGIs below $10k, 63.6% for AGIs $10k-25k, 57.0% for AGIs $25k-50k, 50.6% for AGIs $50k-75k, 56.3% for AGIs $75k-100k, 66.7% for AGIs over 100k)
Household received Food Stamps/SNAP in the past 12 months: 242 Household did not receive Food Stamps/SNAP in the past 12 months: 2,546
Women who had a birth in the past 12 months: 59 (60 now married, 0 unmarried) Women who did not have a birth in the past 12 months: 1,633 (852 now married, 776 unmarried)
Housing units in zip code 78605 with a mortgage: 1,233 (45 second mortgage, 43 both second mortgage and home equity loan) Median monthly owner costs for units with a mortgage: $1,940 Median monthly owner costs for units without a mortgage: $353
Residents with income below the poverty level in 2022:
This zip code:
7.9%
Whole state:
14.0%
Residents with income below 50% of the poverty level in 2022:
This zip code:
2.1%
Whole state:
7.4%
Median number of rooms in houses and condos:
Here:
5.4
State:
6.3
Median number of rooms in apartments:
Here:
5.2
State:
4.0
Notable locations in this zip code not listed on our city pages
Cemeteries: Fairview Cemetery (1), Bear Creek Cemetery (2), Mahomet Cemetery (3), Mount Zion Cemetery (4), Shady Grove Cemetery (5), Strickling Cemetery (6). Display/hide their locations on the map
Streams, rivers, and creeks: Russell Fork San Gabriel River (A), Robinson Branch (B), Ramsey Nursery Branch (C), Pool Branch (D), Olive Branch (E), Oatmeal Creek (F). Display/hide their locations on the map
764 married couples with children.
494 single-parent households (161 men, 333 women).
78.9% of residents of 78605 zip code speak English at home.
19.6% of residents speak Spanish at home (69% very well, 14% well, 16% not well, 2% not at all).
0.7% of residents speak other Indo-European language at home (100% very well).
0.6% of residents speak Asian or Pacific Island language at home (39% very well, 61% well).
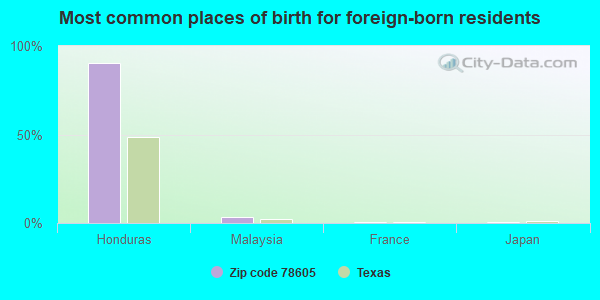
Foreign born population: 890 (11.6%) (20.5% of them are naturalized citizens)
This zip code:
11.6%
Whole state:
17.2%
91%Honduras
3%Malaysia
0%France
0%Japan
0%Denmark
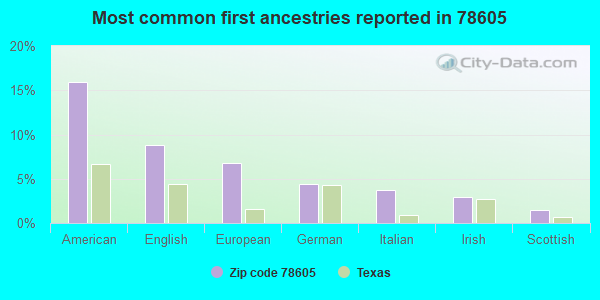
16%American
9%English
7%European
4%German
4%Italian
3%Irish
1%Scottish
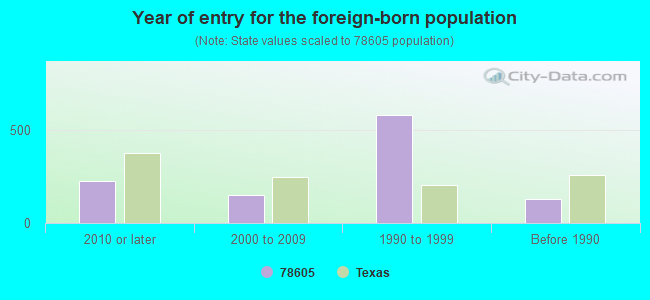
Year of entry for the foreign-born population
2282010 or later
1482000 to 2009
5811990 to 1999
129Before 1990
Housing units lacking complete plumbing facilities: 0.2% Housing units lacking complete kitchen facilities: 1.5%
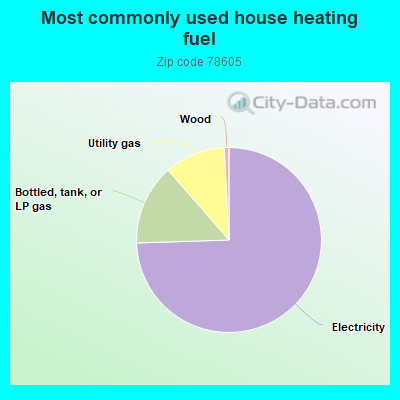
74.5%Electricity
14.1%Bottled, tank, or LP gas
10.6%Utility gas
0.8%Wood
Population in 1990: 1,622. Population change in the 1990s: +1,936 (+119.4%).
Place of birth for U.S.-born residents:
This state: 4,540
Northeast: 207
Midwest: 489
South: 478
West: 849
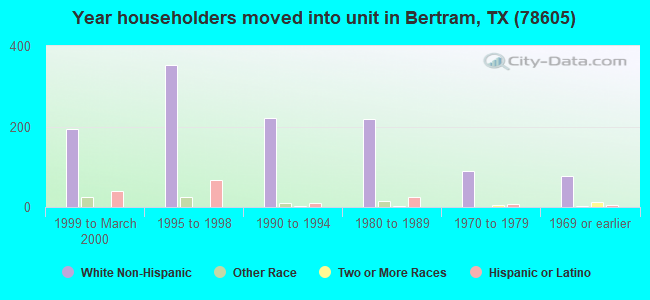
52% of the 78605 zip code residents lived in the same house 5 years ago. Out of people who lived in different houses, 27% lived in this county. Out of people who lived in different counties, 50% lived in Texas.
91% of the 78605 zip code residents lived in the same house 1 year ago. Out of people who lived in different houses, 31% moved from this county. Out of people who lived in different houses, 44% moved from different county within same state. Out of people who lived in different houses, 22% moved from different state. Out of people who lived in different houses, 8% moved from abroad.
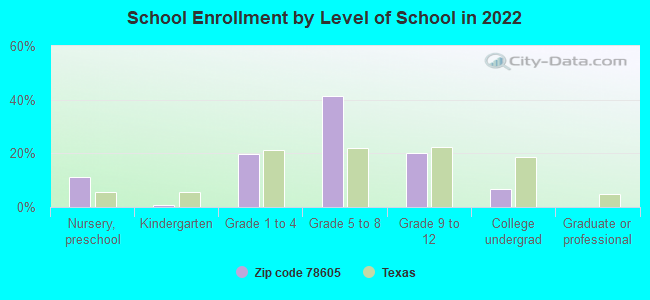
Private vs. public school enrollment:
Students in private schools in grades 1 to 8 (elementary and middle school): 216
Here:
26.7%
Texas:
8.8%
Students in private schools in grades 9 to 12 (high school): 21
Here:
8.2%
Texas:
8.0%
Students in private undergraduate colleges: 4
Here:
5.6%
Texas:
16.2%
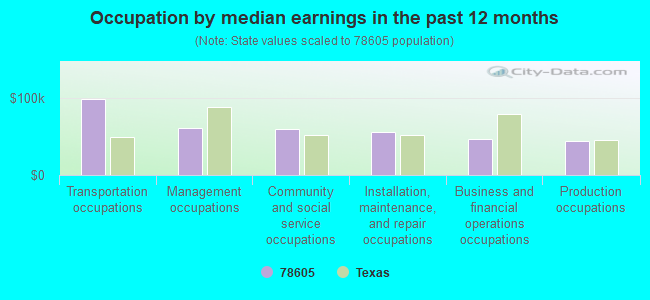
Occupation by median earnings in the past 12 months ($)
98,818Transportation occupations
61,145Management occupations
60,054Community and social service occupations
55,743Installation, maintenance, and repair occupations
47,227Business and financial operations occupations
44,725Production occupations
Companies with federal contracts located in this zip code:
D I J CONSTRUCTION INC (2332 COUNTY RD 252 in BERTRAM, TX; small business)
$28,900 with Air Force for Maintenance, Repair or Alteration of Real Property -- Highways, Roads, Streets, Bridges, and Railways (includes resurfacing). Signed on 2003-11-19. Completion date: 2003-12-15.
BROTZMAN, LE ROY (201 COUNTY ROAD 332 in BERTRAM, TX; small business) : $15,282 in 3 contractsfrom 2004 to 2006
$7,820 with Army for Guard Services. Signed on 2004-03-08. Completion date: 2004-08-16.
$7,544 with Army for Other Housekeeping Services. Signed on 2006-02-10. Completion date: 2006-04-01.
-$82, same as above.Signed on 2006-04-10. Completion date: 2006-09-30.
Top industries in this zip code by the number of employees in 2005:
Construction: New Housing Operative Builders (50-99 employees: 1 establishment)
Health Care and Social Assistance: Nursing Care Facilities (50-99: 1)
Utilities: Electric Power Distribution (50-99: 1)
Construction: Highway, Street, and Bridge Construction (20-49: 1)
Health Care and Social Assistance: Child Day Care Services (10-19: 2, 1-4: 1)
Health Care and Social Assistance: Residential Mental Retardation Facilities (5-9: 3)
Finance and Insurance: Commercial Banking (10-19: 1)
People in group quarters in 2010:
43 people in nursing facilities/skilled-nursing facilities
12 people in group homes intended for adults
4 people in residential treatment centers for adults
People in group quarters in 2000:
63 people in nursing homes
17 people in homes for the mentally retarded
Fatal accident statistics in 2013:
Fatal accident count: 2
Vehicles involved in fatal accidents: 4
Fatal accidents caused by drunken drivers: 1
Fatalities: 2
Persons involved in fatal accidents: 5
Pedestrians involved in fatal accidents: 0
Fatal accident statistics in 2012:
Fatal accident count: 2
Vehicles involved in fatal accidents: 3
Fatal accidents caused by drunken drivers: 1
Fatalities: 3
Persons involved in fatal accidents: 5
Pedestrians involved in fatal accidents: 0
2002 - 2018 National Fire Incident Reporting System (NFIRS) incidents
Based on the data from the years 2002 - 2018 the average number of fire incidents per year is 62. The highest number of reported fires - 124 took place in 2007, and the least - 30 in 2014. The data has a declining trend.
When looking into fire subcategories, the most incidents belonged to: Outside Fires (79.6%), and Structure Fires (13.3%).
Fire incident types reported to NFIRS in Zip Code 78605


 Nearest zip codes: 78642, 78608, 78611, 76527, 78641, 78654.


 Based on the data from the years 2002 - 2018 the average number of fire incidents per year is 62. The highest number of reported fires - 124 took place in 2007, and the least - 30 in 2014. The data has a declining trend.
 When looking into fire subcategories, the most incidents belonged to: Outside Fires (79.6%), and Structure Fires (13.3%).