Estimated zip code population in 2022: 1,930 Zip code population in 2010: 2,012 Zip code population in 2000: 2,175
Houses and condos: 1,347 Renter-occupied apartments: 150
% of renters here:
17%
State:
38%
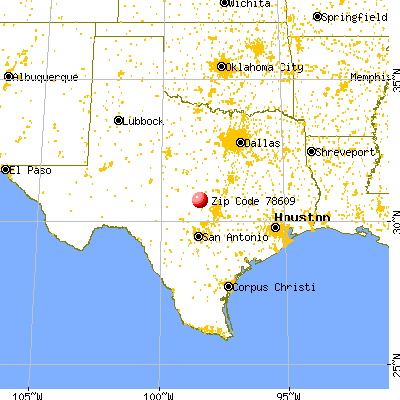
March 2022 cost of living index in zip code 78609: 81.2 (low, U.S. average is 100)
Land area: 23.5 sq. mi. Water area: 12.6 sq. mi.
Population density: 82 people per square mile
(very low).
OSM Map
General Map
Google Map
MSN Map
OSM Map
General Map
Google Map
MSN Map
OSM Map
General Map
Google Map
MSN Map
OSM Map
General Map
Google Map
MSN Map
Please wait while loading the map...
Real estate property taxes paid for housing units in 2022:
This zip code:
0.8% ($2,354)
Texas:
1.5% ($4,050)
Median real estate property taxes paid for housing units with mortgages in 2022: $2,963 (0.9%) Median real estate property taxes paid for housing units with no mortgage in 2022: $2,204 (0.8%)
Averages for the 2020 tax year for zip code 78609, filed in 2021:
Average Adjusted Gross Income (AGI) in 2020: $73,499 (Individual Income Tax Returns)
Here:
$73,499
State:
$77,054
Salary/wage: $53,242 (reported on 63.9% of returns)
Here:
$53,242
State:
$62,766
(% of AGI for various income ranges: 879.0% for AGIs below $25k, 3254.0% for AGIs $25k-50k, 5263.0% for AGIs $50k-75k, 9512.5% for AGIs $75k-100k, 13714.3% for AGIs $100k-200k)
Taxable interest for individuals: $1,706 (reported on 37.1% of returns)
This zip code:
$1,706
Texas:
$2,665
(% of AGI for various income ranges: 16.7% for AGIs below $25k, 44.7% for AGIs $25k-50k, 31.0% for AGIs $50k-75k, 110.0% for AGIs $75k-100k, 225.7% for AGIs $100k-200k)
Ordinary dividends: $6,122 (reported on 23.7% of returns)
Here:
$6,122
State:
$10,044
(% of AGI for various income ranges: 29.5% for AGIs below $25k, 150.0% for AGIs $25k-50k, 115.0% for AGIs $50k-75k, 400.0% for AGIs $75k-100k, 935.7% for AGIs $100k-200k)
Net capital gain/loss in AGI: +$38,630 (reported on 23.7% of returns)
Here:
+$38,630
State:
+$39,590
(% of AGI for various income ranges: 3.8% for AGIs below $25k, 117.3% for AGIs $25k-50k, 57.0% for AGIs $50k-75k, 842.5% for AGIs $75k-100k, 1978.6% for AGIs $100k-200k)
Profit/loss from business: +$14,895 (reported on 20.6% of returns)
Here:
+$14,895
State:
+$10,888
(% of AGI for various income ranges: 200.5% for AGIs below $25k, 363.3% for AGIs $25k-50k, 337.0% for AGIs $50k-75k, 2394.3% for AGIs $100k-200k)
Taxable individual retirement arrangement distribution: $20,588 (reported on 17.5% of returns)
78609:
$20,588
Texas:
$24,740
(% of AGI for various income ranges: 68.1% for AGIs below $25k, 212.7% for AGIs $25k-50k, 385.0% for AGIs $50k-75k, 1382.5% for AGIs $75k-100k, 3000.0% for AGIs $100k-200k)
Total itemized deductions: $27,617 (reported on 6.2% of returns)
Here:
$27,617
State:
$40,428
(% of AGI for various income ranges: 2367.1% for AGIs $100k-200k)
Charity contributions: $5,950 (reported on 4.1% of returns)
Here:
$5,950
State:
$18,201
(% of AGI for various income ranges: 340.0% for AGIs $100k-200k)
Taxes paid: $6,300 (reported on 5.2% of returns)
78609:
$6,300
State:
$7,821
(% of AGI for various income ranges: 450.0% for AGIs $100k-200k)
Earned income credit: $2,154 (reported on 13.4% of returns)
Here:
$2,154
State:
$2,584
(% of AGI for various income ranges: 80.5% for AGIs below $25k, 74.0% for AGIs $25k-50k)
Percentage of individuals using paid preparers for their 2020 taxes: 91.8%
Here:
92%
State:
92%
(% for various income ranges: 90.3% for AGIs below $25k, 90.9% for AGIs $25k-50k, 92.9% for AGIs $50k-75k, 88.9% for AGIs $75k-100k, 93.3% for AGIs $100k-200k, 100.0% for AGIs over 200k)
Averages for the 2012 tax year for zip code 78609, filed in 2013:
Average Adjusted Gross Income (AGI) in 2012: $49,662 (Individual Income Tax Returns)
Here:
$49,662
State:
$65,384
Salary/wage: $36,068 (reported on 64.8% of returns)
Here:
$36,068
State:
$52,524
(% of AGI for various income ranges: 53.0% for AGIs below $25k, 64.1% for AGIs $25k-50k, 38.7% for AGIs $50k-75k, 55.1% for AGIs $75k-100k, 70.4% for AGIs $100k-200k)
Taxable interest for individuals: $1,441 (reported on 38.6% of returns)
This zip code:
$1,441
Texas:
$2,372
(% of AGI for various income ranges: 1.7% for AGIs below $25k, 1.4% for AGIs $25k-50k, 1.3% for AGIs $50k-75k, 1.1% for AGIs $75k-100k, 1.0% for AGIs $100k-200k, 0.4% for AGIs over 200k)
Ordinary dividends: $5,396 (reported on 26.1% of returns)
Here:
$5,396
State:
$9,721
(% of AGI for various income ranges: 3.0% for AGIs below $25k, 1.9% for AGIs $25k-50k, 5.3% for AGIs $50k-75k, 2.4% for AGIs $75k-100k, 4.4% for AGIs $100k-200k)
Net capital gain/loss in AGI: +$10,106 (reported on 19.3% of returns)
Here:
+$10,106
State:
+$35,319
(% of AGI for various income ranges: 0.5% for AGIs $25k-50k, 1.2% for AGIs $50k-75k, 0.3% for AGIs $75k-100k, 16.7% for AGIs $100k-200k)
Profit/loss from business: +$9,521 (reported on 21.6% of returns)
Here:
+$9,521
State:
+$13,732
(% of AGI for various income ranges: 12.2% for AGIs below $25k, 5.0% for AGIs $25k-50k, 5.4% for AGIs $50k-75k, 7.2% for AGIs $75k-100k)
Taxable individual retirement arrangement distribution: $13,235 (reported on 19.3% of returns)
78609:
$13,235
Texas:
$19,511
(% of AGI for various income ranges: 4.4% for AGIs below $25k, 5.6% for AGIs $25k-50k, 6.0% for AGIs $50k-75k, 6.7% for AGIs $75k-100k, 7.7% for AGIs $100k-200k)
Total itemized deductions: $22,468 (22% of AGI, reported on 21.6% of returns)
Here:
$22,468
State:
$24,724
Here:
21.9% of AGI
State:
15.9% of AGI
(% of AGI for various income ranges: 8.0% for AGIs below $25k, 9.4% for AGIs $25k-50k, 8.9% for AGIs $50k-75k, 13.7% for AGIs $75k-100k, 17.2% for AGIs $100k-200k)
Charity contributions: $4,320 (reported on 17.0% of returns)
Here:
$4,320
State:
$6,808
(% of AGI for various income ranges: 1.0% for AGIs $25k-50k, 1.2% for AGIs $50k-75k, 1.7% for AGIs $75k-100k, 3.9% for AGIs $100k-200k)
Taxes paid: $4,974 (reported on 21.6% of returns)
78609:
$4,974
State:
$6,921
(% of AGI for various income ranges: 2.6% for AGIs $25k-50k, 1.9% for AGIs $50k-75k, 2.7% for AGIs $75k-100k, 4.4% for AGIs $100k-200k)
Earned income credit: $2,007 (reported on 17.0% of returns)
Here:
$2,007
State:
$2,570
(% of AGI for various income ranges: 5.5% for AGIs below $25k, 0.7% for AGIs $25k-50k)
Percentage of individuals using paid preparers for their 2012 taxes: 45.5%
Here:
45%
State:
51%
(% for various income ranges: 43.2% for AGIs below $25k, 45.5% for AGIs $25k-50k, 50.0% for AGIs $50k-75k, 37.5% for AGIs $75k-100k, 71.4% for AGIs $100k-200k)
Averages for the 2004 tax year for zip code 78609, filed in 2005:
Average Adjusted Gross Income (AGI) in 2004: $39,943 (Individual Income Tax Returns)
Here:
$39,943
State:
$47,881
Salary/wage: $32,027 (reported on 62.4% of returns)
Here:
$32,027
State:
$41,947
(% of AGI for various income ranges: 90.5% for AGIs below $10k, 53.7% for AGIs $10k-25k, 55.6% for AGIs $25k-50k, 54.9% for AGIs $50k-75k, 48.9% for AGIs $75k-100k, 38.7% for AGIs over 100k)
Taxable interest for individuals: $2,706 (reported on 51.3% of returns)
This zip code:
$2,706
Texas:
$2,255
(% of AGI for various income ranges: 12.3% for AGIs below $10k, 4.2% for AGIs $10k-25k, 3.1% for AGIs $25k-50k, 3.1% for AGIs $50k-75k, 1.3% for AGIs $75k-100k, 4.1% for AGIs over 100k)
Taxable dividends: $3,127 (reported on 28.8% of returns)
Here:
$3,127
State:
$4,261
(% of AGI for various income ranges: 3.2% for AGIs below $10k, 1.7% for AGIs $10k-25k, 1.6% for AGIs $25k-50k, 2.5% for AGIs $50k-75k, 1.3% for AGIs $75k-100k, 3.1% for AGIs over 100k)
Net capital gain/loss: +$8,833 (reported on 25.3% of returns)
Here:
+$8,833
State:
+$16,110
(% of AGI for various income ranges: -0.8% for AGIs below $10k, 1.0% for AGIs $10k-25k, 1.2% for AGIs $25k-50k, 0.1% for AGIs $50k-75k, 1.7% for AGIs $75k-100k, 17.2% for AGIs over 100k)
Profit/loss from business: +$6,628 (reported on 24.6% of returns)
Here:
+$6,628
State:
+$11,013
(% of AGI for various income ranges: 13.3% for AGIs below $10k, 6.1% for AGIs $10k-25k, 7.0% for AGIs $25k-50k, 1.3% for AGIs $50k-75k, 10.5% for AGIs $75k-100k)
IRA payment deduction: $3,385 (reported on 1.5% of returns)
78609:
$3,385
Texas:
$3,120
Total itemized deductions: $18,708 (26% of AGI, reported on 21.9% of returns)
Here:
$18,708
State:
$19,631
Here:
26.3% of AGI
State:
18.9% of AGI
(% of AGI for various income ranges: 13.3% for AGIs $10k-25k, 8.8% for AGIs $25k-50k, 10.0% for AGIs $50k-75k, 10.6% for AGIs $75k-100k, 10.5% for AGIs over 100k)
Charity contributions deductions: $3,610 (5% of AGI, reported on 18.2% of returns)
Here:
$3,610
State:
$4,753
Here:
4.9% of AGI
State:
4.2% of AGI
(% of AGI for various income ranges: 1.1% for AGIs $10k-25k, 1.0% for AGIs $25k-50k, 1.8% for AGIs $50k-75k, 1.5% for AGIs $75k-100k, 2.3% for AGIs over 100k)
Total tax: $5,839 (reported on 74.5% of returns)
78609:
$5,839
State:
$9,058
(% of AGI for various income ranges: 4.5% for AGIs below $10k, 4.1% for AGIs $10k-25k, 7.3% for AGIs $25k-50k, 10.0% for AGIs $50k-75k, 11.7% for AGIs $75k-100k, 17.3% for AGIs over 100k)
Earned income credit: $1,784 (reported on 15.3% of returns)
Here:
$1,784
State:
$2,024
Percentage of individuals using paid preparers for their 2004 taxes: 56.9%
Here:
57%
State:
57%
(% for various income ranges: 55.6% for AGIs below $10k, 59.0% for AGIs $10k-25k, 61.7% for AGIs $25k-50k, 47.4% for AGIs $50k-75k, 58.5% for AGIs $75k-100k, 56.5% for AGIs over 100k)
Household received Food Stamps/SNAP in the past 12 months: 68 Household did not receive Food Stamps/SNAP in the past 12 months: 795
Women who had a birth in the past 12 months: 9 (9 now married, 0 unmarried) Women who did not have a birth in the past 12 months: 173 (92 now married, 80 unmarried)
Housing units in zip code 78609 with a mortgage: 169 (13 second mortgage, 14 both second mortgage and home equity loan) Median monthly owner costs for units with a mortgage: $1,633 Median monthly owner costs for units without a mortgage: $590
Residents with income below the poverty level in 2022:
This zip code:
4.2%
Whole state:
14.0%
Residents with income below 50% of the poverty level in 2022:
This zip code:
2.0%
Whole state:
7.4%
Median number of rooms in houses and condos:
Here:
6.0
State:
6.3
Median number of rooms in apartments:
Here:
4.5
State:
4.0
Notable locations in this zip code not listed on our city pages
Churches in zip code 78609 include: Lakeshore Church (A), First Union Church (B), Buchanan West Baptist Church (C), Chapel of the Hills Baptist Church (D), Genesis Lutheran Church (E). Display/hide their locations on the map
Size of family households: 458 2-persons, 77 3-persons, 62 4-persons, 19 5-persons
Size of nonfamily households: 229 1-person, 23 2-persons
140 married couples with children.
16 single-parent households (16 women).
94.5% of residents of 78609 zip code speak English at home.
5.2% of residents speak Spanish at home (47% very well, 42% well, 11% not at all).
1.0% of residents speak other Indo-European language at home (100% very well).
0.7% of residents speak Asian or Pacific Island language at home (100% very well).
Foreign born population: 91 (4.8%) (50.4% of them are naturalized citizens)
This zip code:
4.8%
Whole state:
17.2%
37%Haiti
35%Honduras
18%Barbados
3%Cambodia
28%English
18%American
7%German
6%Jamaican
5%European
2%Irish
2%Polish
Year of entry for the foreign-born population
242010 or later
02000 to 2009
591990 to 1999
13Before 1990
Housing units lacking complete plumbing facilities: 2.5% Housing units lacking complete kitchen facilities: 6.1%
83.4%Electricity
14.8%Bottled, tank, or LP gas
1.1%Wood
1.0%Utility gas
Population in 1990: 1,457. Population change in the 1990s: +718 (+49.3%).
Place of birth for U.S.-born residents:
This state: 1,219
Northeast: 117
Midwest: 203
South: 171
West: 116
52% of the 78609 zip code residents lived in the same house 5 years ago. Out of people who lived in different houses, 30% lived in this county. Out of people who lived in different counties, 50% lived in Texas.
92% of the 78609 zip code residents lived in the same house 1 year ago. Out of people who lived in different houses, 20% moved from this county. Out of people who lived in different houses, 80% moved from different county within same state. Out of people who lived in different houses, 4% moved from different state.
Private vs. public school enrollment:
Students in private schools in grades 1 to 8 (elementary and middle school): 7
Here:
8.1%
Texas:
8.8%
Students in private schools in grades 9 to 12 (high school):
Here:
0.0%
Texas:
8.0%
Students in private undergraduate colleges:
Here:
0.0%
Texas:
16.2%
Occupation by median earnings in the past 12 months ($)
185,449Management occupations
50,385Production occupations
43,570Transportation occupations
39,948Construction and extraction occupations
37,058Office and administrative support occupations
29,718Installation, maintenance, and repair occupations
Companies with federal contracts located in this zip code:
DAN WILLARD (HWY 29 in BUCHANAN DAM, TX; small business) 4 employees, $430000 revenue. : $11,000 in 2 contractsfrom 1999 to 2000
$8,000 with U.S. Fish and Wildlife Service for Maintenance, Repair or Alteration of Real Property -- Family Housing Facilities. Signed on 2000-12-15. Completion date: 2001-02-15.
$3,000, same as above.Signed on 1999-10-15. Completion date: 1999-12-15.
Top industries in this zip code by the number of employees in 2005:
Accommodation and Food Services: Full-Service Restaurants (10-19: 2, 1-4: 1)
Other Services (except Public Administration): Religious Organizations (5-9: 1, 1-4: 4)
Accommodation and Food Services: Limited-Service Restaurants (10-19: 1)
Other Services (except Public Administration): Pet Care (except Veterinary) Services (5-9: 1)
Professional, Scientific, and Technical Services: Veterinary Services (5-9: 1)
Finance and Insurance: Commercial Banking (5-9: 1)
Fatal accident statistics in 2014:
Fatal accident count: 1
Vehicles involved in fatal accidents: 1
Fatal accidents caused by drunken drivers: 0
Fatalities: 1
Persons involved in fatal accidents: 2
Pedestrians involved in fatal accidents: 1
2002 - 2018 National Fire Incident Reporting System (NFIRS) incidents
According to the data from the years 2002 - 2018 the average number of fire incidents per year is 9. The highest number of reported fires - 32 took place in 2011, and the least - 0 in 2004. The data has a growing trend.
When looking into fire subcategories, the most reports belonged to: Outside Fires (68.5%), and Structure Fires (22.6%).
Fire incident types reported to NFIRS in Zip Code 78609


 Nearest zip codes: 78607, 78639, 78672, 78611, 76824, 78657.


 According to the data from the years 2002 - 2018 the average number of fire incidents per year is 9. The highest number of reported fires - 32 took place in 2011, and the least - 0 in 2004. The data has a growing trend.
 When looking into fire subcategories, the most reports belonged to: Outside Fires (68.5%), and Structure Fires (22.6%).