Estimated zip code population in 2022: 90,560 Zip code population in 2010: 65,099 Zip code population in 2000: 34,250
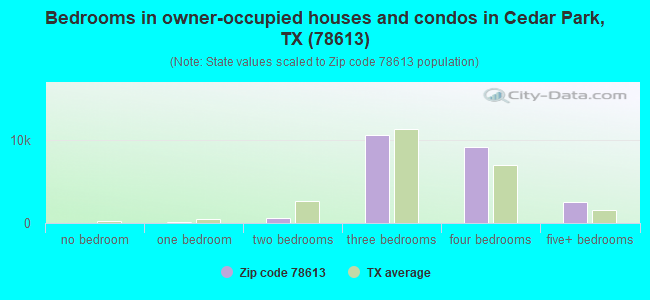
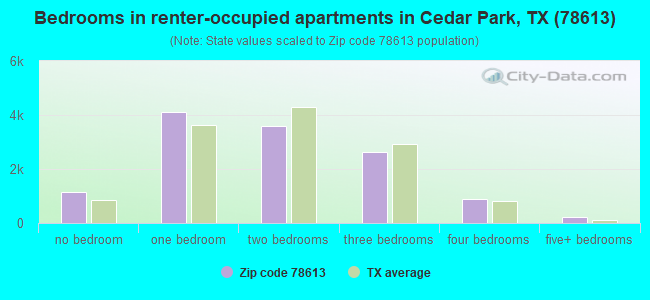
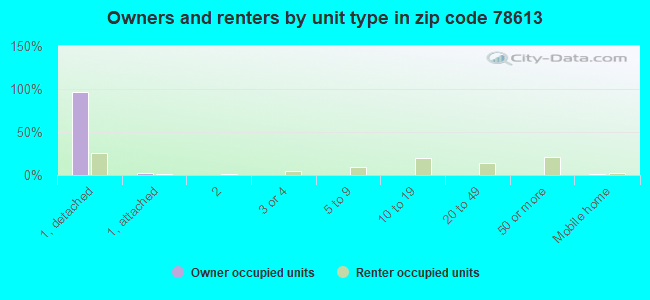
Houses and condos: 35,773 Renter-occupied apartments: 12,534
% of renters here:
35%
State:
38%
March 2022 cost of living index in zip code 78613: 93.9 (less than average, U.S. average is 100)
Land area: 28.1 sq. mi. Water area: 0.1 sq. mi.
Population density: 3,220 people per square mile
(average).
OSM Map
General Map
Google Map
MSN Map
OSM Map
General Map
Google Map
MSN Map
OSM Map
General Map
Google Map
MSN Map
OSM Map
General Map
Google Map
MSN Map
Please wait while loading the map...
Real estate property taxes paid for housing units in 2022:
This zip code:
1.8% ($8,462)
Texas:
1.5% ($4,050)
Median real estate property taxes paid for housing units with mortgages in 2022: $9,001 (1.8%) Median real estate property taxes paid for housing units with no mortgage in 2022: $7,033 (1.6%)
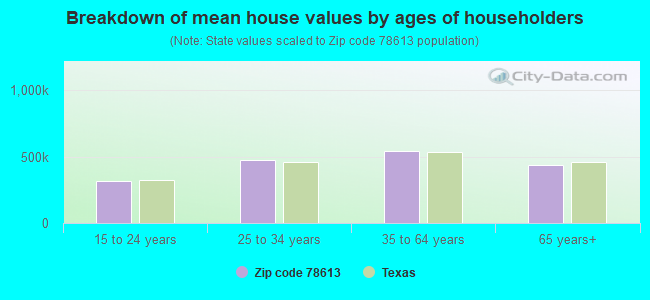
Estimated median house/condo value in 2022: $481,371
78613:
$481,371
Texas:
$275,400
According to our research of Texas and other state lists, there were 27 registered sex offenders living in 78613 zip code as of May 28, 2024. The ratio of all residents to sex offenders in zip code 78613 is 2,828 to 1. The ratio of registered sex offenders to all residents in this zip code is much lower than the state average.
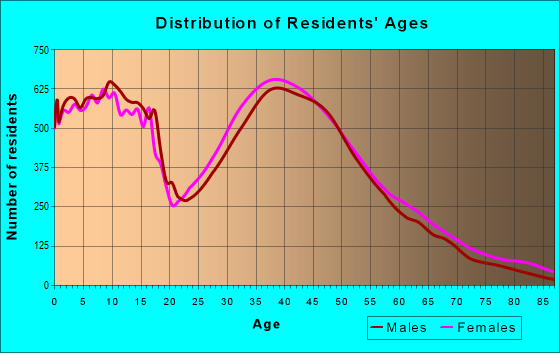
Median resident age:
This zip code:
37.8 years
Texas median age:
35.6 years
Average household size:
This zip code:
2.5 people
Texas:
2.6 people
Averages for the 2020 tax year for zip code 78613, filed in 2021:
Average Adjusted Gross Income (AGI) in 2020: $105,946 (Individual Income Tax Returns)
Here:
$105,946
State:
$77,054
Salary/wage: $95,425 (reported on 86.3% of returns)
Here:
$95,425
State:
$62,766
(% of AGI for various income ranges: 1108.5% for AGIs below $25k, 3634.2% for AGIs $25k-50k, 6568.8% for AGIs $50k-75k, 10232.7% for AGIs $75k-100k, 20086.2% for AGIs $100k-200k, 77861.9% for AGIs over 200k)
Taxable interest for individuals: $1,258 (reported on 34.8% of returns)
This zip code:
$1,258
Texas:
$2,665
(% of AGI for various income ranges: 15.3% for AGIs below $25k, 19.1% for AGIs $25k-50k, 33.9% for AGIs $50k-75k, 48.6% for AGIs $75k-100k, 95.4% for AGIs $100k-200k, 423.1% for AGIs over 200k)
Ordinary dividends: $4,288 (reported on 27.5% of returns)
Here:
$4,288
State:
$10,044
(% of AGI for various income ranges: 28.9% for AGIs below $25k, 39.1% for AGIs $25k-50k, 92.1% for AGIs $50k-75k, 124.3% for AGIs $75k-100k, 222.2% for AGIs $100k-200k, 1326.0% for AGIs over 200k)
Net capital gain/loss in AGI: +$25,008 (reported on 27.0% of returns)
Here:
+$25,008
State:
+$39,590
(% of AGI for various income ranges: 15.5% for AGIs below $25k, 39.3% for AGIs $25k-50k, 80.8% for AGIs $50k-75k, 165.4% for AGIs $75k-100k, 481.5% for AGIs $100k-200k, 12663.4% for AGIs over 200k)
Profit/loss from business: +$14,979 (reported on 20.0% of returns)
Here:
+$14,979
State:
+$10,888
(% of AGI for various income ranges: 147.9% for AGIs below $25k, 229.4% for AGIs $25k-50k, 324.4% for AGIs $50k-75k, 409.0% for AGIs $75k-100k, 614.2% for AGIs $100k-200k, 2223.2% for AGIs over 200k)
Taxable individual retirement arrangement distribution: $21,125 (reported on 6.9% of returns)
78613:
$21,125
Texas:
$24,740
(% of AGI for various income ranges: 44.0% for AGIs below $25k, 79.3% for AGIs $25k-50k, 168.1% for AGIs $50k-75k, 274.4% for AGIs $75k-100k, 413.0% for AGIs $100k-200k, 842.3% for AGIs over 200k)
Self-employed (Keogh) retirement plans: $21,631 (reported on 0.7% of returns)
78613:
$21,631
Texas:
$29,298
(% of AGI for various income ranges: 5.7% for AGIs $25k-50k, 10.8% for AGIs $75k-100k, 19.7% for AGIs $100k-200k, 217.1% for AGIs over 200k)
Total itemized deductions: $30,422 (reported on 11.3% of returns)
Here:
$30,422
State:
$40,428
(% of AGI for various income ranges: 51.1% for AGIs below $25k, 110.0% for AGIs $25k-50k, 296.3% for AGIs $50k-75k, 441.9% for AGIs $75k-100k, 821.8% for AGIs $100k-200k, 3383.5% for AGIs over 200k)
Charity contributions: $9,854 (reported on 9.1% of returns)
Here:
$9,854
State:
$18,201
(% of AGI for various income ranges: 3.7% for AGIs below $25k, 15.7% for AGIs $25k-50k, 41.4% for AGIs $50k-75k, 62.8% for AGIs $75k-100k, 197.0% for AGIs $100k-200k, 1153.3% for AGIs over 200k)
Taxes paid: $8,611 (reported on 11.2% of returns)
78613:
$8,611
State:
$7,821
(% of AGI for various income ranges: 12.8% for AGIs below $25k, 29.8% for AGIs $25k-50k, 83.9% for AGIs $50k-75k, 140.2% for AGIs $75k-100k, 252.6% for AGIs $100k-200k, 872.4% for AGIs over 200k)
Earned income credit: $2,084 (reported on 8.7% of returns)
Here:
$2,084
State:
$2,584
(% of AGI for various income ranges: 60.3% for AGIs below $25k, 51.4% for AGIs $25k-50k, 0.8% for AGIs $50k-75k)
Percentage of individuals using paid preparers for their 2020 taxes: 93.0%
Here:
93%
State:
92%
(% for various income ranges: 91.6% for AGIs below $25k, 93.3% for AGIs $25k-50k, 93.0% for AGIs $50k-75k, 91.9% for AGIs $75k-100k, 93.8% for AGIs $100k-200k, 94.6% for AGIs over 200k)
Averages for the 2012 tax year for zip code 78613, filed in 2013:
Average Adjusted Gross Income (AGI) in 2012: $78,432 (Individual Income Tax Returns)
Here:
$78,432
State:
$65,384
Salary/wage: $71,727 (reported on 89.0% of returns)
Here:
$71,727
State:
$52,524
(% of AGI for various income ranges: 79.1% for AGIs below $25k, 82.7% for AGIs $25k-50k, 81.6% for AGIs $50k-75k, 84.8% for AGIs $75k-100k, 87.6% for AGIs $100k-200k, 69.2% for AGIs over 200k)
Taxable interest for individuals: $872 (reported on 37.0% of returns)
This zip code:
$872
Texas:
$2,372
(% of AGI for various income ranges: 1.0% for AGIs below $25k, 0.5% for AGIs $25k-50k, 0.5% for AGIs $50k-75k, 0.3% for AGIs $75k-100k, 0.3% for AGIs $100k-200k, 0.5% for AGIs over 200k)
Ordinary dividends: $3,835 (reported on 23.3% of returns)
Here:
$3,835
State:
$9,721
(% of AGI for various income ranges: 1.7% for AGIs below $25k, 0.9% for AGIs $25k-50k, 0.7% for AGIs $50k-75k, 0.8% for AGIs $75k-100k, 0.8% for AGIs $100k-200k, 2.2% for AGIs over 200k)
Net capital gain/loss in AGI: +$12,251 (reported on 20.3% of returns)
Here:
+$12,251
State:
+$35,319
(% of AGI for various income ranges: 0.2% for AGIs $25k-50k, 0.3% for AGIs $50k-75k, 0.4% for AGIs $75k-100k, 0.8% for AGIs $100k-200k, 11.6% for AGIs over 200k)
Profit/loss from business: +$14,344 (reported on 18.7% of returns)
Here:
+$14,344
State:
+$13,732
(% of AGI for various income ranges: 8.9% for AGIs below $25k, 5.3% for AGIs $25k-50k, 4.2% for AGIs $50k-75k, 3.4% for AGIs $75k-100k, 2.5% for AGIs $100k-200k, 2.8% for AGIs over 200k)
Taxable individual retirement arrangement distribution: $17,713 (reported on 7.8% of returns)
78613:
$17,713
Texas:
$19,511
(% of AGI for various income ranges: 2.4% for AGIs below $25k, 1.9% for AGIs $25k-50k, 2.0% for AGIs $50k-75k, 1.8% for AGIs $75k-100k, 1.7% for AGIs $100k-200k, 1.7% for AGIs over 200k)
Self-employment retirement plans: $13,841 (reported on 0.5% of returns)
78613:
$13,841
Texas:
$23,938
(% of AGI for various income ranges: 0.1% for AGIs $25k-50k, 0.2% for AGIs over 200k)
Total itemized deductions: $20,704 (17% of AGI, reported on 44.8% of returns)
Here:
$20,704
State:
$24,724
Here:
16.9% of AGI
State:
15.9% of AGI
(% of AGI for various income ranges: 11.1% for AGIs below $25k, 11.5% for AGIs $25k-50k, 14.0% for AGIs $50k-75k, 13.9% for AGIs $75k-100k, 12.8% for AGIs $100k-200k, 8.3% for AGIs over 200k)
Charity contributions: $3,703 (reported on 35.8% of returns)
Here:
$3,703
State:
$6,808
(% of AGI for various income ranges: 0.7% for AGIs below $25k, 1.1% for AGIs $25k-50k, 1.6% for AGIs $50k-75k, 1.7% for AGIs $75k-100k, 1.9% for AGIs $100k-200k, 1.8% for AGIs over 200k)
Taxes paid: $7,436 (reported on 44.3% of returns)
78613:
$7,436
State:
$6,921
(% of AGI for various income ranges: 2.9% for AGIs below $25k, 3.7% for AGIs $25k-50k, 4.5% for AGIs $50k-75k, 4.8% for AGIs $75k-100k, 4.8% for AGIs $100k-200k, 3.2% for AGIs over 200k)
Earned income credit: $2,064 (reported on 11.1% of returns)
Here:
$2,064
State:
$2,570
(% of AGI for various income ranges: 5.2% for AGIs below $25k, 1.0% for AGIs $25k-50k)
Percentage of individuals using paid preparers for their 2012 taxes: 33.8%
Here:
34%
State:
51%
(% for various income ranges: 29.8% for AGIs below $25k, 31.3% for AGIs $25k-50k, 33.2% for AGIs $50k-75k, 33.2% for AGIs $75k-100k, 36.6% for AGIs $100k-200k, 53.3% for AGIs over 200k)
Averages for the 2004 tax year for zip code 78613, filed in 2005:
Average Adjusted Gross Income (AGI) in 2004: $60,828 (Individual Income Tax Returns)
Here:
$60,828
State:
$47,881
Salary/wage: $58,538 (reported on 90.7% of returns)
Here:
$58,538
State:
$41,947
(% of AGI for various income ranges: 152.8% for AGIs below $10k, 80.4% for AGIs $10k-25k, 87.3% for AGIs $25k-50k, 87.4% for AGIs $50k-75k, 89.4% for AGIs $75k-100k, 85.8% for AGIs over 100k)
Taxable interest for individuals: $713 (reported on 46.1% of returns)
This zip code:
$713
Texas:
$2,255
(% of AGI for various income ranges: 4.4% for AGIs below $10k, 1.4% for AGIs $10k-25k, 0.6% for AGIs $25k-50k, 0.4% for AGIs $50k-75k, 0.4% for AGIs $75k-100k, 0.5% for AGIs over 100k)
Taxable dividends: $1,331 (reported on 25.1% of returns)
Here:
$1,331
State:
$4,261
(% of AGI for various income ranges: 4.1% for AGIs below $10k, 1.2% for AGIs $10k-25k, 0.5% for AGIs $25k-50k, 0.4% for AGIs $50k-75k, 0.4% for AGIs $75k-100k, 0.6% for AGIs over 100k)
Net capital gain/loss: +$5,109 (reported on 24.2% of returns)
Here:
+$5,109
State:
+$16,110
(% of AGI for various income ranges: -4.0% for AGIs below $10k, 0.1% for AGIs $10k-25k, 0.2% for AGIs $25k-50k, 0.8% for AGIs $50k-75k, 0.8% for AGIs $75k-100k, 4.0% for AGIs over 100k)
Profit/loss from business: +$11,358 (reported on 18.2% of returns)
Here:
+$11,358
State:
+$11,013
(% of AGI for various income ranges: 4.0% for AGIs below $10k, 7.5% for AGIs $10k-25k, 4.3% for AGIs $25k-50k, 3.6% for AGIs $50k-75k, 3.1% for AGIs $75k-100k, 2.8% for AGIs over 100k)
IRA payment deduction: $2,932 (reported on 2.5% of returns)
78613:
$2,932
Texas:
$3,120
(% of AGI for various income ranges: 0.2% for AGIs $10k-25k, 0.2% for AGIs $25k-50k, 0.1% for AGIs $50k-75k, 0.1% for AGIs $75k-100k, 0.1% for AGIs over 100k)
Self-employed pension: $10,053 (reported on 0.8% of returns)
Here:
$10,053
Texas:
$16,401
(% of AGI for various income ranges: 0.7% for AGIs below $10k, 0.1% for AGIs $25k-50k, 0.1% for AGIs $50k-75k, 0.1% for AGIs $75k-100k, 0.2% for AGIs over 100k)
Total itemized deductions: $17,592 (20% of AGI, reported on 53.4% of returns)
Here:
$17,592
State:
$19,631
Here:
20.2% of AGI
State:
18.9% of AGI
(% of AGI for various income ranges: 23.4% for AGIs below $10k, 12.7% for AGIs $10k-25k, 16.4% for AGIs $25k-50k, 18.0% for AGIs $50k-75k, 17.6% for AGIs $75k-100k, 13.3% for AGIs over 100k)
Charity contributions deductions: $2,697 (3% of AGI, reported on 44.1% of returns)
Here:
$2,697
State:
$4,753
Here:
3.0% of AGI
State:
4.2% of AGI
(% of AGI for various income ranges: 0.9% for AGIs below $10k, 1.0% for AGIs $10k-25k, 1.6% for AGIs $25k-50k, 1.9% for AGIs $50k-75k, 2.1% for AGIs $75k-100k, 2.1% for AGIs over 100k)
Total tax: $8,794 (reported on 82.6% of returns)
78613:
$8,794
State:
$9,058
(% of AGI for various income ranges: 4.4% for AGIs below $10k, 4.7% for AGIs $10k-25k, 7.0% for AGIs $25k-50k, 8.6% for AGIs $50k-75k, 10.0% for AGIs $75k-100k, 16.5% for AGIs over 100k)
Earned income credit: $1,647 (reported on 9.0% of returns)
Here:
$1,647
State:
$2,024
Percentage of individuals using paid preparers for their 2004 taxes: 36.4%
Here:
36%
State:
57%
(% for various income ranges: 31.2% for AGIs below $10k, 40.6% for AGIs $10k-25k, 37.1% for AGIs $25k-50k, 36.1% for AGIs $50k-75k, 33.8% for AGIs $75k-100k, 38.7% for AGIs over 100k)
Likely homosexual households (counted as self-reported same-sex unmarried-partner households)
Lesbian couples: 0.3% of all households
Gay men: 0.1% of all households
Household received Food Stamps/SNAP in the past 12 months: 1,005 Household did not receive Food Stamps/SNAP in the past 12 months: 34,473
Women who had a birth in the past 12 months: 988 (977 now married, 27 unmarried) Women who did not have a birth in the past 12 months: 22,554 (11,479 now married, 11,026 unmarried)
Housing units in zip code 78613 with a mortgage: 16,693 (1,377 second mortgage, 1,120 both second mortgage and home equity loan) Houses without a mortgage: 137
Median monthly owner costs for units with a mortgage: $2,439 Median monthly owner costs for units without a mortgage: $949
Residents with income below the poverty level in 2022:
This zip code:
5.7%
Whole state:
14.0%
Residents with income below 50% of the poverty level in 2022:
This zip code:
3.2%
Whole state:
7.4%
Median number of rooms in houses and condos:
Here:
7.0
State:
6.3
Median number of rooms in apartments:
Here:
3.6
State:
4.0
Notable locations in this zip code not listed on our city pages
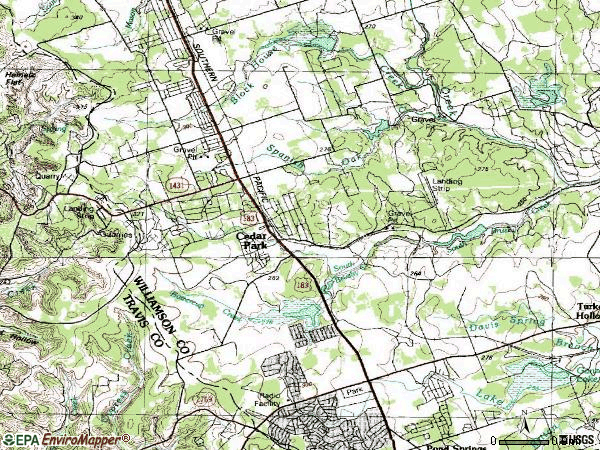
Notable locations in zip code 78613: Cedar Park Volunteer Fire Department (A), Cedar Park Fire Department Station 3 (B), Cedar Park Fire Department Station 1 (C), Cedar Park Fire Department Station 2 (D), Williamson County Emergency Medical Services Cedar Park (E). Display/hide their locations on the map
Churches in zip code 78613 include: Cypress Creek Baptist Church (A), Carriage Hills Baptist Church (B), Whitestone Assembly of God Church (C), Living Hope Community Church (D), Gateway Community Church (E), Cedar Park United Methodist Church (F), Saint Margaret Mary Catholic Church (G), Newsong Baptist Church (H), Lakehills Free Will Baptist Church (I). Display/hide their locations on the map
Reservoirs: Soil Conservation Service Site 7 Reservoir (A), Walsh Lake (B), Soil Conservation Service Site 6 Reservoir (C). Display/hide their locations on the map
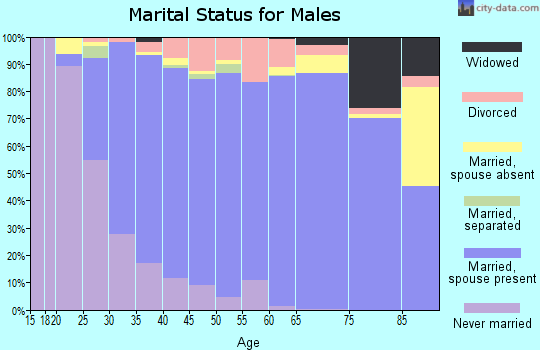
17,174 married couples with children.
3,277 single-parent households (806 men, 2,471 women).
77.2% of residents of 78613 zip code speak English at home.
9.9% of residents speak Spanish at home (70% very well, 16% well, 10% not well, 4% not at all).
4.8% of residents speak other Indo-European language at home (81% very well, 14% well, 5% not well, 1% not at all).
7.5% of residents speak Asian or Pacific Island language at home (70% very well, 20% well, 10% not well).
0.9% of residents speak other language at home (86% very well, 13% well).
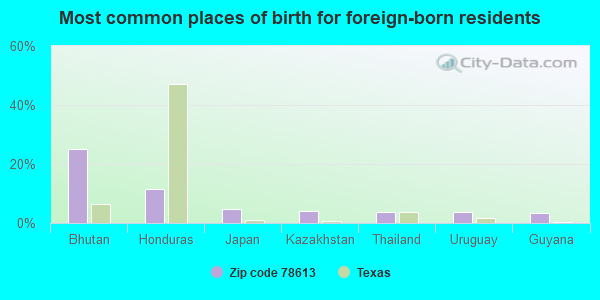
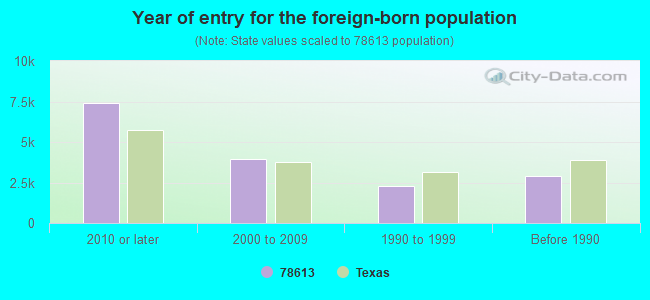
Foreign born population: 14,427 (15.9%) (46.8% of them are naturalized citizens)
Facilities with environmental interests located in this zip code:
ADA MAE FAUBION EL (1209 CYPRESS CREEK RD in CEDAR PARK, TX)
(National Center for Education Statistics) - STATE ID-246913102 Organizations: LEANDER ISD (SCHOOL DISTRICT)
AUTO PATCH INC (2315 S BELL BLVD in CEDAR PARK, TX)
(Resource Conservation and Recovery Act (tracking hazardous waste)) Business NAICS classification: AUTOMOTIVE BODY, PAINT, AND INTERIOR REPAIR AND MAINTENANCE.
ATX TECHNOLOGIES (700 S BELL BLVD STE F1 in CEDAR PARK, TX)
(Resource Conservation and Recovery Act (tracking hazardous waste))
Housing units lacking complete plumbing facilities: 0.1% Housing units lacking complete kitchen facilities: 0.6%
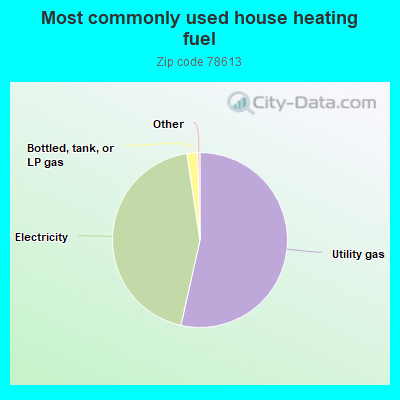
53.5%Utility gas
44.1%Electricity
2.0%Bottled, tank, or LP gas
Population in 1990: 22,192. Population change in the 1990s: +12,058 (+54.3%).
Place of birth for U.S.-born residents:
This state: 41,487
Northeast: 5,072
Midwest: 9,180
South: 7,453
West: 11,905
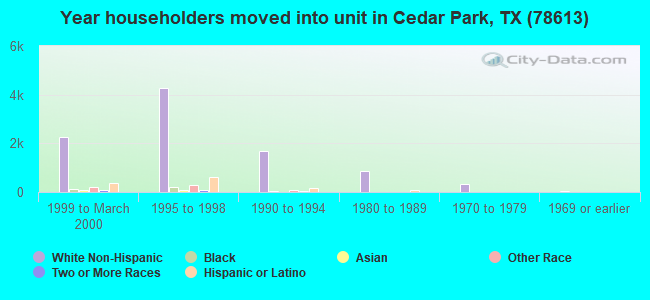
35% of the 78613 zip code residents lived in the same house 5 years ago. Out of people who lived in different houses, 29% lived in this county. Out of people who lived in different counties, 50% lived in Texas.
86% of the 78613 zip code residents lived in the same house 1 year ago. Out of people who lived in different houses, 38% moved from this county. Out of people who lived in different houses, 34% moved from different county within same state. Out of people who lived in different houses, 27% moved from different state. Out of people who lived in different houses, 4% moved from abroad.
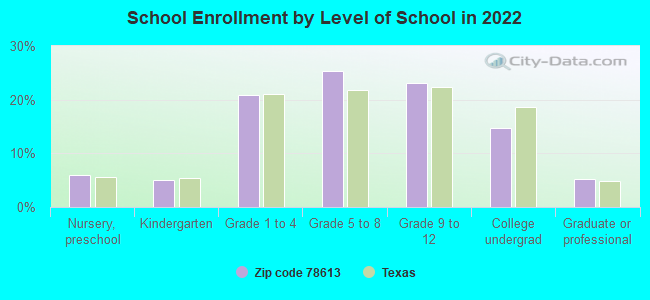
Private vs. public school enrollment:
Students in private schools in grades 1 to 8 (elementary and middle school): 1,329
Here:
12.8%
Texas:
8.8%
Students in private schools in grades 9 to 12 (high school): 411
Here:
7.9%
Texas:
8.0%
Students in private undergraduate colleges: 660
Here:
19.8%
Texas:
16.2%
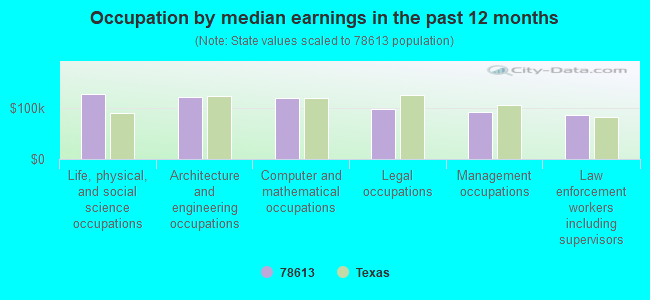
Occupation by median earnings in the past 12 months ($)
128,716Life, physical, and social science occupations
121,248Architecture and engineering occupations
120,167Computer and mathematical occupations
98,622Legal occupations
92,741Management occupations
87,073Law enforcement workers including supervisors
Companies with biggest federal contracts located in this zip code (CEDAR PARK, TX):
ETS LINDGREN, LP (1301 ARROW POINT DR) : $4,233,583 in 64 contractsfrom 2001 to 2006
Contracts for Miscellaneous Prefabricated Structures, Miscellaneous Fabricated Nonmetallic Materials, Laboratory Equipment and Supplies, Electrical and Electronic Properties Measuring and Testing Instruments, and moreby Navy, NASA, Air Force, Army, and others Signed by year:2000: $0; 2001: $279,000; 2002: $1,618,500; 2003: $143,403; 2004: $188,425; 2005: $1,493,310; 2006: $510,945.
Biggest contracts:
$874,500 with Navy for Miscellaneous Prefabricated Structures. Signed on 2002-09-30. Completion date: 2003-05-30.
$630,000 with NASA for Miscellaneous Fabricated Nonmetallic Materials. Signed on 2002-03-15. Completion date: 2002-08-15.
$536,000 with Air Force for Laboratory Equipment and Supplies. Taking place in CO. Signed on 2005-08-04. Completion date: 2005-08-31.
$349,784 with Air Force for Electrical and Electronic Properties Measuring and Testing Instruments. Signed on 2005-09-21. Completion date: 2005-12-02.
VARCO LP (1200 CYPRESS CREEK RD; small business) : $671,056 in 24 contractsfrom 2000 to 2006
Contracts for Miscellaneous Communication Equipment, Inspection Services (including commercial testing and lab services, except medical/dental) -- Special Industry Machinery, Combination and Miscellaneous Instruments, ADP Input/Output and Storage Devices, and moreby Navy, U.S. Army Corps of Engineers - civil program financing only, NASA, Army, and others Signed by year:2000: $123,000; 2001: $55,400; 2002: $341,785; 2003: $36,160; 2004: $17,775; 2005: $29,513; 2006: $67,423.
Biggest contracts:
$242,375 with Navy for Miscellaneous Communication Equipment. Signed on 2002-09-11. Completion date: 2002-09-11.
$55,400, same as above.Signed on 2001-12-20. Completion date: 2001-12-20.
$51,200 with U.S. Army Corps of Engineers - civil program financing only for Inspection Services (including commercial testing and lab services, except medical/dental) -- Special Industry Machinery. Taking place in MN. Signed on 2000-10-24. Completion date: 2002-09-01.
$44,810 with NASA for Combination and Miscellaneous Instruments. Signed on 2006-09-19. Completion date: 2006-12-12.
ECHO TECHNICAL (930 S BELL BLVD, SUITE #3; small business) : $540,427 in 3 contractsfrom 2004 to 2005
$341,042 with Army for Other Research and Development -- Basic Research (R&D). Signed on 2005-10-04. Completion date: 2006-10-04.
$99,884, same as above.Signed on 2004-07-30. Completion date: 2005-01-31.
$99,501 with Office of Policy, Management and Budget/Chief Financial Officer for Other Research and Development -- Engineering Development (R&D). Signed on 2004-03-30. Effective on 2004-04-01. Completion date: 2004-04-01.
ZC&H DYNAMIC SYSTEMS INC (102 SAN MATEO TERRACE; small business) : $499,833 in 3 contractsfrom 2000 to 2001
$200,000 with Air Force for Defense Electronics and Communication Equipment -- Management and Support (R&D). Signed on 2000-01-24. Completion date: 2001-04-01.
$199,848, same as above.Signed on 2000-03-07. Completion date: 2001-04-01.
$99,985, same as above.Signed on 2001-04-18. Completion date: 2002-01-25.
FREEDOM POWER SYSTEMS INC (1620 LA JAITA DR; small business) : $410,615 in 7 contractsfrom 2002 to 2006
Contracts for Miscellaneous Aircraft Accessories and Components, Converters, Electrical, Nonrotating by Navy Signed by year:2000: $0; 2001: $0; 2002: $45,500; 2003: $99,925; 2004: $45,240; 2005: $166,750; 2006: $53,200.
Biggest contracts:
$99,925 with Navy for Miscellaneous Aircraft Accessories and Components. Signed on 2003-05-07. Completion date: 2003-09-15.
$82,890 with Navy for Converters, Electrical, Nonrotating. Taking place in CA. Signed on 2005-09-20. Completion date: 2005-09-20.
$59,900, same as above.Signed on 2005-12-21. Completion date: 2006-03-29.
$53,200, same as above.Signed on 2006-04-07. Completion date: 2006-08-22.
TDK RF SOLUTIONS INC (1101 CYPRESS CREEK RD; small business) : $362,530 in 9 contractsfrom 2003 to 2006
Contracts for Electrical and Electronic Properties Measuring and Testing Instruments, Miscellaneous Items, Antennas, Waveguides, and Related Equipment, , and moreby Army, NASA, Navy Signed by year:2000: $0; 2001: $0; 2002: $0; 2003: $98,304; 2004: $164,650; 2005: $6,885; 2006: $92,691.
Biggest contracts:
$153,290 with Army for Electrical and Electronic Properties Measuring and Testing Instruments. Taking place in AL. Signed on 2004-02-27. Completion date: 2004-05-19.
$93,654 with Army for Miscellaneous Items. Taking place in AL. Signed on 2003-09-25. Completion date: 2003-11-28.
$63,500 with NASA for Electrical and Electronic Properties Measuring and Testing Instruments. Signed on 2006-08-31. Completion date: 2006-10-20.
$25,626 with Navy for Antennas, Waveguides, and Related Equipment. Taking place in VA. Signed on 2006-05-01. Completion date: 2006-06-01.
OPTIMISTIC ENTERPRISES, INC (300 BRUSHY CREEK RD STE 30; small business)
$81,515 with Army for Mini and Micro Computer Control Devices. Signed on 2004-05-11. Completion date: 2004-06-11.
TUNGSTEN GRAPHICS INC (114 S PRIZE OAKS DR; small business) : $79,100 in 2 contractsin 2004
$57,700 with Army for ADP Software. Taking place in AL. Signed on 2004-07-01. Completion date: 2004-09-20.
$21,400, same as above.Signed on 2004-03-09. Completion date: 2004-04-09.
UNITED RENTALS (NORTH AMERICA) (609 N BELL BLVD; small business)
$38,585 with Army for Trucks and Truck Tractors, Wheeled. Signed on 2004-09-13. Completion date: 2004-12-20.
CINC PROCESSING EQUIPMENT, INC (408 CRIPPLE CREEK RD; small business) : $34,225 in 2 contractsfrom 2003 to 2006
$26,950 with Navy for Lease or Rental of Equipment -- Instruments and Laboratory Equipment. Taking place in NV. Signed on 2003-02-03. Completion date: 2003-06-03.
$7,275 with Navy for Miscellaneous Electrical and Electronic Components. Signed on 2006-01-30. Completion date: 2006-03-30.
Top industries in this zip code by the number of employees in 2005:
2002 - 2018 National Fire Incident Reporting System (NFIRS) incidents
According to the data from the years 2002 - 2018 the average number of fire incidents per year is 143. The highest number of fires - 247 took place in 2008, and the least - 88 in 2004. The data has a growing trend.
When looking into fire subcategories, the most reports belonged to: Outside Fires (47.1%), and Structure Fires (37.3%).
Fire incident types reported to NFIRS in Zip Code 78613
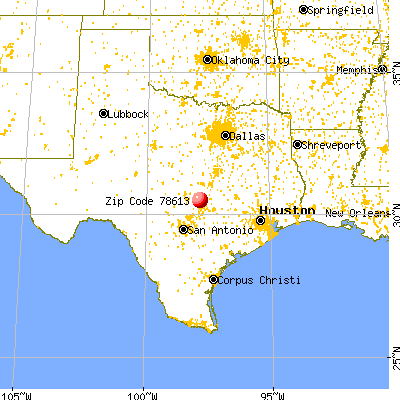


 Nearest zip codes: 78726, 78717, 78729, 78750, 78641, 78681.
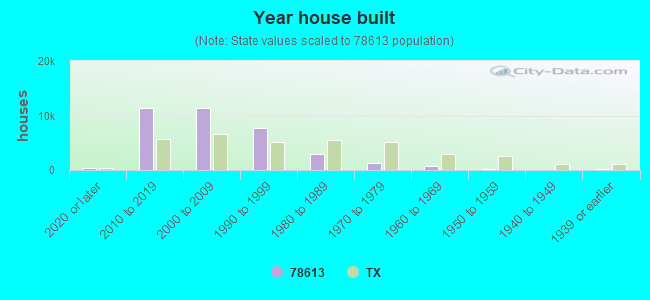


 According to the data from the years 2002 - 2018 the average number of fire incidents per year is 143. The highest number of fires - 247 took place in 2008, and the least - 88 in 2004. The data has a growing trend.
 When looking into fire subcategories, the most reports belonged to: Outside Fires (47.1%), and Structure Fires (37.3%).