Estimated zip code population in 2022: 9,058 Zip code population in 2010: 7,092 Zip code population in 2000: 4,369
Houses and condos: 3,029 Renter-occupied apartments: 485
% of renters here:
18%
State:
38%
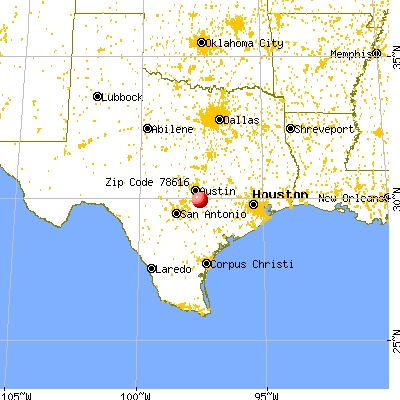
March 2022 cost of living index in zip code 78616: 80.1 (low, U.S. average is 100)
Land area: 109.9 sq. mi. Water area: 0.3 sq. mi.
Population density: 82 people per square mile
(very low).
OSM Map
General Map
Google Map
MSN Map
OSM Map
General Map
Google Map
MSN Map
OSM Map
General Map
Google Map
MSN Map
OSM Map
General Map
Google Map
MSN Map
Please wait while loading the map...
Real estate property taxes paid for housing units in 2022:
This zip code:
1.1% ($2,249)
Texas:
1.5% ($4,050)
Median real estate property taxes paid for housing units with mortgages in 2022: $2,461 (1.1%) Median real estate property taxes paid for housing units with no mortgage in 2022: $2,089 (1.2%)
Business Search- 14 Million verified businesses
Males: 4,958
(54.7%)
Females: 4,099
(45.3%)
For population 25 years and over in 78616:
High school or higher: 69.7%
Bachelor's degree or higher: 15.2%
Graduate or professional degree: 4.4%
Unemployed: 2.3%
Mean travel time to work (commute): 53.2 minutes
For population 15 years and over in 78616:
Never married: 34.7%
Now married: 47.3%
Separated: 1.4%
Widowed: 5.5%
Divorced: 11.1%
Zip code 78616 compared to state average:
Unemployed percentage below state average.
Black race population percentage significantly below state average.
Hispanic race population percentage above state average.
Renting percentage below state average.
Length of stay since moving in significantly above state average.
Percentage of population with a bachelor's degree or higher significantly below state average.
Averages for the 2020 tax year for zip code 78616, filed in 2021:
Average Adjusted Gross Income (AGI) in 2020: $45,729 (Individual Income Tax Returns)
Here:
$45,729
State:
$77,054
Salary/wage: $42,750 (reported on 76.6% of returns)
Here:
$42,750
State:
$62,766
(% of AGI for various income ranges: 1133.6% for AGIs below $25k, 3748.9% for AGIs $25k-50k, 6981.6% for AGIs $50k-75k, 9615.6% for AGIs $75k-100k, 15071.0% for AGIs $100k-200k)
Taxable interest for individuals: $708 (reported on 14.4% of returns)
This zip code:
$708
Texas:
$2,665
(% of AGI for various income ranges: 5.3% for AGIs below $25k, 10.4% for AGIs $25k-50k, 15.3% for AGIs $50k-75k, 16.0% for AGIs $75k-100k, 53.0% for AGIs $100k-200k)
Ordinary dividends: $3,081 (reported on 4.6% of returns)
Here:
$3,081
State:
$10,044
(% of AGI for various income ranges: 4.4% for AGIs below $25k, 10.0% for AGIs $25k-50k, 6.7% for AGIs $50k-75k, 15.6% for AGIs $75k-100k, 70.0% for AGIs $100k-200k)
Net capital gain/loss in AGI: +$32,855 (reported on 4.4% of returns)
Here:
+$32,855
State:
+$39,590
(% of AGI for various income ranges: 1.7% for AGIs below $25k, 7.5% for AGIs $25k-50k, 20.4% for AGIs $50k-75k, 38.4% for AGIs $75k-100k, 502.5% for AGIs $100k-200k)
Profit/loss from business: +$15,549 (reported on 28.8% of returns)
Here:
+$15,549
State:
+$10,888
(% of AGI for various income ranges: 551.8% for AGIs below $25k, 625.5% for AGIs $25k-50k, 703.3% for AGIs $50k-75k, 496.4% for AGIs $75k-100k, 1223.5% for AGIs $100k-200k)
Taxable individual retirement arrangement distribution: $14,783 (reported on 2.6% of returns)
78616:
$14,783
Texas:
$24,740
(% of AGI for various income ranges: 53.7% for AGIs $25k-50k, 83.5% for AGIs $50k-75k, 387.0% for AGIs $100k-200k)
Total itemized deductions: $25,992 (reported on 2.6% of returns)
Here:
$25,992
State:
$40,428
(% of AGI for various income ranges: 85.6% for AGIs $25k-50k, 157.1% for AGIs $50k-75k, 230.0% for AGIs $75k-100k, 416.0% for AGIs $100k-200k)
Charity contributions: $6,550 (reported on 1.7% of returns)
Here:
$6,550
State:
$18,201
(% of AGI for various income ranges: 19.7% for AGIs $25k-50k, 122.8% for AGIs $75k-100k)
Taxes paid: $5,383 (reported on 2.6% of returns)
78616:
$5,383
State:
$7,821
(% of AGI for various income ranges: 17.0% for AGIs $25k-50k, 24.1% for AGIs $50k-75k, 56.4% for AGIs $75k-100k, 100.0% for AGIs $100k-200k)
Earned income credit: $2,860 (reported on 22.7% of returns)
Here:
$2,860
State:
$2,584
(% of AGI for various income ranges: 165.6% for AGIs below $25k, 92.7% for AGIs $25k-50k)
Percentage of individuals using paid preparers for their 2020 taxes: 85.6%
Here:
86%
State:
92%
(% for various income ranges: 83.3% for AGIs below $25k, 87.0% for AGIs $25k-50k, 86.8% for AGIs $50k-75k, 85.3% for AGIs $75k-100k, 87.1% for AGIs $100k-200k, 100.0% for AGIs over 200k)
Averages for the 2012 tax year for zip code 78616, filed in 2013:
Average Adjusted Gross Income (AGI) in 2012: $37,309 (Individual Income Tax Returns)
Here:
$37,309
State:
$65,384
Salary/wage: $35,448 (reported on 83.6% of returns)
Here:
$35,448
State:
$52,524
(% of AGI for various income ranges: 75.1% for AGIs below $25k, 86.3% for AGIs $25k-50k, 82.9% for AGIs $50k-75k, 78.8% for AGIs $75k-100k, 68.9% for AGIs $100k-200k)
Taxable interest for individuals: $762 (reported on 18.2% of returns)
This zip code:
$762
Texas:
$2,372
(% of AGI for various income ranges: 0.4% for AGIs below $25k, 0.4% for AGIs $25k-50k, 0.2% for AGIs $50k-75k, 0.3% for AGIs $75k-100k, 0.6% for AGIs $100k-200k)
Ordinary dividends: $1,744 (reported on 6.6% of returns)
Here:
$1,744
State:
$9,721
(% of AGI for various income ranges: 0.5% for AGIs below $25k, 0.2% for AGIs $25k-50k, 0.2% for AGIs $50k-75k, 0.2% for AGIs $75k-100k, 0.5% for AGIs $100k-200k)
Net capital gain/loss in AGI: +$6,173 (reported on 5.5% of returns)
Here:
+$6,173
State:
+$35,319
(% of AGI for various income ranges: 0.3% for AGIs $25k-50k, 2.8% for AGIs $50k-75k, 0.7% for AGIs $75k-100k, 3.7% for AGIs $100k-200k)
Profit/loss from business: +$12,068 (reported on 20.4% of returns)
Here:
+$12,068
State:
+$13,732
(% of AGI for various income ranges: 17.3% for AGIs below $25k, 5.0% for AGIs $25k-50k, 4.1% for AGIs $50k-75k, 2.5% for AGIs $75k-100k, 6.1% for AGIs $100k-200k)
Taxable individual retirement arrangement distribution: $9,991 (reported on 4.0% of returns)
78616:
$9,991
Texas:
$19,511
(% of AGI for various income ranges: 1.1% for AGIs below $25k, 1.0% for AGIs $25k-50k, 0.9% for AGIs $50k-75k, 3.0% for AGIs $75k-100k)
Total itemized deductions: $16,734 (25% of AGI, reported on 13.9% of returns)
Here:
$16,734
State:
$24,724
Here:
24.9% of AGI
State:
15.9% of AGI
(% of AGI for various income ranges: 4.0% for AGIs below $25k, 5.4% for AGIs $25k-50k, 7.1% for AGIs $50k-75k, 6.1% for AGIs $75k-100k, 8.4% for AGIs $100k-200k)
Charity contributions: $3,113 (reported on 8.4% of returns)
Here:
$3,113
State:
$6,808
(% of AGI for various income ranges: 0.2% for AGIs below $25k, 0.5% for AGIs $25k-50k, 0.6% for AGIs $50k-75k, 1.0% for AGIs $75k-100k, 1.2% for AGIs $100k-200k)
Taxes paid: $3,950 (reported on 13.9% of returns)
78616:
$3,950
State:
$6,921
(% of AGI for various income ranges: 0.7% for AGIs below $25k, 1.2% for AGIs $25k-50k, 1.6% for AGIs $50k-75k, 1.8% for AGIs $75k-100k, 2.2% for AGIs $100k-200k)
Earned income credit: $2,596 (reported on 27.4% of returns)
Here:
$2,596
State:
$2,570
(% of AGI for various income ranges: 9.2% for AGIs below $25k, 1.6% for AGIs $25k-50k)
Percentage of individuals using paid preparers for their 2012 taxes: 47.1%
Here:
47%
State:
51%
(% for various income ranges: 45.5% for AGIs below $25k, 50.0% for AGIs $25k-50k, 47.2% for AGIs $50k-75k, 37.5% for AGIs $75k-100k, 53.3% for AGIs $100k-200k)
Averages for the 2004 tax year for zip code 78616, filed in 2005:
Average Adjusted Gross Income (AGI) in 2004: $34,364 (Individual Income Tax Returns)
Here:
$34,364
State:
$47,881
Salary/wage: $33,147 (reported on 85.9% of returns)
Here:
$33,147
State:
$41,947
(% of AGI for various income ranges: 96.9% for AGIs below $10k, 81.8% for AGIs $10k-25k, 87.8% for AGIs $25k-50k, 80.7% for AGIs $50k-75k, 83.1% for AGIs $75k-100k, 70.5% for AGIs over 100k)
Taxable interest for individuals: $704 (reported on 26.3% of returns)
This zip code:
$704
Texas:
$2,255
(% of AGI for various income ranges: 2.4% for AGIs below $10k, 0.8% for AGIs $10k-25k, 0.5% for AGIs $25k-50k, 0.4% for AGIs $50k-75k, 0.3% for AGIs $75k-100k, 0.8% for AGIs over 100k)
Taxable dividends: $1,000 (reported on 8.6% of returns)
Here:
$1,000
State:
$4,261
(% of AGI for various income ranges: 2.4% for AGIs below $10k, 0.4% for AGIs $10k-25k, 0.0% for AGIs $25k-50k, 0.3% for AGIs $50k-75k, 0.2% for AGIs $75k-100k, 0.3% for AGIs over 100k)
Net capital gain/loss: +$2,607 (reported on 9.7% of returns)
Here:
+$2,607
State:
+$16,110
(% of AGI for various income ranges: -0.7% for AGIs below $10k, 0.0% for AGIs $10k-25k, 0.2% for AGIs $25k-50k, 0.3% for AGIs $50k-75k, 3.1% for AGIs $75k-100k, 1.3% for AGIs over 100k)
Profit/loss from business: +$8,667 (reported on 18.6% of returns)
Here:
+$8,667
State:
+$11,013
(% of AGI for various income ranges: 14.1% for AGIs below $10k, 9.7% for AGIs $10k-25k, 5.5% for AGIs $25k-50k, 4.1% for AGIs $50k-75k, 0.4% for AGIs $75k-100k, 1.0% for AGIs over 100k)
IRA payment deduction: $2,000 (reported on 1.3% of returns)
78616:
$2,000
Texas:
$3,120
Total itemized deductions: $13,531 (24% of AGI, reported on 20.3% of returns)
Here:
$13,531
State:
$19,631
Here:
24.0% of AGI
State:
18.9% of AGI
(% of AGI for various income ranges: 5.6% for AGIs below $10k, 6.1% for AGIs $10k-25k, 8.0% for AGIs $25k-50k, 7.7% for AGIs $50k-75k, 9.2% for AGIs $75k-100k, 10.0% for AGIs over 100k)
Charity contributions deductions: $1,944 (3% of AGI, reported on 12.9% of returns)
Here:
$1,944
State:
$4,753
Here:
3.1% of AGI
State:
4.2% of AGI
(% of AGI for various income ranges: 0.3% for AGIs $10k-25k, 0.5% for AGIs $25k-50k, 0.8% for AGIs $50k-75k, 1.2% for AGIs $75k-100k, 1.2% for AGIs over 100k)
Total tax: $4,078 (reported on 71.6% of returns)
78616:
$4,078
State:
$9,058
(% of AGI for various income ranges: 3.0% for AGIs below $10k, 4.4% for AGIs $10k-25k, 6.4% for AGIs $25k-50k, 9.4% for AGIs $50k-75k, 10.6% for AGIs $75k-100k, 17.1% for AGIs over 100k)
Earned income credit: $1,972 (reported on 22.5% of returns)
Here:
$1,972
State:
$2,024
Percentage of individuals using paid preparers for their 2004 taxes: 51.0%
Here:
51%
State:
57%
(% for various income ranges: 46.8% for AGIs below $10k, 55.0% for AGIs $10k-25k, 52.6% for AGIs $25k-50k, 47.4% for AGIs $50k-75k, 44.1% for AGIs $75k-100k, 55.8% for AGIs over 100k)
Likely homosexual households (counted as self-reported same-sex unmarried-partner households)
Lesbian couples: 0.0% of all households
Gay men: 0.1% of all households
Household received Food Stamps/SNAP in the past 12 months: 242 Household did not receive Food Stamps/SNAP in the past 12 months: 2,490
Women who had a birth in the past 12 months: 127 (129 now married, 0 unmarried) Women who did not have a birth in the past 12 months: 1,891 (694 now married, 1,200 unmarried)
Housing units in zip code 78616 with a mortgage: 1,232 (119 second mortgage, 126 both second mortgage and home equity loan) Median monthly owner costs for units with a mortgage: $1,745 Median monthly owner costs for units without a mortgage: $495
Residents with income below the poverty level in 2022:
This zip code:
11.9%
Whole state:
14.0%
Residents with income below 50% of the poverty level in 2022:
This zip code:
9.1%
Whole state:
7.4%
Median number of rooms in houses and condos:
Here:
5.4
State:
6.3
Median number of rooms in apartments:
Here:
5.4
State:
4.0
Notable locations in this zip code not listed on our city pages
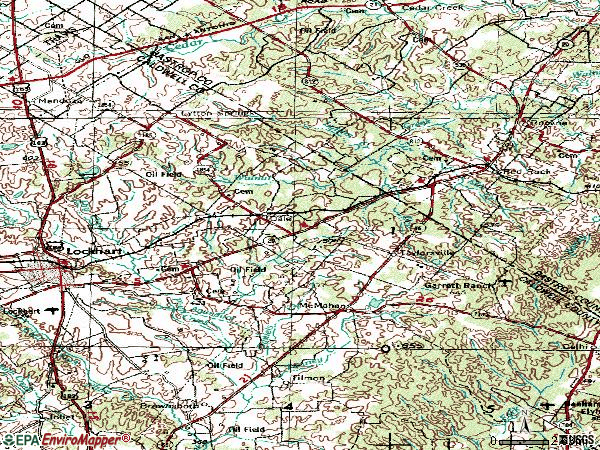
Notable locations in zip code 78616: Saint Marys Community Center (A), Chisholm Trail Fire and Rescue Station 3 (B), McMahan Volunteer Fire Department (C), Chisholm Trail Fire and Rescue Station 2 (D). Display/hide their locations on the map
Churches in zip code 78616 include: Saint Marys Church (A), Tenney Creek Church (B), Zion Church (C), Bethel Church (D). Display/hide their locations on the map
Cemeteries: Bunton Cemetery (1), Dale Cemetery (2), Fleming Memorial Cemetery (3), Lytton Springs Cemetery (4), Jefrey Cemetery (5), Kelly Cemetery (6), Saint John Cemetery (7). Display/hide their locations on the map
Reservoirs: Trigg Lake (A), Site Number Twentyeight (B), Soil Conservation Service Site 28 Reservoir (C), Soil Conservation Service Site 31 Reservoir (D), Soil Conservation Service Site 24 Reservoir (E), Soil Conservation Service Site 29 Reservoir (F). Display/hide their locations on the map
Streams, rivers, and creeks: Lytton Springs Creek (A), Haggai Creek (B), Cat Branch (C), Campbell Creek (D), Brushy Creek (E). Display/hide their locations on the map
Size of family households: 737 2-persons, 294 3-persons, 410 4-persons, 298 5-persons, 213 6-persons, 174 7-or-more-persons
Size of nonfamily households: 407 1-person, 173 2-persons, 12 4-persons
1,472 married couples with children.
792 single-parent households (58 men, 734 women).
52.4% of residents of 78616 zip code speak English at home.
46.0% of residents speak Spanish at home (56% very well, 23% well, 13% not well, 8% not at all).
1.3% of residents speak other Indo-European language at home (100% very well).
Foreign born population: 1,951 (21.5%) (20.5% of them are naturalized citizens)
This zip code:
21.5%
Whole state:
17.2%
83%Honduras
8%Guatemala
3%France
1%United Kingdom, excluding England and Scotland
1%Sweden
1%Australia
0%India
3%Scotch-Irish
3%English
3%American
2%German
1%British
1%Dutch
1%European
Year of entry for the foreign-born population
5692010 or later
9572000 to 2009
3751990 to 1999
337Before 1990
Housing units lacking complete plumbing facilities: 6.4% Housing units lacking complete kitchen facilities: 6.1%
75.3%Electricity
21.4%Bottled, tank, or LP gas
1.4%Utility gas
1.2%No fuel used
0.7%Wood
Population in 1990: 2,666. Population change in the 1990s: +1,703 (+63.9%).
Place of birth for U.S.-born residents:
This state: 5,651
Northeast: 113
Midwest: 291
South: 451
West: 241
55% of the 78616 zip code residents lived in the same house 5 years ago. Out of people who lived in different houses, 16% lived in this county. Out of people who lived in different counties, 50% lived in Texas.
96% of the 78616 zip code residents lived in the same house 1 year ago. Out of people who lived in different houses, 40% moved from this county. Out of people who lived in different houses, 37% moved from different county within same state. Out of people who lived in different houses, 17% moved from different state. Out of people who lived in different houses, 15% moved from abroad.
Private vs. public school enrollment:
Students in private schools in grades 1 to 8 (elementary and middle school): 37
Here:
2.7%
Texas:
8.8%
Students in private schools in grades 9 to 12 (high school): 14
Here:
2.5%
Texas:
8.0%
Students in private undergraduate colleges: 20
Here:
6.1%
Texas:
16.2%
Occupation by median earnings in the past 12 months ($)
78,991Business and financial operations occupations
75,455Transportation occupations
65,818Management occupations
59,931Fire fighting and prevention, and other protective service workers including supervisors
54,924Installation, maintenance, and repair occupations
47,047Arts, design, entertainment, sports, and media occupations
Companies with federal contracts located in this zip code:
HILL COUNTRY AUTOCLAVE, INC (2607 HWY 21 WEST in DALE, TX; small business) : $225,333 in 9 contractsfrom 2002 to 2005
Contracts for Other Housekeeping Services, Operation of Government-Owned Facilities -- Waste Treatment and Storage Facilities by Army, Air Force Signed by year:2000: $0; 2001: $0; 2002: $53,605; 2003: $53,820; 2004: $66,672; 2005: $51,236; 2006: $0.
Biggest contracts:
$56,160 with Army for Other Housekeeping Services. Signed on 2005-10-17. Completion date: 2006-09-30.
$55,872, same as above.Signed on 2004-10-05. Completion date: 2005-09-30.
$53,820, same as above.Signed on 2003-10-02. Completion date: 2004-09-30.
$48,933, same as above.Signed on 2002-12-02. Completion date: 2003-09-30.
Top industries in this zip code by the number of employees in 2005:
Construction: Commercial and Institutional Building Construction (10-19 employees: 1 establishment)
Construction: Flooring Contractors (10-19: 1)
Administrative and Support and Waste Management and Remediation Services: Landscaping Services (10-19: 1)
Construction: Plumbing, Heating, and Air-Conditioning Contractors (5-9: 1, 1-4: 1)
Construction: Painting and Wall Covering Contractors (1-4: 3)
Other Services (except Public Administration): Religious Organizations (1-4: 2)
Construction: Framing Contractors (1-4: 1)
Other Services (except Public Administration): Automotive Glass Replacement Shops (1-4: 1)
People in group quarters in 2000:
48 people in unknown juvenile institutions
Fatal accident statistics in 2014:
Fatal accident count: 2
Vehicles involved in fatal accidents: 2
Fatal accidents caused by drunken drivers: 2
Fatalities: 2
Persons involved in fatal accidents: 4
Pedestrians involved in fatal accidents: 0
Fatal accident statistics in 2012:
Fatal accident count: 1
Vehicles involved in fatal accidents: 2
Fatal accidents caused by drunken drivers: 1
Fatalities: 1
Persons involved in fatal accidents: 2
Pedestrians involved in fatal accidents: 0
Home Mortgage Disclosure Act Aggregated Statistics For Year 2009 (Based on 6 partial tracts)
A) FHA, FSA/RHS & VA Home Purchase Loans
B) Conventional Home Purchase Loans
C) Refinancings
D) Home Improvement Loans
F) Non-occupant Loans on < 5 Family Dwellings (A B C & D)
G) Loans On Manufactured Home Dwelling (A B C & D)
Number
Average Value
Number
Average Value
Number
Average Value
Number
Average Value
Number
Average Value
Number
Average Value
LOANS ORIGINATED
16
$132,712
21
$91,811
35
$137,005
5
$48,424
6
$79,670
25
$87,199
APPLICATIONS APPROVED, NOT ACCEPTED
1
$213,420
4
$88,525
9
$87,180
2
$37,990
0
$0
6
$58,127
APPLICATIONS DENIED
5
$138,372
10
$107,257
25
$130,153
10
$34,014
4
$107,348
19
$75,067
APPLICATIONS WITHDRAWN
5
$146,128
2
$127,530
14
$118,549
2
$8,005
0
$0
3
$56,400
FILES CLOSED FOR INCOMPLETENESS
0
$0
2
$115,060
4
$84,725
2
$58,030
0
$0
3
$102,053
Aggregated Statistics For Year 2008 (Based on 6 partial tracts)
A) FHA, FSA/RHS & VA Home Purchase Loans
B) Conventional Home Purchase Loans
C) Refinancings
D) Home Improvement Loans
F) Non-occupant Loans on < 5 Family Dwellings (A B C & D)
G) Loans On Manufactured Home Dwelling (A B C & D)
Number
Average Value
Number
Average Value
Number
Average Value
Number
Average Value
Number
Average Value
Number
Average Value
LOANS ORIGINATED
14
$127,791
23
$111,758
39
$115,128
9
$28,958
6
$79,288
29
$90,419
APPLICATIONS APPROVED, NOT ACCEPTED
0
$0
13
$99,020
4
$145,678
3
$12,980
1
$123,400
10
$82,071
APPLICATIONS DENIED
3
$70,480
16
$90,544
26
$115,670
27
$52,751
8
$119,244
21
$73,131
APPLICATIONS WITHDRAWN
0
$0
4
$105,565
7
$95,904
3
$94,750
1
$132,730
3
$92,713
FILES CLOSED FOR INCOMPLETENESS
1
$119,560
0
$0
1
$52,690
0
$0
0
$0
1
$119,560
Aggregated Statistics For Year 2007 (Based on 6 partial tracts)
A) FHA, FSA/RHS & VA Home Purchase Loans
B) Conventional Home Purchase Loans
C) Refinancings
D) Home Improvement Loans
F) Non-occupant Loans on < 5 Family Dwellings (A B C & D)
G) Loans On Manufactured Home Dwelling (A B C & D)
Number
Average Value
Number
Average Value
Number
Average Value
Number
Average Value
Number
Average Value
Number
Average Value
LOANS ORIGINATED
11
$112,536
57
$115,793
30
$131,883
8
$26,606
13
$114,572
27
$82,294
APPLICATIONS APPROVED, NOT ACCEPTED
2
$90,710
16
$91,833
7
$114,057
1
$11,340
3
$89,377
14
$66,695
APPLICATIONS DENIED
4
$107,388
35
$79,671
55
$103,197
25
$40,128
8
$79,212
34
$61,316
APPLICATIONS WITHDRAWN
3
$112,293
8
$121,644
23
$118,760
5
$55,172
2
$117,180
2
$78,375
FILES CLOSED FOR INCOMPLETENESS
1
$58,030
5
$118,134
5
$155,944
0
$0
0
$0
1
$58,030
Aggregated Statistics For Year 2006 (Based on 6 partial tracts)
A) FHA, FSA/RHS & VA Home Purchase Loans
B) Conventional Home Purchase Loans
C) Refinancings
D) Home Improvement Loans
F) Non-occupant Loans on < 5 Family Dwellings (A B C & D)
G) Loans On Manufactured Home Dwelling (A B C & D)
Number
Average Value
Number
Average Value
Number
Average Value
Number
Average Value
Number
Average Value
Number
Average Value
LOANS ORIGINATED
19
$128,441
51
$86,316
43
$108,951
5
$76,928
14
$71,479
28
$90,736
APPLICATIONS APPROVED, NOT ACCEPTED
1
$196,760
16
$86,522
6
$157,208
1
$31,800
4
$93,278
9
$50,777
APPLICATIONS DENIED
3
$72,110
31
$74,364
65
$104,693
20
$33,424
7
$54,856
39
$64,044
APPLICATIONS WITHDRAWN
3
$109,193
7
$124,703
40
$106,730
2
$13,105
4
$73,952
2
$87,825
FILES CLOSED FOR INCOMPLETENESS
1
$134,070
0
$0
6
$78,003
0
$0
0
$0
1
$134,070
Aggregated Statistics For Year 2005 (Based on 6 partial tracts)
A) FHA, FSA/RHS & VA Home Purchase Loans
B) Conventional Home Purchase Loans
C) Refinancings
D) Home Improvement Loans
F) Non-occupant Loans on < 5 Family Dwellings (A B C & D)
G) Loans On Manufactured Home Dwelling (A B C & D)
Number
Average Value
Number
Average Value
Number
Average Value
Number
Average Value
Number
Average Value
Number
Average Value
LOANS ORIGINATED
19
$99,247
56
$93,368
54
$114,342
13
$68,809
11
$106,357
38
$72,216
APPLICATIONS APPROVED, NOT ACCEPTED
0
$0
11
$80,390
13
$106,837
1
$37,350
2
$99,385
10
$78,170
APPLICATIONS DENIED
8
$92,492
61
$65,008
71
$107,672
17
$43,589
5
$88,468
60
$60,707
APPLICATIONS WITHDRAWN
1
$66,700
13
$89,686
37
$122,716
11
$202,785
2
$107,720
6
$81,902
FILES CLOSED FOR INCOMPLETENESS
1
$102,050
3
$63,757
13
$120,438
0
$0
1
$90,050
0
$0
Aggregated Statistics For Year 2004 (Based on 6 partial tracts)
A) FHA, FSA/RHS & VA Home Purchase Loans
B) Conventional Home Purchase Loans
C) Refinancings
D) Home Improvement Loans
F) Non-occupant Loans on < 5 Family Dwellings (A B C & D)
G) Loans On Manufactured Home Dwelling (A B C & D)
Number
Average Value
Number
Average Value
Number
Average Value
Number
Average Value
Number
Average Value
Number
Average Value
LOANS ORIGINATED
18
$110,159
53
$87,907
63
$105,881
6
$62,267
9
$77,131
36
$73,322
APPLICATIONS APPROVED, NOT ACCEPTED
1
$111,520
19
$60,918
23
$89,152
3
$17,343
3
$72,257
24
$65,791
APPLICATIONS DENIED
3
$106,943
50
$66,460
111
$94,423
20
$35,007
5
$48,024
63
$58,686
APPLICATIONS WITHDRAWN
1
$76,040
6
$122,995
61
$99,367
2
$22,150
2
$92,695
6
$57,895
FILES CLOSED FOR INCOMPLETENESS
0
$0
1
$103,380
18
$102,726
2
$51,690
1
$90,710
1
$33,350
Aggregated Statistics For Year 2003 (Based on 6 partial tracts)
A) FHA, FSA/RHS & VA Home Purchase Loans
B) Conventional Home Purchase Loans
C) Refinancings
D) Home Improvement Loans
F) Non-occupant Loans on < 5 Family Dwellings (A B C & D)
Detailed PMIC statistics for the following Tracts:9601.00
, 9606.00
2002 - 2018 National Fire Incident Reporting System (NFIRS) incidents
Based on the data from the years 2002 - 2018 the average number of fires per year is 42. The highest number of fires - 101 took place in 2018, and the least - 2 in 2003. The data has a rising trend.
When looking into fire subcategories, the most reports belonged to: Outside Fires (78.5%), and Structure Fires (13.5%).
Fire incident types reported to NFIRS in Zip Code 78616


 Nearest zip codes: 78644, 78662, 78612, 78617, 78953, 78656.


 : $225,333 in 9 contracts from 2002 to 2005


 Based on the data from the years 2002 - 2018 the average number of fires per year is 42. The highest number of fires - 101 took place in 2018, and the least - 2 in 2003. The data has a rising trend.
 When looking into fire subcategories, the most reports belonged to: Outside Fires (78.5%), and Structure Fires (13.5%).