Estimated zip code population in 2022: 2,035 Zip code population in 2010: 2,005 Zip code population in 2000: 1,646
Houses and condos: 960 Renter-occupied apartments: 114
% of renters here:
14%
State:
38%
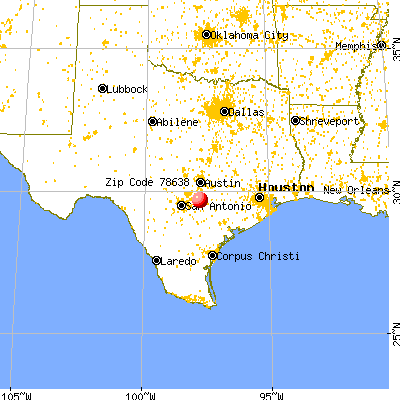
March 2022 cost of living index in zip code 78638: 81.0 (low, U.S. average is 100)
Land area: 114.6 sq. mi. Water area: 0.4 sq. mi.
Population density: 18 people per square mile
(very low).
OSM Map
General Map
Google Map
MSN Map
OSM Map
General Map
Google Map
MSN Map
OSM Map
General Map
Google Map
MSN Map
OSM Map
General Map
Google Map
MSN Map
Please wait while loading the map...
Real estate property taxes paid for housing units in 2022:
This zip code:
0.6% ($1,394)
Texas:
1.5% ($4,050)
Median real estate property taxes paid for housing units with mortgages in 2022: $1,313 (0.5%) Median real estate property taxes paid for housing units with no mortgage in 2022: $1,554 (0.8%)
Business Search- 14 Million verified businesses
Males: 1,069
(52.5%)
Females: 966
(47.5%)
For population 25 years and over in 78638:
High school or higher: 92.8%
Bachelor's degree or higher: 22.6%
Graduate or professional degree: 7.1%
Unemployed: 2.2%
Mean travel time to work (commute): 34.2 minutes
For population 15 years and over in 78638:
Never married: 19.1%
Now married: 62.9%
Separated: 1.5%
Widowed: 6.7%
Divorced: 9.8%
Zip code 78638 compared to state average:
Unemployed percentage below state average.
Black race population percentage significantly below state average.
Median age above state average.
Foreign-born population percentage significantly below state average.
Renting percentage significantly below state average.
Averages for the 2020 tax year for zip code 78638, filed in 2021:
Average Adjusted Gross Income (AGI) in 2020: $71,799 (Individual Income Tax Returns)
Here:
$71,799
State:
$77,054
Salary/wage: $58,965 (reported on 78.7% of returns)
Here:
$58,965
State:
$62,766
(% of AGI for various income ranges: 1021.8% for AGIs below $25k, 3602.4% for AGIs $25k-50k, 5738.3% for AGIs $50k-75k, 10954.0% for AGIs $75k-100k, 15175.5% for AGIs $100k-200k)
Taxable interest for individuals: $784 (reported on 34.3% of returns)
This zip code:
$784
Texas:
$2,665
(% of AGI for various income ranges: 25.0% for AGIs below $25k, 13.6% for AGIs $25k-50k, 19.2% for AGIs $50k-75k, 26.0% for AGIs $75k-100k, 51.8% for AGIs $100k-200k)
Ordinary dividends: $1,759 (reported on 25.0% of returns)
Here:
$1,759
State:
$10,044
(% of AGI for various income ranges: 29.1% for AGIs below $25k, 10.4% for AGIs $25k-50k, 37.5% for AGIs $50k-75k, 84.0% for AGIs $75k-100k, 107.3% for AGIs $100k-200k)
Net capital gain/loss in AGI: +$28,406 (reported on 15.7% of returns)
Here:
+$28,406
State:
+$39,590
(% of AGI for various income ranges: 38.2% for AGIs below $25k, 30.0% for AGIs $25k-50k, 185.0% for AGIs $50k-75k, 815.5% for AGIs $100k-200k)
Profit/loss from business: +$8,521 (reported on 17.6% of returns)
Here:
+$8,521
State:
+$10,888
(% of AGI for various income ranges: 199.5% for AGIs below $25k, 174.0% for AGIs $25k-50k, 455.0% for AGIs $50k-75k, 180.9% for AGIs $100k-200k)
Taxable individual retirement arrangement distribution: $12,962 (reported on 7.4% of returns)
78638:
$12,962
Texas:
$24,740
(% of AGI for various income ranges: 48.2% for AGIs below $25k, 141.6% for AGIs $25k-50k, 1154.0% for AGIs $75k-100k)
Total itemized deductions: $31,725 (reported on 3.7% of returns)
Here:
$31,725
State:
$40,428
(% of AGI for various income ranges: 1153.6% for AGIs $100k-200k)
Charity contributions: $8,133 (reported on 2.8% of returns)
Here:
$8,133
State:
$18,201
(% of AGI for various income ranges: 221.8% for AGIs $100k-200k)
Taxes paid: $6,975 (reported on 3.7% of returns)
78638:
$6,975
State:
$7,821
(% of AGI for various income ranges: 253.6% for AGIs $100k-200k)
Earned income credit: $2,200 (reported on 13.0% of returns)
Here:
$2,200
State:
$2,584
(% of AGI for various income ranges: 71.8% for AGIs below $25k, 60.0% for AGIs $25k-50k)
Percentage of individuals using paid preparers for their 2020 taxes: 91.7%
Here:
92%
State:
92%
(% for various income ranges: 90.6% for AGIs below $25k, 93.5% for AGIs $25k-50k, 93.3% for AGIs $50k-75k, 88.9% for AGIs $75k-100k, 93.8% for AGIs $100k-200k, 80.0% for AGIs over 200k)
Averages for the 2012 tax year for zip code 78638, filed in 2013:
Average Adjusted Gross Income (AGI) in 2012: $61,678 (Individual Income Tax Returns)
Here:
$61,678
State:
$65,384
Salary/wage: $45,551 (reported on 78.3% of returns)
Here:
$45,551
State:
$52,524
(% of AGI for various income ranges: 72.6% for AGIs below $25k, 82.4% for AGIs $25k-50k, 71.9% for AGIs $50k-75k, 78.9% for AGIs $75k-100k, 77.0% for AGIs $100k-200k, 15.5% for AGIs over 200k)
Taxable interest for individuals: $1,179 (reported on 31.5% of returns)
This zip code:
$1,179
Texas:
$2,372
(% of AGI for various income ranges: 0.8% for AGIs below $25k, 0.7% for AGIs $25k-50k, 0.6% for AGIs $50k-75k, 0.3% for AGIs $75k-100k, 0.2% for AGIs $100k-200k, 0.9% for AGIs over 200k)
Ordinary dividends: $5,650 (reported on 15.2% of returns)
Here:
$5,650
State:
$9,721
(% of AGI for various income ranges: 1.6% for AGIs below $25k, 0.2% for AGIs $25k-50k, 0.5% for AGIs $50k-75k, 0.6% for AGIs $75k-100k, 5.6% for AGIs $100k-200k)
Net capital gain/loss in AGI: +$24,715 (reported on 14.1% of returns)
Here:
+$24,715
State:
+$35,319
(% of AGI for various income ranges: 2.8% for AGIs $25k-50k, 0.6% for AGIs $50k-75k, 5.9% for AGIs $100k-200k, 14.2% for AGIs over 200k)
Profit/loss from business: +$11,831 (reported on 17.4% of returns)
Here:
+$11,831
State:
+$13,732
(% of AGI for various income ranges: 9.4% for AGIs below $25k, 3.0% for AGIs $25k-50k, 9.2% for AGIs $50k-75k, 4.9% for AGIs $100k-200k)
Taxable individual retirement arrangement distribution: $8,862 (reported on 8.7% of returns)
78638:
$8,862
Texas:
$19,511
(% of AGI for various income ranges: 3.2% for AGIs below $25k, 4.2% for AGIs $25k-50k, 3.0% for AGIs $75k-100k)
Total itemized deductions: $21,436 (16% of AGI, reported on 15.2% of returns)
Here:
$21,436
State:
$24,724
Here:
16.1% of AGI
State:
15.9% of AGI
(% of AGI for various income ranges: 11.4% for AGIs below $25k, 6.5% for AGIs $50k-75k, 6.8% for AGIs $75k-100k, 13.5% for AGIs $100k-200k)
Charity contributions: $4,820 (reported on 10.9% of returns)
Here:
$4,820
State:
$6,808
Taxes paid: $4,614 (reported on 15.2% of returns)
78638:
$4,614
State:
$6,921
(% of AGI for various income ranges: 1.7% for AGIs below $25k, 1.1% for AGIs $50k-75k, 1.6% for AGIs $75k-100k, 3.3% for AGIs $100k-200k)
Earned income credit: $2,094 (reported on 17.4% of returns)
Here:
$2,094
State:
$2,570
(% of AGI for various income ranges: 6.0% for AGIs below $25k, 1.1% for AGIs $25k-50k)
Percentage of individuals using paid preparers for their 2012 taxes: 51.1%
Here:
51%
State:
51%
(% for various income ranges: 41.2% for AGIs below $25k, 50.0% for AGIs $25k-50k, 53.8% for AGIs $50k-75k, 55.6% for AGIs $75k-100k, 66.7% for AGIs $100k-200k, 100.0% for AGIs over 200k)
Averages for the 2004 tax year for zip code 78638, filed in 2005:
Average Adjusted Gross Income (AGI) in 2004: $37,068 (Individual Income Tax Returns)
Here:
$37,068
State:
$47,881
Salary/wage: $34,788 (reported on 82.0% of returns)
Here:
$34,788
State:
$41,947
(% of AGI for various income ranges: 84.7% for AGIs below $10k, 77.3% for AGIs $10k-25k, 83.1% for AGIs $25k-50k, 86.3% for AGIs $50k-75k, 76.0% for AGIs $75k-100k, 58.3% for AGIs over 100k)
Taxable interest for individuals: $1,470 (reported on 39.8% of returns)
This zip code:
$1,470
Texas:
$2,255
(% of AGI for various income ranges: 10.1% for AGIs below $10k, 2.3% for AGIs $10k-25k, 1.5% for AGIs $25k-50k, 0.5% for AGIs $50k-75k, 1.3% for AGIs $75k-100k, 1.9% for AGIs over 100k)
Taxable dividends: $1,171 (reported on 17.4% of returns)
Here:
$1,171
State:
$4,261
(% of AGI for various income ranges: 3.3% for AGIs below $10k, 1.1% for AGIs $10k-25k, 0.6% for AGIs $25k-50k, 0.1% for AGIs $50k-75k, 0.5% for AGIs $75k-100k, 0.5% for AGIs over 100k)
Net capital gain/loss: +$4,156 (reported on 17.5% of returns)
Here:
+$4,156
State:
+$16,110
(% of AGI for various income ranges: 2.2% for AGIs below $10k, 0.4% for AGIs $10k-25k, 1.6% for AGIs $25k-50k, 0.9% for AGIs $50k-75k, 0.3% for AGIs $75k-100k, 5.7% for AGIs over 100k)
Profit/loss from business: +$6,465 (reported on 19.0% of returns)
Here:
+$6,465
State:
+$11,013
(% of AGI for various income ranges: 22.7% for AGIs below $10k, 4.6% for AGIs $10k-25k, 3.2% for AGIs $25k-50k, 3.6% for AGIs $50k-75k, 4.0% for AGIs $75k-100k)
IRA payment deduction: $3,000 (reported on 1.4% of returns)
78638:
$3,000
Texas:
$3,120
Total itemized deductions: $15,985 (24% of AGI, reported on 16.1% of returns)
Here:
$15,985
State:
$19,631
Here:
24.3% of AGI
State:
18.9% of AGI
(% of AGI for various income ranges: 7.2% for AGIs $10k-25k, 5.1% for AGIs $25k-50k, 7.4% for AGIs $50k-75k, 8.7% for AGIs $75k-100k, 8.1% for AGIs over 100k)
Charity contributions deductions: $2,790 (4% of AGI, reported on 12.5% of returns)
Here:
$2,790
State:
$4,753
Here:
4.0% of AGI
State:
4.2% of AGI
(% of AGI for various income ranges: 0.7% for AGIs $10k-25k, 0.7% for AGIs $25k-50k, 0.6% for AGIs $50k-75k, 1.5% for AGIs $75k-100k, 1.6% for AGIs over 100k)
Total tax: $5,026 (reported on 74.1% of returns)
78638:
$5,026
State:
$9,058
(% of AGI for various income ranges: 4.3% for AGIs below $10k, 4.2% for AGIs $10k-25k, 6.5% for AGIs $25k-50k, 9.2% for AGIs $50k-75k, 11.7% for AGIs $75k-100k, 18.6% for AGIs over 100k)
Earned income credit: $1,680 (reported on 17.9% of returns)
Here:
$1,680
State:
$2,024
Percentage of individuals using paid preparers for their 2004 taxes: 57.3%
Here:
57%
State:
57%
(% for various income ranges: 49.1% for AGIs below $10k, 54.4% for AGIs $10k-25k, 57.8% for AGIs $25k-50k, 66.1% for AGIs $50k-75k, 66.7% for AGIs $75k-100k, 68.4% for AGIs over 100k)
Likely homosexual households (counted as self-reported same-sex unmarried-partner households)
Lesbian couples: 1.7% of all households
Gay men: 0.0% of all households
Household received Food Stamps/SNAP in the past 12 months: 46 Household did not receive Food Stamps/SNAP in the past 12 months: 765
Women who had a birth in the past 12 months: 56 (57 now married, 0 unmarried) Women who did not have a birth in the past 12 months: 265 (143 now married, 120 unmarried)
Housing units in zip code 78638 with a mortgage: 338 (96 second mortgage, 26 both second mortgage and home equity loan) Houses without a mortgage: 3
Median monthly owner costs for units with a mortgage: $1,297 Median monthly owner costs for units without a mortgage: $402
Residents with income below the poverty level in 2022:
This zip code:
11.4%
Whole state:
14.0%
Residents with income below 50% of the poverty level in 2022:
This zip code:
8.8%
Whole state:
7.4%
Median number of rooms in houses and condos:
Here:
4.7
State:
6.3
Median number of rooms in apartments:
Here:
4.1
State:
4.0
Notable locations in this zip code not listed on our city pages
Churches in zip code 78638 include: Sweet Canaan Church (A), York Creek Church (B), Mount Pleasant Church (C), Newbirth Church (D), Kingsbury Baptist Church (E). Display/hide their locations on the map
Cemeteries: Appling Cemetery (1), Nash Creek Cemetery (2), Wade Cemetery (3), Happle Cemetery (4), Marines Cemetery (5), Jechow Cemetery (6), Kingsbury Cemetery (7). Display/hide their locations on the map
Reservoirs: Baker Lake (A), Carter Lake (B), Soil Conservation Service Site 16 Reservoir (C), Soil Conservation Service Site 9 Reservoir (D), Soil Conservation Service Site 12 Reservoir (E). Display/hide their locations on the map
Creeks: Nash Creek (A), York Creek (B), Long Creek (C), Cottonwood Creek (D), Deer Creek (E), Darst Creek (F), Brushy Creek (G), Dickerson Creek (H). Display/hide their locations on the map
Size of family households: 263 2-persons, 82 3-persons, 55 4-persons, 28 5-persons, 75 6-persons, 19 7-or-more-persons
Size of nonfamily households: 266 1-person, 25 2-persons
384 married couples with children.
30 single-parent households (14 men, 16 women).
80.5% of residents of 78638 zip code speak English at home.
15.1% of residents speak Spanish at home (95% very well, 3% well, 2% not well).
4.5% of residents speak other Indo-European language at home (8% very well, 92% not well).
Foreign born population: 23 (1.1%) (9.6% of them are naturalized citizens)
This zip code:
1.1%
Whole state:
17.2%
87%Honduras
9%Barbados
13%German
11%English
6%Irish
5%American
1%European
1%Eastern European
1%Scotch-Irish
Year of entry for the foreign-born population
02010 or later
202000 to 2009
01990 to 1999
1Before 1990
Housing units lacking complete plumbing facilities: 5.5% Housing units lacking complete kitchen facilities: 11.4%
81.2%Electricity
12.2%Bottled, tank, or LP gas
6.8%Wood
Population in 1990: 1,073. Population change in the 1990s: +573 (+53.4%).
Place of birth for U.S.-born residents:
This state: 1,553
Northeast: 60
Midwest: 46
South: 242
West: 96
67% of the 78638 zip code residents lived in the same house 5 years ago. Out of people who lived in different houses, 37% lived in this county. Out of people who lived in different counties, 50% lived in Texas.
92% of the 78638 zip code residents lived in the same house 1 year ago. Out of people who lived in different houses, 82% moved from this county. Out of people who lived in different houses, 11% moved from different county within same state. Out of people who lived in different houses, 2% moved from different state.
Private vs. public school enrollment:
Students in private schools in grades 1 to 8 (elementary and middle school): 4
Here:
3.8%
Texas:
8.8%
Students in private schools in grades 9 to 12 (high school):
Here:
0.0%
Texas:
8.0%
Students in private undergraduate colleges:
Here:
0.0%
Texas:
16.2%
Occupation by median earnings in the past 12 months ($)
103,964Business and financial operations occupations
78,940Construction and extraction occupations
76,388Fire fighting and prevention, and other protective service workers including supervisors
60,593Health diagnosing and treating practitioners and other technical occupations
57,737Education, training, and library occupations
56,375Material moving occupations
Top industries in this zip code by the number of employees in 2005:
Construction: Site Preparation Contractors (20-49 employees: 1 establishment)
Wholesale Trade: Meat and Meat Product Merchant Wholesalers (10-19: 1)
Accommodation and Food Services: Full-Service Restaurants (5-9: 1)
Other Services (except Public Administration): Religious Organizations (1-4: 2)
Construction: Structural Steel and Precast Concrete Contractors (1-4: 2)
Professional, Scientific, and Technical Services: Engineering Services (1-4: 1)
Administrative and Support and Waste Management and Remediation Services: Remediation Services (1-4: 1)
Construction: Roofing Contractors (1-4: 1)
Construction: New Single-Family Housing Construction (except Operative Builders) (1-4: 1)
People in group quarters in 2000:
33 people in other noninstitutional group quarters
Fatal accident statistics in 2014:
Fatal accident count: 1
Vehicles involved in fatal accidents: 1
Fatal accidents caused by drunken drivers: 0
Fatalities: 1
Persons involved in fatal accidents: 1
Pedestrians involved in fatal accidents: 0
Fatal accident statistics in 2012:
Fatal accident count: 2
Vehicles involved in fatal accidents: 4
Fatal accidents caused by drunken drivers: 0
Fatalities: 3
Persons involved in fatal accidents: 6
Pedestrians involved in fatal accidents: 0
Home Mortgage Disclosure Act Aggregated Statistics For Year 2009 (Based on 4 partial tracts)
A) FHA, FSA/RHS & VA Home Purchase Loans
B) Conventional Home Purchase Loans
C) Refinancings
D) Home Improvement Loans
F) Non-occupant Loans on < 5 Family Dwellings (A B C & D)
G) Loans On Manufactured Home Dwelling (A B C & D)
Number
Average Value
Number
Average Value
Number
Average Value
Number
Average Value
Number
Average Value
Number
Average Value
LOANS ORIGINATED
14
$103,996
20
$121,342
49
$160,600
11
$40,646
6
$170,982
16
$75,876
APPLICATIONS APPROVED, NOT ACCEPTED
3
$89,767
9
$83,354
18
$141,078
1
$21,120
1
$62,160
8
$73,209
APPLICATIONS DENIED
2
$128,435
8
$61,819
35
$135,516
13
$31,186
0
$0
10
$54,156
APPLICATIONS WITHDRAWN
1
$169,620
3
$113,637
15
$159,821
1
$60,640
1
$100,710
0
$0
FILES CLOSED FOR INCOMPLETENESS
0
$0
0
$0
3
$120,827
1
$31,140
0
$0
0
$0
Aggregated Statistics For Year 2008 (Based on 4 partial tracts)
A) FHA, FSA/RHS & VA Home Purchase Loans
B) Conventional Home Purchase Loans
C) Refinancings
D) Home Improvement Loans
F) Non-occupant Loans on < 5 Family Dwellings (A B C & D)
G) Loans On Manufactured Home Dwelling (A B C & D)
Number
Average Value
Number
Average Value
Number
Average Value
Number
Average Value
Number
Average Value
Number
Average Value
LOANS ORIGINATED
19
$109,434
33
$126,143
39
$131,494
25
$46,358
6
$103,782
23
$54,505
APPLICATIONS APPROVED, NOT ACCEPTED
2
$93,440
10
$113,677
12
$99,590
1
$32,270
3
$163,340
11
$60,242
APPLICATIONS DENIED
6
$107,347
25
$102,858
66
$97,058
37
$44,393
5
$83,896
25
$54,658
APPLICATIONS WITHDRAWN
2
$140,805
3
$92,043
19
$128,457
4
$26,058
1
$91,150
2
$105,925
FILES CLOSED FOR INCOMPLETENESS
0
$0
1
$216,940
3
$98,430
2
$12,975
1
$15,570
1
$10,380
Aggregated Statistics For Year 2007 (Based on 4 partial tracts)
A) FHA, FSA/RHS & VA Home Purchase Loans
B) Conventional Home Purchase Loans
C) Refinancings
D) Home Improvement Loans
F) Non-occupant Loans on < 5 Family Dwellings (A B C & D)
G) Loans On Manufactured Home Dwelling (A B C & D)
Number
Average Value
Number
Average Value
Number
Average Value
Number
Average Value
Number
Average Value
Number
Average Value
LOANS ORIGINATED
14
$104,333
60
$133,798
50
$117,065
24
$35,391
17
$219,858
28
$67,964
APPLICATIONS APPROVED, NOT ACCEPTED
1
$175,020
20
$81,272
12
$89,126
7
$29,346
0
$0
18
$72,043
APPLICATIONS DENIED
2
$60,840
31
$62,830
69
$90,709
47
$50,380
7
$110,090
40
$51,651
APPLICATIONS WITHDRAWN
2
$87,510
5
$124,508
38
$114,894
8
$62,112
1
$357,580
4
$79,645
FILES CLOSED FOR INCOMPLETENESS
1
$61,860
0
$0
7
$97,677
1
$745,460
0
$0
0
$0
Aggregated Statistics For Year 2006 (Based on 4 partial tracts)
A) FHA, FSA/RHS & VA Home Purchase Loans
B) Conventional Home Purchase Loans
C) Refinancings
D) Home Improvement Loans
F) Non-occupant Loans on < 5 Family Dwellings (A B C & D)
G) Loans On Manufactured Home Dwelling (A B C & D)
Number
Average Value
Number
Average Value
Number
Average Value
Number
Average Value
Number
Average Value
Number
Average Value
LOANS ORIGINATED
20
$115,397
74
$138,371
59
$99,817
16
$56,523
20
$248,576
37
$75,684
APPLICATIONS APPROVED, NOT ACCEPTED
0
$0
21
$101,181
7
$101,603
5
$30,658
2
$98,235
14
$49,134
APPLICATIONS DENIED
3
$61,353
50
$78,537
72
$93,144
36
$37,330
13
$72,982
51
$55,021
APPLICATIONS WITHDRAWN
1
$74,310
17
$92,756
48
$104,374
10
$41,663
3
$61,567
5
$78,864
FILES CLOSED FOR INCOMPLETENESS
0
$0
6
$126,938
10
$95,151
0
$0
0
$0
0
$0
Aggregated Statistics For Year 2005 (Based on 4 partial tracts)
A) FHA, FSA/RHS & VA Home Purchase Loans
B) Conventional Home Purchase Loans
C) Refinancings
D) Home Improvement Loans
F) Non-occupant Loans on < 5 Family Dwellings (A B C & D)
G) Loans On Manufactured Home Dwelling (A B C & D)
Number
Average Value
Number
Average Value
Number
Average Value
Number
Average Value
Number
Average Value
Number
Average Value
LOANS ORIGINATED
18
$97,407
62
$75,694
50
$119,444
23
$51,382
11
$86,758
37
$69,840
APPLICATIONS APPROVED, NOT ACCEPTED
1
$59,600
45
$56,242
19
$83,044
4
$27,338
1
$75,820
34
$47,295
APPLICATIONS DENIED
3
$63,937
45
$51,642
102
$81,381
36
$37,813
2
$103,225
52
$50,561
APPLICATIONS WITHDRAWN
0
$0
9
$88,891
59
$100,063
10
$125,772
6
$59,760
5
$51,062
FILES CLOSED FOR INCOMPLETENESS
1
$104,110
5
$73,090
13
$105,287
1
$949,380
1
$46,400
0
$0
Aggregated Statistics For Year 2004 (Based on 4 partial tracts)
A) FHA, FSA/RHS & VA Home Purchase Loans
B) Conventional Home Purchase Loans
C) Refinancings
D) Home Improvement Loans
F) Non-occupant Loans on < 5 Family Dwellings (A B C & D)
G) Loans On Manufactured Home Dwelling (A B C & D)
Number
Average Value
Number
Average Value
Number
Average Value
Number
Average Value
Number
Average Value
Number
Average Value
LOANS ORIGINATED
10
$104,201
72
$90,709
84
$101,491
18
$38,111
7
$60,724
35
$60,906
APPLICATIONS APPROVED, NOT ACCEPTED
1
$73,700
24
$50,839
22
$98,796
6
$21,130
3
$60,213
22
$43,902
APPLICATIONS DENIED
5
$140,642
70
$45,046
99
$75,227
41
$21,355
8
$71,081
83
$42,895
APPLICATIONS WITHDRAWN
0
$0
6
$70,918
62
$89,276
5
$43,926
1
$138,120
8
$72,376
FILES CLOSED FOR INCOMPLETENESS
0
$0
1
$51,680
22
$107,567
0
$0
1
$86,000
0
$0
Aggregated Statistics For Year 2003 (Based on 4 partial tracts)
A) FHA, FSA/RHS & VA Home Purchase Loans
B) Conventional Home Purchase Loans
C) Refinancings
D) Home Improvement Loans
F) Non-occupant Loans on < 5 Family Dwellings (A B C & D)
Number
Average Value
Number
Average Value
Number
Average Value
Number
Average Value
Number
Average Value
LOANS ORIGINATED
18
$98,831
65
$81,167
140
$101,754
20
$29,254
12
$74,534
APPLICATIONS APPROVED, NOT ACCEPTED
1
$139,090
15
$70,281
28
$85,664
1
$3,110
1
$66,040
APPLICATIONS DENIED
4
$73,950
74
$46,330
111
$77,070
18
$24,013
8
$99,388
APPLICATIONS WITHDRAWN
3
$101,770
6
$115,933
75
$84,689
0
$0
0
$0
FILES CLOSED FOR INCOMPLETENESS
0
$0
4
$83,660
2
$84,755
1
$59,170
0
$0
Aggregated Statistics For Year 2002 (Based on 2 partial tracts)
A) FHA, FSA/RHS & VA Home Purchase Loans
B) Conventional Home Purchase Loans
C) Refinancings
D) Home Improvement Loans
F) Non-occupant Loans on < 5 Family Dwellings (A B C & D)
Number
Average Value
Number
Average Value
Number
Average Value
Number
Average Value
Number
Average Value
LOANS ORIGINATED
15
$104,631
35
$87,192
70
$100,093
17
$26,622
5
$61,864
APPLICATIONS APPROVED, NOT ACCEPTED
0
$0
9
$80,733
11
$137,865
4
$15,830
1
$80,960
APPLICATIONS DENIED
2
$108,990
52
$58,847
44
$60,275
22
$17,788
4
$88,490
APPLICATIONS WITHDRAWN
2
$98,090
4
$94,198
28
$82,855
4
$31,140
1
$33,220
FILES CLOSED FOR INCOMPLETENESS
0
$0
2
$59,165
5
$67,470
0
$0
0
$0
Aggregated Statistics For Year 2001 (Based on 2 partial tracts)
A) FHA, FSA/RHS & VA Home Purchase Loans
B) Conventional Home Purchase Loans
C) Refinancings
D) Home Improvement Loans
F) Non-occupant Loans on < 5 Family Dwellings (A B C & D)
Number
Average Value
Number
Average Value
Number
Average Value
Number
Average Value
Number
Average Value
LOANS ORIGINATED
12
$100,513
61
$80,760
53
$86,330
19
$16,826
9
$104,722
APPLICATIONS APPROVED, NOT ACCEPTED
1
$82,000
29
$56,696
4
$68,248
2
$6,230
2
$56,050
APPLICATIONS DENIED
1
$114,180
153
$44,424
34
$98,824
21
$15,620
7
$44,783
APPLICATIONS WITHDRAWN
3
$102,763
5
$46,088
27
$73,506
2
$20,760
3
$91,690
FILES CLOSED FOR INCOMPLETENESS
0
$0
2
$31,660
4
$53,975
0
$0
0
$0
Aggregated Statistics For Year 2000 (Based on 2 partial tracts)
A) FHA, FSA/RHS & VA Home Purchase Loans
B) Conventional Home Purchase Loans
C) Refinancings
D) Home Improvement Loans
E) Loans on Dwellings For 5+ Families
F) Non-occupant Loans on < 5 Family Dwellings (A B C & D)
Number
Average Value
Number
Average Value
Number
Average Value
Number
Average Value
Number
Average Value
Number
Average Value
LOANS ORIGINATED
28
$86,895
84
$64,047
22
$77,190
16
$10,639
1
$6,435,600
8
$42,558
APPLICATIONS APPROVED, NOT ACCEPTED
6
$51,208
29
$63,748
11
$71,811
6
$12,975
0
$0
0
$0
APPLICATIONS DENIED
5
$49,616
127
$43,710
18
$82,694
25
$14,740
0
$0
7
$54,421
APPLICATIONS WITHDRAWN
15
$87,192
8
$100,168
4
$77,850
1
$48,790
0
$0
2
$39,965
FILES CLOSED FOR INCOMPLETENESS
1
$96,530
2
$64,355
3
$67,470
1
$23,870
0
$0
0
$0
Aggregated Statistics For Year 1999 (Based on 2 partial tracts)
A) FHA, FSA/RHS & VA Home Purchase Loans
B) Conventional Home Purchase Loans
C) Refinancings
D) Home Improvement Loans
F) Non-occupant Loans on < 5 Family Dwellings (A B C & D)
Detailed PMIC statistics for the following Tracts:2105.01
, 2109.01
2002 - 2018 National Fire Incident Reporting System (NFIRS) incidents
According to the data from the years 2002 - 2018 the average number of fire incidents per year is 11. The highest number of fires - 24 took place in 2014, and the least - 1 in 2007. The data has a growing trend.
When looking into fire subcategories, the most reports belonged to: Outside Fires (68.8%), and Structure Fires (20.6%).
Fire incident types reported to NFIRS in Zip Code 78638


 Nearest zip codes: 78661, 78622, 78670, 78648, 78655, 78155.


 According to the data from the years 2002 - 2018 the average number of fire incidents per year is 11. The highest number of fires - 24 took place in 2014, and the least - 1 in 2007. The data has a growing trend.
 When looking into fire subcategories, the most reports belonged to: Outside Fires (68.8%), and Structure Fires (20.6%).