Estimated zip code population in 2022: 2,882 Zip code population in 2010: 1,599 Zip code population in 2000: 1,050
Houses and condos: 1,102 Renter-occupied apartments: 74
% of renters here:
8%
State:
38%
March 2022 cost of living index in zip code 78650: 78.6 (low, U.S. average is 100)
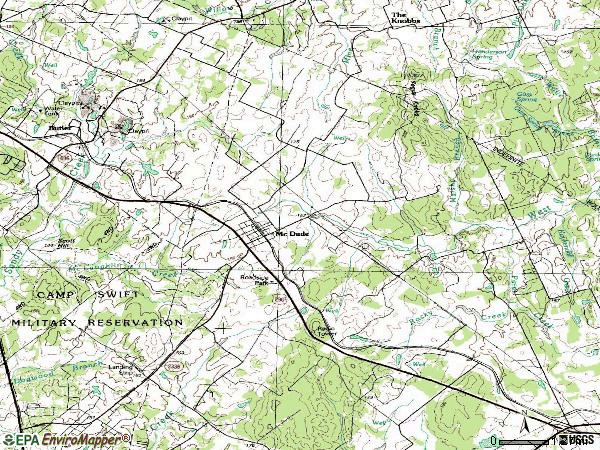
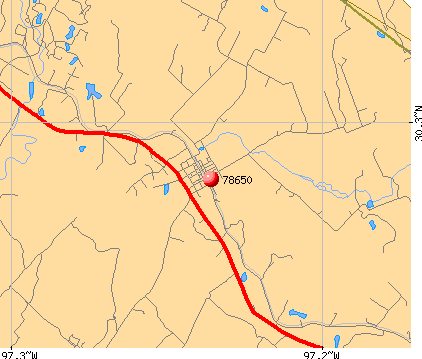
Land area: 66.6 sq. mi. Water area: 0.2 sq. mi.
Population density: 43 people per square mile
(very low).
OSM Map
General Map
Google Map
MSN Map
OSM Map
General Map
Google Map
MSN Map
OSM Map
General Map
Google Map
MSN Map
OSM Map
General Map
Google Map
MSN Map
Please wait while loading the map...
Real estate property taxes paid for housing units in 2022:
This zip code:
1.3% ($3,229)
Texas:
1.5% ($4,050)
Median real estate property taxes paid for housing units with mortgages in 2022: $2,733 (1.0%) Median real estate property taxes paid for housing units with no mortgage in 2022: $3,706 (1.4%)
Business Search- 14 Million verified businesses
Males: 1,380
(47.9%)
Females: 1,502
(52.1%)
For population 25 years and over in 78650:
High school or higher: 89.4%
Bachelor's degree or higher: 15.8%
Graduate or professional degree: 7.6%
Unemployed: 8.1%
Mean travel time to work (commute): 41.1 minutes
For population 15 years and over in 78650:
Never married: 21.1%
Now married: 58.4%
Separated: 0.8%
Widowed: 5.5%
Divorced: 14.1%
Zip code 78650 compared to state average:
Unemployed percentage above state average.
Black race population percentage significantly below state average.
Median age above state average.
Foreign-born population percentage significantly below state average.
Renting percentage significantly below state average.
Length of stay since moving in significantly above state average.
Number of college students significantly below state average.
Percentage of population with a bachelor's degree or higher below state average.
Estimated median house/condo value in 2022: $258,274
78650:
$258,274
Texas:
$275,400
According to our research of Texas and other state lists, there were 3 registered sex offenders living in 78650 zip code as of May 28, 2024. The ratio of all residents to sex offenders in zip code 78650 is 584 to 1. The ratio of registered sex offenders to all residents in this zip code is lower than the state average.
Median resident age:
This zip code:
40.9 years
Texas median age:
35.6 years
Average household size:
This zip code:
3.2 people
Texas:
2.6 people
Averages for the 2020 tax year for zip code 78650, filed in 2021:
Average Adjusted Gross Income (AGI) in 2020: $68,389 (Individual Income Tax Returns)
Here:
$68,389
State:
$77,054
Salary/wage: $59,788 (reported on 72.2% of returns)
Here:
$59,788
State:
$62,766
(% of AGI for various income ranges: 1081.9% for AGIs below $25k, 3544.4% for AGIs $25k-50k, 5658.9% for AGIs $50k-75k, 11690.0% for AGIs $75k-100k, 11610.0% for AGIs $100k-200k)
Taxable interest for individuals: $2,438 (reported on 30.4% of returns)
This zip code:
$2,438
Texas:
$2,665
(% of AGI for various income ranges: 10.0% for AGIs below $25k, 15.6% for AGIs $25k-50k, 23.3% for AGIs $50k-75k, 76.7% for AGIs $75k-100k, 142.2% for AGIs $100k-200k)
Ordinary dividends: $4,217 (reported on 15.2% of returns)
Here:
$4,217
State:
$10,044
(% of AGI for various income ranges: 28.1% for AGIs below $25k, 41.1% for AGIs $50k-75k, 242.2% for AGIs $100k-200k)
Net capital gain/loss in AGI: +$17,750 (reported on 15.2% of returns)
Here:
+$17,750
State:
+$39,590
(% of AGI for various income ranges: 30.6% for AGIs below $25k, 248.9% for AGIs $50k-75k, 183.3% for AGIs $100k-200k)
Profit/loss from business: +$10,428 (reported on 22.8% of returns)
Here:
+$10,428
State:
+$10,888
(% of AGI for various income ranges: 323.1% for AGIs below $25k, 383.9% for AGIs $25k-50k, 833.3% for AGIs $50k-75k)
Taxable individual retirement arrangement distribution: $18,440 (reported on 6.3% of returns)
78650:
$18,440
Texas:
$24,740
(% of AGI for various income ranges: 198.9% for AGIs $25k-50k, 626.7% for AGIs $100k-200k)
Total itemized deductions: $37,375 (reported on 5.1% of returns)
Here:
$37,375
State:
$40,428
(% of AGI for various income ranges: 1661.1% for AGIs $100k-200k)
Charity contributions: $17,000 (reported on 2.5% of returns)
Here:
$17,000
State:
$18,201
(% of AGI for various income ranges: 188.9% for AGIs $25k-50k)
Taxes paid: $6,933 (reported on 3.8% of returns)
78650:
$6,933
State:
$7,821
(% of AGI for various income ranges: 231.1% for AGIs $100k-200k)
Earned income credit: $2,408 (reported on 16.5% of returns)
Here:
$2,408
State:
$2,584
(% of AGI for various income ranges: 113.8% for AGIs below $25k, 72.8% for AGIs $25k-50k)
Percentage of individuals using paid preparers for their 2020 taxes: 89.9%
Here:
90%
State:
92%
(% for various income ranges: 87.0% for AGIs below $25k, 87.0% for AGIs $25k-50k, 91.7% for AGIs $50k-75k, 100.0% for AGIs $75k-100k, 90.9% for AGIs $100k-200k, 100.0% for AGIs over 200k)
Averages for the 2012 tax year for zip code 78650, filed in 2013:
Average Adjusted Gross Income (AGI) in 2012: $49,171 (Individual Income Tax Returns)
Here:
$49,171
State:
$65,384
Salary/wage: $42,113 (reported on 81.5% of returns)
Here:
$42,113
State:
$52,524
(% of AGI for various income ranges: 66.9% for AGIs below $25k, 77.2% for AGIs $25k-50k, 80.2% for AGIs $50k-75k, 81.4% for AGIs $75k-100k, 55.4% for AGIs $100k-200k)
Taxable interest for individuals: $786 (reported on 33.8% of returns)
This zip code:
$786
Texas:
$2,372
(% of AGI for various income ranges: 0.7% for AGIs below $25k, 1.0% for AGIs $25k-50k, 0.1% for AGIs $50k-75k, 0.1% for AGIs $75k-100k, 0.6% for AGIs $100k-200k)
Ordinary dividends: $1,980 (reported on 15.4% of returns)
Here:
$1,980
State:
$9,721
(% of AGI for various income ranges: 0.8% for AGIs $25k-50k, 0.5% for AGIs $50k-75k, 1.1% for AGIs $100k-200k)
Net capital gain/loss in AGI: +$5,950 (reported on 12.3% of returns)
Here:
+$5,950
State:
+$35,319
(% of AGI for various income ranges: 1.7% for AGIs below $25k, 3.8% for AGIs $100k-200k)
Profit/loss from business: +$11,038 (reported on 20.0% of returns)
Here:
+$11,038
State:
+$13,732
(% of AGI for various income ranges: 14.0% for AGIs below $25k, 6.2% for AGIs $25k-50k, 10.8% for AGIs $75k-100k)
Taxable individual retirement arrangement distribution: $14,040 (reported on 7.7% of returns)
78650:
$14,040
Texas:
$19,511
Total itemized deductions: $19,542 (22% of AGI, reported on 18.5% of returns)
Here:
$19,542
State:
$24,724
Here:
22.2% of AGI
State:
15.9% of AGI
(% of AGI for various income ranges: 10.6% for AGIs $25k-50k, 6.3% for AGIs $50k-75k, 8.1% for AGIs $75k-100k, 7.7% for AGIs $100k-200k)
Charity contributions: $4,133 (reported on 13.8% of returns)
Here:
$4,133
State:
$6,808
(% of AGI for various income ranges: 1.1% for AGIs $25k-50k, 1.5% for AGIs $50k-75k, 1.9% for AGIs $100k-200k)
Taxes paid: $4,950 (reported on 18.5% of returns)
78650:
$4,950
State:
$6,921
(% of AGI for various income ranges: 2.2% for AGIs $25k-50k, 1.4% for AGIs $50k-75k, 2.5% for AGIs $75k-100k, 2.1% for AGIs $100k-200k)
Earned income credit: $2,308 (reported on 20.0% of returns)
Here:
$2,308
State:
$2,570
(% of AGI for various income ranges: 6.9% for AGIs below $25k, 1.2% for AGIs $25k-50k)
Percentage of individuals using paid preparers for their 2012 taxes: 50.8%
Here:
51%
State:
51%
(% for various income ranges: 44.0% for AGIs below $25k, 55.6% for AGIs $25k-50k, 44.4% for AGIs $50k-75k, 50.0% for AGIs $75k-100k, 71.4% for AGIs $100k-200k)
Averages for the 2004 tax year for zip code 78650, filed in 2005:
Average Adjusted Gross Income (AGI) in 2004: $40,312 (Individual Income Tax Returns)
Here:
$40,312
State:
$47,881
Salary/wage: $40,599 (reported on 82.4% of returns)
Here:
$40,599
State:
$41,947
(% of AGI for various income ranges: 133.9% for AGIs below $10k, 75.1% for AGIs $10k-25k, 88.1% for AGIs $25k-50k, 84.6% for AGIs $50k-75k, 90.4% for AGIs $75k-100k, 71.9% for AGIs over 100k)
Taxable interest for individuals: $1,227 (reported on 41.1% of returns)
This zip code:
$1,227
Texas:
$2,255
(% of AGI for various income ranges: 11.0% for AGIs below $10k, 2.5% for AGIs $10k-25k, 0.4% for AGIs $25k-50k, 0.8% for AGIs $50k-75k, 0.5% for AGIs $75k-100k, 2.0% for AGIs over 100k)
Taxable dividends: $692 (reported on 16.9% of returns)
Here:
$692
State:
$4,261
(% of AGI for various income ranges: 0.9% for AGIs below $10k, 0.3% for AGIs $10k-25k, 0.4% for AGIs $25k-50k, 0.2% for AGIs $50k-75k, 0.1% for AGIs $75k-100k, 0.4% for AGIs over 100k)
Net capital gain/loss: +$2,217 (reported on 16.8% of returns)
Here:
+$2,217
State:
+$16,110
(% of AGI for various income ranges: 1.2% for AGIs below $10k, -0.7% for AGIs $10k-25k, 0.6% for AGIs $25k-50k, 0.5% for AGIs $50k-75k, -0.1% for AGIs $75k-100k, 3.2% for AGIs over 100k)
Profit/loss from business: +$5,602 (reported on 18.7% of returns)
Here:
+$5,602
State:
+$11,013
(% of AGI for various income ranges: 20.3% for AGIs below $10k, 5.4% for AGIs $10k-25k, 1.5% for AGIs $25k-50k, 2.1% for AGIs $50k-75k, 5.4% for AGIs $75k-100k)
IRA payment deduction: $2,600 (reported on 1.6% of returns)
78650:
$2,600
Texas:
$3,120
Total itemized deductions: $16,244 (21% of AGI, reported on 20.1% of returns)
Here:
$16,244
State:
$19,631
Here:
21.3% of AGI
State:
18.9% of AGI
(% of AGI for various income ranges: 7.3% for AGIs $10k-25k, 7.3% for AGIs $25k-50k, 7.4% for AGIs $50k-75k, 8.7% for AGIs $75k-100k, 10.1% for AGIs over 100k)
Charity contributions deductions: $2,439 (3% of AGI, reported on 15.5% of returns)
Here:
$2,439
State:
$4,753
Here:
3.0% of AGI
State:
4.2% of AGI
(% of AGI for various income ranges: 0.5% for AGIs $10k-25k, 0.7% for AGIs $25k-50k, 0.8% for AGIs $50k-75k, 1.2% for AGIs $75k-100k, 1.5% for AGIs over 100k)
Total tax: $5,685 (reported on 72.8% of returns)
78650:
$5,685
State:
$9,058
(% of AGI for various income ranges: 6.1% for AGIs below $10k, 3.6% for AGIs $10k-25k, 6.6% for AGIs $25k-50k, 9.1% for AGIs $50k-75k, 11.7% for AGIs $75k-100k, 18.2% for AGIs over 100k)
Earned income credit: $1,698 (reported on 18.4% of returns)
Here:
$1,698
State:
$2,024
Percentage of individuals using paid preparers for their 2004 taxes: 56.6%
Here:
57%
State:
57%
(% for various income ranges: 51.8% for AGIs below $10k, 57.8% for AGIs $10k-25k, 55.9% for AGIs $25k-50k, 54.2% for AGIs $50k-75k, 54.3% for AGIs $75k-100k, 78.4% for AGIs over 100k)
Likely homosexual households (counted as self-reported same-sex unmarried-partner households)
Lesbian couples: 0.3% of all households
Gay men: 0.0% of all households
Household received Food Stamps/SNAP in the past 12 months: 93 Household did not receive Food Stamps/SNAP in the past 12 months: 813
Women who had a birth in the past 12 months: 21 (14 now married, 6 unmarried) Women who did not have a birth in the past 12 months: 382 (189 now married, 191 unmarried)
Housing units in zip code 78650 with a mortgage: 279 (3 second mortgage, 4 both second mortgage and home equity loan) Median monthly owner costs for units with a mortgage: $1,213 Median monthly owner costs for units without a mortgage: $685
Residents with income below the poverty level in 2022:
This zip code:
15.1%
Whole state:
14.0%
Residents with income below 50% of the poverty level in 2022:
This zip code:
12.1%
Whole state:
7.4%
Median number of rooms in houses and condos:
Here:
5.1
State:
6.3
Median number of rooms in apartments:
Here:
3.9
State:
4.0
Notable locations in this zip code not listed on our city pages
Notable locations in zip code 78650: The Knobbs (A), Roanoke Public Library (B), McDade Volunteer Fire Department (C). Display/hide their locations on the map
Cemeteries: New Knobbs Springs Cemetery (1), Old Knobbs Springs Cemetery (2), Dube Cemetery (3), Sanders Cemetery (4). Display/hide their locations on the map
Size of family households: 273 2-persons, 209 3-persons, 86 4-persons, 39 5-persons, 50 6-persons, 8 7-or-more-persons
Size of nonfamily households: 221 1-person, 17 2-persons
249 married couples with children.
116 single-parent households (26 men, 90 women).
82.6% of residents of 78650 zip code speak English at home.
16.7% of residents speak Spanish at home (78% very well, 11% well, 11% not well).
0.3% of residents speak other Indo-European language at home (100% very well).
Foreign born population: 122 (4.2%) (36.0% of them are naturalized citizens)
This zip code:
4.2%
Whole state:
17.2%
63%Honduras
18%Chile
7%Guyana
6%France
1%Laos
20%German
8%English
7%American
4%Irish
2%Welsh
1%French
1%Czech
Year of entry for the foreign-born population
02010 or later
232000 to 2009
621990 to 1999
36Before 1990
Housing units lacking complete plumbing facilities: 8.6% Housing units lacking complete kitchen facilities: 10.8%
86.6%Electricity
9.0%Bottled, tank, or LP gas
2.7%Solar energy
1.0%Utility gas
0.9%Wood
Population in 1990: 721. Population change in the 1990s: +329 (+45.6%).
Place of birth for U.S.-born residents:
This state: 2,074
Northeast: 110
Midwest: 211
South: 225
West: 114
59% of the 78650 zip code residents lived in the same house 5 years ago. Out of people who lived in different houses, 47% lived in this county. Out of people who lived in different counties, 50% lived in Texas.
83% of the 78650 zip code residents lived in the same house 1 year ago. Out of people who lived in different houses, 26% moved from this county. Out of people who lived in different houses, 34% moved from different county within same state. Out of people who lived in different houses, 43% moved from different state.
Private vs. public school enrollment:
Students in private schools in grades 1 to 8 (elementary and middle school): 15
Here:
5.9%
Texas:
8.8%
Students in private schools in grades 9 to 12 (high school): 7
Here:
12.2%
Texas:
8.0%
Students in private undergraduate colleges: 5
Here:
20.6%
Texas:
16.2%
Occupation by median earnings in the past 12 months ($)
75,383Transportation occupations
65,116Healthcare support occupations
59,012Installation, maintenance, and repair occupations
53,365Arts, design, entertainment, sports, and media occupations
47,130Construction and extraction occupations
43,256Production occupations
Top industries in this zip code by the number of employees in 2005:
Construction: Poured Concrete Foundation and Structure Contractors (10-19 employees: 1 establishment)
Arts, Entertainment, and Recreation: Fitness and Recreational Sports Centers (5-9: 1)
Other Services (except Public Administration): Religious Organizations (1-4: 2)
Construction: New Single-Family Housing Construction (except Operative Builders) (1-4: 1)
Professional, Scientific, and Technical Services: Offices of Lawyers (1-4: 1)
Arts, Entertainment, and Recreation: Other Spectator Sports (1-4: 1)
Mining: Support Activities for Oil and Gas Operations (1-4: 1)
Administrative and Support and Waste Management and Remediation Services: Solid Waste Collection (1-4: 1)
Fatal accident statistics in 2014:
Fatal accident count: 3
Vehicles involved in fatal accidents: 5
Fatal accidents caused by drunken drivers: 0
Fatalities: 3
Persons involved in fatal accidents: 9
Pedestrians involved in fatal accidents: 1
Fatal accident statistics in 2011:
Fatal accident count: 3
Vehicles involved in fatal accidents: 3
Fatal accidents caused by drunken drivers: 0
Fatalities: 3
Persons involved in fatal accidents: 5
Pedestrians involved in fatal accidents: 1
Home Mortgage Disclosure Act Aggregated Statistics For Year 2009 (Based on 4 partial tracts)
A) FHA, FSA/RHS & VA Home Purchase Loans
B) Conventional Home Purchase Loans
C) Refinancings
D) Home Improvement Loans
F) Non-occupant Loans on < 5 Family Dwellings (A B C & D)
G) Loans On Manufactured Home Dwelling (A B C & D)
Number
Average Value
Number
Average Value
Number
Average Value
Number
Average Value
Number
Average Value
Number
Average Value
LOANS ORIGINATED
16
$145,514
25
$122,876
57
$139,695
13
$43,191
7
$117,067
13
$65,198
APPLICATIONS APPROVED, NOT ACCEPTED
1
$100,840
3
$62,463
8
$143,928
4
$39,552
1
$65,890
3
$59,783
APPLICATIONS DENIED
4
$119,332
7
$102,224
27
$122,517
8
$29,962
2
$78,985
7
$57,334
APPLICATIONS WITHDRAWN
3
$108,297
2
$145,335
20
$144,744
2
$104,500
1
$185,220
2
$70,215
FILES CLOSED FOR INCOMPLETENESS
0
$0
1
$50,710
4
$160,222
2
$84,785
1
$33,510
2
$69,880
Aggregated Statistics For Year 2008 (Based on 4 partial tracts)
A) FHA, FSA/RHS & VA Home Purchase Loans
B) Conventional Home Purchase Loans
C) Refinancings
D) Home Improvement Loans
F) Non-occupant Loans on < 5 Family Dwellings (A B C & D)
G) Loans On Manufactured Home Dwelling (A B C & D)
Number
Average Value
Number
Average Value
Number
Average Value
Number
Average Value
Number
Average Value
Number
Average Value
LOANS ORIGINATED
23
$131,549
32
$132,279
35
$131,051
10
$35,631
8
$93,745
16
$74,472
APPLICATIONS APPROVED, NOT ACCEPTED
2
$111,370
6
$69,442
3
$138,647
1
$53,440
0
$0
6
$69,833
APPLICATIONS DENIED
11
$109,336
11
$114,837
32
$127,158
13
$62,433
3
$113,733
12
$64,337
APPLICATIONS WITHDRAWN
4
$137,645
6
$117,523
15
$114,355
1
$45,840
2
$80,270
2
$79,335
FILES CLOSED FOR INCOMPLETENESS
1
$62,620
0
$0
2
$289,505
0
$0
0
$0
0
$0
Aggregated Statistics For Year 2007 (Based on 4 partial tracts)
A) FHA, FSA/RHS & VA Home Purchase Loans
B) Conventional Home Purchase Loans
C) Refinancings
D) Home Improvement Loans
F) Non-occupant Loans on < 5 Family Dwellings (A B C & D)
G) Loans On Manufactured Home Dwelling (A B C & D)
Number
Average Value
Number
Average Value
Number
Average Value
Number
Average Value
Number
Average Value
Number
Average Value
LOANS ORIGINATED
10
$113,727
73
$119,263
41
$128,964
15
$48,393
21
$112,213
19
$54,119
APPLICATIONS APPROVED, NOT ACCEPTED
0
$0
20
$105,591
4
$131,380
2
$47,055
5
$94,154
9
$54,494
APPLICATIONS DENIED
2
$108,430
22
$109,591
54
$126,527
18
$34,631
7
$96,766
19
$66,008
APPLICATIONS WITHDRAWN
2
$114,890
10
$141,938
30
$132,542
3
$58,133
4
$119,845
4
$87,088
FILES CLOSED FOR INCOMPLETENESS
0
$0
3
$119,927
8
$128,471
1
$30,130
1
$63,960
1
$63,300
Aggregated Statistics For Year 2006 (Based on 4 partial tracts)
A) FHA, FSA/RHS & VA Home Purchase Loans
B) Conventional Home Purchase Loans
C) Refinancings
D) Home Improvement Loans
F) Non-occupant Loans on < 5 Family Dwellings (A B C & D)
G) Loans On Manufactured Home Dwelling (A B C & D)
Number
Average Value
Number
Average Value
Number
Average Value
Number
Average Value
Number
Average Value
Number
Average Value
LOANS ORIGINATED
14
$124,351
120
$103,764
54
$118,191
13
$40,132
15
$91,195
21
$73,428
APPLICATIONS APPROVED, NOT ACCEPTED
1
$48,660
19
$96,162
10
$110,015
2
$49,225
4
$116,800
7
$52,131
APPLICATIONS DENIED
5
$115,744
36
$97,069
75
$102,689
21
$38,230
9
$69,267
30
$64,615
APPLICATIONS WITHDRAWN
3
$95,700
13
$101,954
45
$112,013
4
$60,908
2
$101,600
5
$82,462
FILES CLOSED FOR INCOMPLETENESS
0
$0
4
$106,268
10
$130,533
0
$0
1
$112,620
0
$0
Aggregated Statistics For Year 2005 (Based on 4 partial tracts)
A) FHA, FSA/RHS & VA Home Purchase Loans
B) Conventional Home Purchase Loans
C) Refinancings
D) Home Improvement Loans
F) Non-occupant Loans on < 5 Family Dwellings (A B C & D)
G) Loans On Manufactured Home Dwelling (A B C & D)
Number
Average Value
Number
Average Value
Number
Average Value
Number
Average Value
Number
Average Value
Number
Average Value
LOANS ORIGINATED
30
$114,548
96
$95,372
61
$110,318
19
$62,803
17
$82,902
24
$67,254
APPLICATIONS APPROVED, NOT ACCEPTED
3
$71,557
17
$64,559
11
$119,342
3
$38,427
1
$101,060
10
$59,944
APPLICATIONS DENIED
5
$99,044
40
$103,968
72
$107,342
18
$49,686
5
$104,948
26
$58,844
APPLICATIONS WITHDRAWN
3
$105,743
20
$93,366
48
$133,760
10
$146,986
5
$92,918
3
$89,230
FILES CLOSED FOR INCOMPLETENESS
0
$0
3
$240,470
20
$139,313
1
$36,710
1
$483,030
1
$35,130
Aggregated Statistics For Year 2004 (Based on 4 partial tracts)
A) FHA, FSA/RHS & VA Home Purchase Loans
B) Conventional Home Purchase Loans
C) Refinancings
D) Home Improvement Loans
F) Non-occupant Loans on < 5 Family Dwellings (A B C & D)
G) Loans On Manufactured Home Dwelling (A B C & D)
Number
Average Value
Number
Average Value
Number
Average Value
Number
Average Value
Number
Average Value
Number
Average Value
LOANS ORIGINATED
44
$114,873
89
$98,294
89
$113,302
9
$36,240
14
$70,213
25
$63,937
APPLICATIONS APPROVED, NOT ACCEPTED
2
$131,455
18
$76,175
20
$107,421
2
$33,115
3
$57,423
9
$57,257
APPLICATIONS DENIED
9
$127,387
37
$74,580
76
$103,967
19
$33,403
5
$81,678
31
$56,251
APPLICATIONS WITHDRAWN
6
$125,710
10
$108,121
51
$105,119
3
$56,497
2
$58,695
6
$81,602
FILES CLOSED FOR INCOMPLETENESS
1
$80,650
2
$129,975
16
$119,275
1
$40,190
0
$0
0
$0
Aggregated Statistics For Year 2003 (Based on 4 partial tracts)
A) FHA, FSA/RHS & VA Home Purchase Loans
B) Conventional Home Purchase Loans
C) Refinancings
D) Home Improvement Loans
F) Non-occupant Loans on < 5 Family Dwellings (A B C & D)
Number
Average Value
Number
Average Value
Number
Average Value
Number
Average Value
Number
Average Value
LOANS ORIGINATED
30
$120,017
72
$103,627
165
$115,202
14
$45,435
10
$85,965
APPLICATIONS APPROVED, NOT ACCEPTED
1
$141,040
7
$96,014
21
$112,071
2
$50,890
0
$0
APPLICATIONS DENIED
8
$127,158
31
$68,909
96
$96,374
13
$29,833
3
$102,397
APPLICATIONS WITHDRAWN
10
$124,233
10
$93,078
70
$107,914
2
$34,540
3
$62,647
FILES CLOSED FOR INCOMPLETENESS
3
$116,290
1
$148,760
6
$123,210
0
$0
0
$0
Aggregated Statistics For Year 2002 (Based on 4 partial tracts)
A) FHA, FSA/RHS & VA Home Purchase Loans
B) Conventional Home Purchase Loans
C) Refinancings
D) Home Improvement Loans
F) Non-occupant Loans on < 5 Family Dwellings (A B C & D)
Number
Average Value
Number
Average Value
Number
Average Value
Number
Average Value
Number
Average Value
LOANS ORIGINATED
20
$119,464
60
$104,986
104
$115,735
18
$21,719
10
$83,206
APPLICATIONS APPROVED, NOT ACCEPTED
2
$109,875
13
$83,302
19
$99,244
3
$25,187
1
$37,720
APPLICATIONS DENIED
3
$141,607
28
$77,910
45
$90,851
15
$18,518
4
$139,720
APPLICATIONS WITHDRAWN
3
$99,437
8
$107,339
46
$101,359
3
$15,940
1
$63,390
FILES CLOSED FOR INCOMPLETENESS
0
$0
2
$98,250
8
$95,450
0
$0
0
$0
Aggregated Statistics For Year 2001 (Based on 4 partial tracts)
A) FHA, FSA/RHS & VA Home Purchase Loans
B) Conventional Home Purchase Loans
C) Refinancings
D) Home Improvement Loans
F) Non-occupant Loans on < 5 Family Dwellings (A B C & D)
Number
Average Value
Number
Average Value
Number
Average Value
Number
Average Value
Number
Average Value
LOANS ORIGINATED
29
$110,924
94
$104,731
80
$114,328
15
$33,051
8
$83,950
APPLICATIONS APPROVED, NOT ACCEPTED
2
$113,810
16
$84,396
17
$96,087
3
$44,277
3
$70,900
APPLICATIONS DENIED
2
$71,540
34
$58,794
29
$90,279
11
$19,985
3
$62,847
APPLICATIONS WITHDRAWN
3
$89,110
8
$102,496
26
$92,660
2
$19,695
1
$110,870
FILES CLOSED FOR INCOMPLETENESS
1
$118,440
1
$181,810
7
$114,337
0
$0
0
$0
Aggregated Statistics For Year 2000 (Based on 4 partial tracts)
A) FHA, FSA/RHS & VA Home Purchase Loans
B) Conventional Home Purchase Loans
C) Refinancings
D) Home Improvement Loans
F) Non-occupant Loans on < 5 Family Dwellings (A B C & D)
Number
Average Value
Number
Average Value
Number
Average Value
Number
Average Value
Number
Average Value
LOANS ORIGINATED
16
$98,889
88
$93,750
24
$95,325
11
$23,509
8
$72,755
APPLICATIONS APPROVED, NOT ACCEPTED
2
$50,720
16
$65,304
7
$64,154
2
$49,640
1
$44,540
APPLICATIONS DENIED
4
$72,100
64
$56,430
17
$85,694
9
$18,094
4
$51,912
APPLICATIONS WITHDRAWN
1
$143,320
8
$115,440
7
$74,603
1
$20,940
0
$0
FILES CLOSED FOR INCOMPLETENESS
1
$66,680
3
$88,773
6
$112,055
0
$0
0
$0
Aggregated Statistics For Year 1999 (Based on 2 partial tracts)
A) FHA, FSA/RHS & VA Home Purchase Loans
B) Conventional Home Purchase Loans
C) Refinancings
D) Home Improvement Loans
F) Non-occupant Loans on < 5 Family Dwellings (A B C & D)

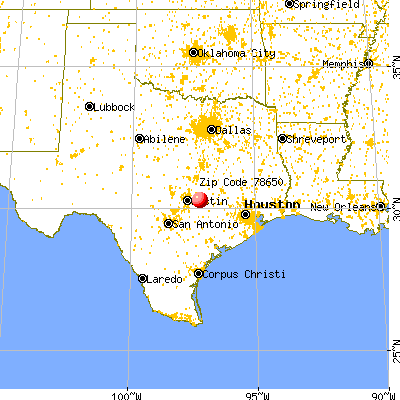


 Nearest zip codes: 78659, 78621, 78602, 78947, 78615, 76578.