Estimated zip code population in 2022: 33,521
Zip code population in 2010: 31,340
Zip code population in 2000: 26,825
Houses and condos: 12,228
Renter-occupied apartments: 9,342
% of renters here:
88%State:
38%
March 2022 cost of living index in zip code 78705: 112.6
(more than average, U.S. average is 100)
Land area: 2.2
sq. mi.
Water area: 0.0
sq. mi.
Population density: 15,265 people per square mile (very high).
OSM Map
General Map
Google Map
MSN Map
OSM Map
General Map
Google Map
MSN Map
OSM Map
General Map
Google Map
MSN Map
OSM Map
General Map
Google Map
MSN Map
Please wait while loading the map...
Real estate property taxes paid for housing units in 2022:
This zip code:
1.6% ($9,413)Texas:
1.5% ($4,050)
Median real estate property taxes paid for housing units with mortgages in 2022: $7,165 (1.6%)
Median real estate property taxes paid for housing units with no mortgage in 2022: $10,700 (1.4%)
Profiles of local businesses
Business Search - 14 Million verified businesses
Males: 15,463 Females: 18,057
For population 25 years and over in 78705:
High school or higher: 99.8%Bachelor's degree or higher: 75.9%Graduate or professional degree: 32.4%Unemployed: 8.7%Mean travel time to work (commute): 16.7 minutes
For population 15 years and over in 78705:
Never married: 91.0%Now married: 6.7%Separated: 0.2%Widowed: 0.5%Divorced: 1.6%
Zip code 78705 compared to state average:
Median household income significantly below state average. Median house value above state average. Unemployed percentage above state average. Hispanic race population percentage below state average. Median age significantly below state average. Renting percentage significantly above state average. Number of rooms per house significantly below state average. Number of college students significantly above state average. 16,469 49.1% White 7,285 21.7% Hispanic or Latino 5,292 15.8% Asian 3,099 9.2% Black 1,110 3.3% Two or more races 149 0.4% Some other race 100 0.3% American Indian 14 0.04% Native Hawaiian and Other
Data:
Median household income ($)
Median household income (% change since 2000)
Household income diversity
Ratio of average income to average house value (%)
Ratio of average income to average rent
Median household income ($) - White
Median household income ($) - Black or African American
Median household income ($) - Asian
Median household income ($) - Hispanic or Latino
Median household income ($) - American Indian and Alaska Native
Median household income ($) - Multirace
Median household income ($) - Other Race
Median household income for houses/condos with a mortgage ($)
Median household income for apartments without a mortgage ($)
Races - White alone (%)
Races - White alone (% change since 2000)
Races - Black alone (%)
Races - Black alone (% change since 2000)
Races - American Indian alone (%)
Races - American Indian alone (% change since 2000)
Races - Asian alone (%)
Races - Asian alone (% change since 2000)
Races - Hispanic (%)
Races - Hispanic (% change since 2000)
Races - Native Hawaiian and Other Pacific Islander alone (%)
Races - Native Hawaiian and Other Pacific Islander alone (% change since 2000)
Races - Two or more races (%)
Races - Two or more races (% change since 2000)
Races - Other race alone (%)
Races - Other race alone (% change since 2000)
Racial diversity
Unemployment (%)
Unemployment (% change since 2000)
Unemployment (%) - White
Unemployment (%) - Black or African American
Unemployment (%) - Asian
Unemployment (%) - Hispanic or Latino
Unemployment (%) - American Indian and Alaska Native
Unemployment (%) - Multirace
Unemployment (%) - Other Race
Population density (people per square mile)
Population - Males (%)
Population - Females (%)
Population - Males (%) - White
Population - Males (%) - Black or African American
Population - Males (%) - Asian
Population - Males (%) - Hispanic or Latino
Population - Males (%) - American Indian and Alaska Native
Population - Males (%) - Multirace
Population - Males (%) - Other Race
Population - Females (%) - White
Population - Females (%) - Black or African American
Population - Females (%) - Asian
Population - Females (%) - Hispanic or Latino
Population - Females (%) - American Indian and Alaska Native
Population - Females (%) - Multirace
Population - Females (%) - Other Race
Coronavirus confirmed cases (May 28, 2024)
Deaths caused by coronavirus (May 28, 2024)
Coronavirus confirmed cases (per 100k population) (May 28, 2024)
Deaths caused by coronavirus (per 100k population) (May 28, 2024)
Daily increase in number of cases (May 28, 2024)
Weekly increase in number of cases (May 28, 2024)
Cases doubled (in days) (May 28, 2024)
Hospitalized patients (Apr 18, 2022)
Negative test results (Apr 18, 2022)
Total test results (Apr 18, 2022)
COVID Vaccine doses distributed (per 100k population) (Sep 19, 2023)
COVID Vaccine doses administered (per 100k population) (Sep 19, 2023)
COVID Vaccine doses distributed (Sep 19, 2023)
COVID Vaccine doses administered (Sep 19, 2023)
Likely homosexual households (%)
Likely homosexual households (% change since 2000)
Likely homosexual households - Lesbian couples (%)
Likely homosexual households - Lesbian couples (% change since 2000)
Likely homosexual households - Gay men (%)
Likely homosexual households - Gay men (% change since 2000)
Cost of living index
Median gross rent ($)
Median contract rent ($)
Median monthly housing costs ($)
Median house or condo value ($)
Median house or condo value ($ change since 2000)
Mean house or condo value by units in structure - 1, detached ($)
Mean house or condo value by units in structure - 1, attached ($)
Mean house or condo value by units in structure - 2 ($)
Mean house or condo value by units in structure by units in structure - 3 or 4 ($)
Mean house or condo value by units in structure - 5 or more ($)
Mean house or condo value by units in structure - Boat, RV, van, etc. ($)
Mean house or condo value by units in structure - Mobile home ($)
Median house or condo value ($) - White
Median house or condo value ($) - Black or African American
Median house or condo value ($) - Asian
Median house or condo value ($) - Hispanic or Latino
Median house or condo value ($) - American Indian and Alaska Native
Median house or condo value ($) - Multirace
Median house or condo value ($) - Other Race
Median resident age
Resident age diversity
Median resident age - Males
Median resident age - Females
Median resident age - White
Median resident age - Black or African American
Median resident age - Asian
Median resident age - Hispanic or Latino
Median resident age - American Indian and Alaska Native
Median resident age - Multirace
Median resident age - Other Race
Median resident age - Males - White
Median resident age - Males - Black or African American
Median resident age - Males - Asian
Median resident age - Males - Hispanic or Latino
Median resident age - Males - American Indian and Alaska Native
Median resident age - Males - Multirace
Median resident age - Males - Other Race
Median resident age - Females - White
Median resident age - Females - Black or African American
Median resident age - Females - Asian
Median resident age - Females - Hispanic or Latino
Median resident age - Females - American Indian and Alaska Native
Median resident age - Females - Multirace
Median resident age - Females - Other Race
Commute - mean travel time to work (minutes)
Travel time to work - Less than 5 minutes (%)
Travel time to work - Less than 5 minutes (% change since 2000)
Travel time to work - 5 to 9 minutes (%)
Travel time to work - 5 to 9 minutes (% change since 2000)
Travel time to work - 10 to 19 minutes (%)
Travel time to work - 10 to 19 minutes (% change since 2000)
Travel time to work - 20 to 29 minutes (%)
Travel time to work - 20 to 29 minutes (% change since 2000)
Travel time to work - 30 to 39 minutes (%)
Travel time to work - 30 to 39 minutes (% change since 2000)
Travel time to work - 40 to 59 minutes (%)
Travel time to work - 40 to 59 minutes (% change since 2000)
Travel time to work - 60 to 89 minutes (%)
Travel time to work - 60 to 89 minutes (% change since 2000)
Travel time to work - 90 or more minutes (%)
Travel time to work - 90 or more minutes (% change since 2000)
Marital status - Never married (%)
Marital status - Now married (%)
Marital status - Separated (%)
Marital status - Widowed (%)
Marital status - Divorced (%)
Median family income ($)
Median family income (% change since 2000)
Median non-family income ($)
Median non-family income (% change since 2000)
Median per capita income ($)
Median per capita income (% change since 2000)
Median family income ($) - White
Median family income ($) - Black or African American
Median family income ($) - Asian
Median family income ($) - Hispanic or Latino
Median family income ($) - American Indian and Alaska Native
Median family income ($) - Multirace
Median family income ($) - Other Race
Median year house/condo built
Median year apartment built
Year house built - Built 2005 or later (%)
Year house built - Built 2000 to 2004 (%)
Year house built - Built 1990 to 1999 (%)
Year house built - Built 1980 to 1989 (%)
Year house built - Built 1970 to 1979 (%)
Year house built - Built 1960 to 1969 (%)
Year house built - Built 1950 to 1959 (%)
Year house built - Built 1940 to 1949 (%)
Year house built - Built 1939 or earlier (%)
Average household size
Household density (households per square mile)
Average household size - White
Average household size - Black or African American
Average household size - Asian
Average household size - Hispanic or Latino
Average household size - American Indian and Alaska Native
Average household size - Multirace
Average household size - Other Race
Occupied housing units (%)
Vacant housing units (%)
Owner occupied housing units (%)
Renter occupied housing units (%)
Vacancy status - For rent (%)
Vacancy status - For sale only (%)
Vacancy status - Rented or sold, not occupied (%)
Vacancy status - For seasonal, recreational, or occasional use (%)
Vacancy status - For migrant workers (%)
Vacancy status - Other vacant (%)
Residents with income below the poverty level (%)
Residents with income below 50% of the poverty level (%)
Children below poverty level (%)
Poor families by family type - Married-couple family (%)
Poor families by family type - Male, no wife present (%)
Poor families by family type - Female, no husband present (%)
Poverty status for native-born residents (%)
Poverty status for foreign-born residents (%)
Poverty among high school graduates not in families (%)
Poverty among people who did not graduate high school not in families (%)
Residents with income below the poverty level (%) - White
Residents with income below the poverty level (%) - Black or African American
Residents with income below the poverty level (%) - Asian
Residents with income below the poverty level (%) - Hispanic or Latino
Residents with income below the poverty level (%) - American Indian and Alaska Native
Residents with income below the poverty level (%) - Multirace
Residents with income below the poverty level (%) - Other Race
Air pollution - Air Quality Index (AQI)
Air pollution - CO
Air pollution - NO2
Air pollution - SO2
Air pollution - Ozone
Air pollution - PM10
Air pollution - PM25
Air pollution - Pb
Crime - Murders per 100,000 population
Crime - Rapes per 100,000 population
Crime - Robberies per 100,000 population
Crime - Assaults per 100,000 population
Crime - Burglaries per 100,000 population
Crime - Thefts per 100,000 population
Crime - Auto thefts per 100,000 population
Crime - Arson per 100,000 population
Crime - City-data.com crime index
Crime - Violent crime index
Crime - Property crime index
Crime - Murders per 100,000 population (5 year average)
Crime - Rapes per 100,000 population (5 year average)
Crime - Robberies per 100,000 population (5 year average)
Crime - Assaults per 100,000 population (5 year average)
Crime - Burglaries per 100,000 population (5 year average)
Crime - Thefts per 100,000 population (5 year average)
Crime - Auto thefts per 100,000 population (5 year average)
Crime - Arson per 100,000 population (5 year average)
Crime - City-data.com crime index (5 year average)
Crime - Violent crime index (5 year average)
Crime - Property crime index (5 year average)
1996 Presidential Elections Results (%) - Democratic Party (Clinton)
1996 Presidential Elections Results (%) - Republican Party (Dole)
1996 Presidential Elections Results (%) - Other
2000 Presidential Elections Results (%) - Democratic Party (Gore)
2000 Presidential Elections Results (%) - Republican Party (Bush)
2000 Presidential Elections Results (%) - Other
2004 Presidential Elections Results (%) - Democratic Party (Kerry)
2004 Presidential Elections Results (%) - Republican Party (Bush)
2004 Presidential Elections Results (%) - Other
2008 Presidential Elections Results (%) - Democratic Party (Obama)
2008 Presidential Elections Results (%) - Republican Party (McCain)
2008 Presidential Elections Results (%) - Other
2012 Presidential Elections Results (%) - Democratic Party (Obama)
2012 Presidential Elections Results (%) - Republican Party (Romney)
2012 Presidential Elections Results (%) - Other
2016 Presidential Elections Results (%) - Democratic Party (Clinton)
2016 Presidential Elections Results (%) - Republican Party (Trump)
2016 Presidential Elections Results (%) - Other
2020 Presidential Elections Results (%) - Democratic Party (Biden)
2020 Presidential Elections Results (%) - Republican Party (Trump)
2020 Presidential Elections Results (%) - Other
Ancestries Reported - Arab (%)
Ancestries Reported - Czech (%)
Ancestries Reported - Danish (%)
Ancestries Reported - Dutch (%)
Ancestries Reported - English (%)
Ancestries Reported - French (%)
Ancestries Reported - French Canadian (%)
Ancestries Reported - German (%)
Ancestries Reported - Greek (%)
Ancestries Reported - Hungarian (%)
Ancestries Reported - Irish (%)
Ancestries Reported - Italian (%)
Ancestries Reported - Lithuanian (%)
Ancestries Reported - Norwegian (%)
Ancestries Reported - Polish (%)
Ancestries Reported - Portuguese (%)
Ancestries Reported - Russian (%)
Ancestries Reported - Scotch-Irish (%)
Ancestries Reported - Scottish (%)
Ancestries Reported - Slovak (%)
Ancestries Reported - Subsaharan African (%)
Ancestries Reported - Swedish (%)
Ancestries Reported - Swiss (%)
Ancestries Reported - Ukrainian (%)
Ancestries Reported - United States (%)
Ancestries Reported - Welsh (%)
Ancestries Reported - West Indian (%)
Ancestries Reported - Other (%)
Educational Attainment - No schooling completed (%)
Educational Attainment - Less than high school (%)
Educational Attainment - High school or equivalent (%)
Educational Attainment - Less than 1 year of college (%)
Educational Attainment - 1 or more years of college (%)
Educational Attainment - Associate degree (%)
Educational Attainment - Bachelor's degree (%)
Educational Attainment - Master's degree (%)
Educational Attainment - Professional school degree (%)
Educational Attainment - Doctorate degree (%)
School Enrollment - Nursery, preschool (%)
School Enrollment - Kindergarten (%)
School Enrollment - Grade 1 to 4 (%)
School Enrollment - Grade 5 to 8 (%)
School Enrollment - Grade 9 to 12 (%)
School Enrollment - College undergrad (%)
School Enrollment - Graduate or professional (%)
School Enrollment - Not enrolled in school (%)
School enrollment - Public schools (%)
School enrollment - Private schools (%)
School enrollment - Not enrolled (%)
Median number of rooms in houses and condos
Median number of rooms in apartments
Housing units lacking complete plumbing facilities (%)
Housing units lacking complete kitchen facilities (%)
Density of houses
Urban houses (%)
Rural houses (%)
Households with people 60 years and over (%)
Households with people 65 years and over (%)
Households with people 75 years and over (%)
Households with one or more nonrelatives (%)
Households with no nonrelatives (%)
Population in households (%)
Family households (%)
Nonfamily households (%)
Population in families (%)
Family households with own children (%)
Median number of bedrooms in owner occupied houses
Mean number of bedrooms in owner occupied houses
Median number of bedrooms in renter occupied houses
Mean number of bedrooms in renter occupied houses
Median number of vehichles in owner occupied houses
Mean number of vehichles in owner occupied houses
Median number of vehichles in renter occupied houses
Mean number of vehichles in renter occupied houses
Mortgage status - with mortgage (%)
Mortgage status - with second mortgage (%)
Mortgage status - with home equity loan (%)
Mortgage status - with both second mortgage and home equity loan (%)
Mortgage status - without a mortgage (%)
Average family size
Average family size - White
Average family size - Black or African American
Average family size - Asian
Average family size - Hispanic or Latino
Average family size - American Indian and Alaska Native
Average family size - Multirace
Average family size - Other Race
Geographical mobility - Same house 1 year ago (%)
Geographical mobility - Moved within same county (%)
Geographical mobility - Moved from different county within same state (%)
Geographical mobility - Moved from different state (%)
Geographical mobility - Moved from abroad (%)
Place of birth - Born in state of residence (%)
Place of birth - Born in other state (%)
Place of birth - Native, outside of US (%)
Place of birth - Foreign born (%)
Housing units in structures - 1, detached (%)
Housing units in structures - 1, attached (%)
Housing units in structures - 2 (%)
Housing units in structures - 3 or 4 (%)
Housing units in structures - 5 to 9 (%)
Housing units in structures - 10 to 19 (%)
Housing units in structures - 20 to 49 (%)
Housing units in structures - 50 or more (%)
Housing units in structures - Mobile home (%)
Housing units in structures - Boat, RV, van, etc. (%)
House/condo owner moved in on average (years ago)
Renter moved in on average (years ago)
Year householder moved into unit - Moved in 1999 to March 2000 (%)
Year householder moved into unit - Moved in 1995 to 1998 (%)
Year householder moved into unit - Moved in 1990 to 1994 (%)
Year householder moved into unit - Moved in 1980 to 1989 (%)
Year householder moved into unit - Moved in 1970 to 1979 (%)
Year householder moved into unit - Moved in 1969 or earlier (%)
Means of transportation to work - Drove car alone (%)
Means of transportation to work - Carpooled (%)
Means of transportation to work - Public transportation (%)
Means of transportation to work - Bus or trolley bus (%)
Means of transportation to work - Streetcar or trolley car (%)
Means of transportation to work - Subway or elevated (%)
Means of transportation to work - Railroad (%)
Means of transportation to work - Ferryboat (%)
Means of transportation to work - Taxicab (%)
Means of transportation to work - Motorcycle (%)
Means of transportation to work - Bicycle (%)
Means of transportation to work - Walked (%)
Means of transportation to work - Other means (%)
Working at home (%)
Industry diversity
Most Common Industries - Agriculture, forestry, fishing and hunting, and mining (%)
Most Common Industries - Agriculture, forestry, fishing and hunting (%)
Most Common Industries - Mining, quarrying, and oil and gas extraction (%)
Most Common Industries - Construction (%)
Most Common Industries - Manufacturing (%)
Most Common Industries - Wholesale trade (%)
Most Common Industries - Retail trade (%)
Most Common Industries - Transportation and warehousing, and utilities (%)
Most Common Industries - Transportation and warehousing (%)
Most Common Industries - Utilities (%)
Most Common Industries - Information (%)
Most Common Industries - Finance and insurance, and real estate and rental and leasing (%)
Most Common Industries - Finance and insurance (%)
Most Common Industries - Real estate and rental and leasing (%)
Most Common Industries - Professional, scientific, and management, and administrative and waste management services (%)
Most Common Industries - Professional, scientific, and technical services (%)
Most Common Industries - Management of companies and enterprises (%)
Most Common Industries - Administrative and support and waste management services (%)
Most Common Industries - Educational services, and health care and social assistance (%)
Most Common Industries - Educational services (%)
Most Common Industries - Health care and social assistance (%)
Most Common Industries - Arts, entertainment, and recreation, and accommodation and food services (%)
Most Common Industries - Arts, entertainment, and recreation (%)
Most Common Industries - Accommodation and food services (%)
Most Common Industries - Other services, except public administration (%)
Most Common Industries - Public administration (%)
Occupation diversity
Most Common Occupations - Management, business, science, and arts occupations (%)
Most Common Occupations - Management, business, and financial occupations (%)
Most Common Occupations - Management occupations (%)
Most Common Occupations - Business and financial operations occupations (%)
Most Common Occupations - Computer, engineering, and science occupations (%)
Most Common Occupations - Computer and mathematical occupations (%)
Most Common Occupations - Architecture and engineering occupations (%)
Most Common Occupations - Life, physical, and social science occupations (%)
Most Common Occupations - Education, legal, community service, arts, and media occupations (%)
Most Common Occupations - Community and social service occupations (%)
Most Common Occupations - Legal occupations (%)
Most Common Occupations - Education, training, and library occupations (%)
Most Common Occupations - Arts, design, entertainment, sports, and media occupations (%)
Most Common Occupations - Healthcare practitioners and technical occupations (%)
Most Common Occupations - Health diagnosing and treating practitioners and other technical occupations (%)
Most Common Occupations - Health technologists and technicians (%)
Most Common Occupations - Service occupations (%)
Most Common Occupations - Healthcare support occupations (%)
Most Common Occupations - Protective service occupations (%)
Most Common Occupations - Fire fighting and prevention, and other protective service workers including supervisors (%)
Most Common Occupations - Law enforcement workers including supervisors (%)
Most Common Occupations - Food preparation and serving related occupations (%)
Most Common Occupations - Building and grounds cleaning and maintenance occupations (%)
Most Common Occupations - Personal care and service occupations (%)
Most Common Occupations - Sales and office occupations (%)
Most Common Occupations - Sales and related occupations (%)
Most Common Occupations - Office and administrative support occupations (%)
Most Common Occupations - Natural resources, construction, and maintenance occupations (%)
Most Common Occupations - Farming, fishing, and forestry occupations (%)
Most Common Occupations - Construction and extraction occupations (%)
Most Common Occupations - Installation, maintenance, and repair occupations (%)
Most Common Occupations - Production, transportation, and material moving occupations (%)
Most Common Occupations - Production occupations (%)
Most Common Occupations - Transportation occupations (%)
Most Common Occupations - Material moving occupations (%)
People in Group quarters - Institutionalized population (%)
People in Group quarters - Correctional institutions (%)
People in Group quarters - Federal prisons and detention centers (%)
People in Group quarters - Halfway houses (%)
People in Group quarters - Local jails and other confinement facilities (including police lockups) (%)
People in Group quarters - Military disciplinary barracks (%)
People in Group quarters - State prisons (%)
People in Group quarters - Other types of correctional institutions (%)
People in Group quarters - Nursing homes (%)
People in Group quarters - Hospitals/wards, hospices, and schools for the handicapped (%)
People in Group quarters - Hospitals/wards and hospices for chronically ill (%)
People in Group quarters - Hospices or homes for chronically ill (%)
People in Group quarters - Military hospitals or wards for chronically ill (%)
People in Group quarters - Other hospitals or wards for chronically ill (%)
People in Group quarters - Hospitals or wards for drug/alcohol abuse (%)
People in Group quarters - Mental (Psychiatric) hospitals or wards (%)
People in Group quarters - Schools, hospitals, or wards for the mentally retarded (%)
People in Group quarters - Schools, hospitals, or wards for the physically handicapped (%)
People in Group quarters - Institutions for the deaf (%)
People in Group quarters - Institutions for the blind (%)
People in Group quarters - Orthopedic wards and institutions for the physically handicapped (%)
People in Group quarters - Wards in general hospitals for patients who have no usual home elsewhere (%)
People in Group quarters - Wards in military hospitals for patients who have no usual home elsewhere (%)
People in Group quarters - Juvenile institutions (%)
People in Group quarters - Long-term care (%)
People in Group quarters - Homes for abused, dependent, and neglected children (%)
People in Group quarters - Residential treatment centers for emotionally disturbed children (%)
People in Group quarters - Training schools for juvenile delinquents (%)
People in Group quarters - Short-term care, detention or diagnostic centers for delinquent children (%)
People in Group quarters - Type of juvenile institution unknown (%)
People in Group quarters - Noninstitutionalized population (%)
People in Group quarters - College dormitories (includes college quarters off campus) (%)
People in Group quarters - Military quarters (%)
People in Group quarters - On base (%)
People in Group quarters - Barracks, unaccompanied personnel housing (UPH), (Enlisted/Officer), ;and similar group living quarters for military personnel (%)
People in Group quarters - Transient quarters for temporary residents (%)
People in Group quarters - Military ships (%)
People in Group quarters - Group homes (%)
People in Group quarters - Homes or halfway houses for drug/alcohol abuse (%)
People in Group quarters - Homes for the mentally ill (%)
People in Group quarters - Homes for the mentally retarded (%)
People in Group quarters - Homes for the physically handicapped (%)
People in Group quarters - Other group homes (%)
People in Group quarters - Religious group quarters (%)
People in Group quarters - Dormitories (%)
People in Group quarters - Agriculture workers' dormitories on farms (%)
People in Group quarters - Job Corps and vocational training facilities (%)
People in Group quarters - Other workers' dormitories (%)
People in Group quarters - Crews of maritime vessels (%)
People in Group quarters - Other nonhousehold living situations (%)
People in Group quarters - Other noninstitutional group quarters (%)
Residents speaking English at home (%)
Residents speaking English at home - Born in the United States (%)
Residents speaking English at home - Native, born elsewhere (%)
Residents speaking English at home - Foreign born (%)
Residents speaking Spanish at home (%)
Residents speaking Spanish at home - Born in the United States (%)
Residents speaking Spanish at home - Native, born elsewhere (%)
Residents speaking Spanish at home - Foreign born (%)
Residents speaking other language at home (%)
Residents speaking other language at home - Born in the United States (%)
Residents speaking other language at home - Native, born elsewhere (%)
Residents speaking other language at home - Foreign born (%)
Class of Workers - Employee of private company (%)
Class of Workers - Self-employed in own incorporated business (%)
Class of Workers - Private not-for-profit wage and salary workers (%)
Class of Workers - Local government workers (%)
Class of Workers - State government workers (%)
Class of Workers - Federal government workers (%)
Class of Workers - Self-employed workers in own not incorporated business and Unpaid family workers (%)
House heating fuel used in houses and condos - Utility gas (%)
House heating fuel used in houses and condos - Bottled, tank, or LP gas (%)
House heating fuel used in houses and condos - Electricity (%)
House heating fuel used in houses and condos - Fuel oil, kerosene, etc. (%)
House heating fuel used in houses and condos - Coal or coke (%)
House heating fuel used in houses and condos - Wood (%)
House heating fuel used in houses and condos - Solar energy (%)
House heating fuel used in houses and condos - Other fuel (%)
House heating fuel used in houses and condos - No fuel used (%)
House heating fuel used in apartments - Utility gas (%)
House heating fuel used in apartments - Bottled, tank, or LP gas (%)
House heating fuel used in apartments - Electricity (%)
House heating fuel used in apartments - Fuel oil, kerosene, etc. (%)
House heating fuel used in apartments - Coal or coke (%)
House heating fuel used in apartments - Wood (%)
House heating fuel used in apartments - Solar energy (%)
House heating fuel used in apartments - Other fuel (%)
House heating fuel used in apartments - No fuel used (%)
Armed forces status - In Armed Forces (%)
Armed forces status - Civilian (%)
Armed forces status - Civilian - Veteran (%)
Armed forces status - Civilian - Nonveteran (%)
Fatal accidents locations in years 2005-2021
Fatal accidents locations in 2005
Fatal accidents locations in 2006
Fatal accidents locations in 2007
Fatal accidents locations in 2008
Fatal accidents locations in 2009
Fatal accidents locations in 2010
Fatal accidents locations in 2011
Fatal accidents locations in 2012
Fatal accidents locations in 2013
Fatal accidents locations in 2014
Fatal accidents locations in 2015
Fatal accidents locations in 2016
Fatal accidents locations in 2017
Fatal accidents locations in 2018
Fatal accidents locations in 2019
Fatal accidents locations in 2020
Fatal accidents locations in 2021
Alcohol use - People drinking some alcohol every month (%)
Alcohol use - People not drinking at all (%)
Alcohol use - Average days/month drinking alcohol
Alcohol use - Average drinks/week
Alcohol use - Average days/year people drink much
Audiometry - Average condition of hearing (%)
Audiometry - People that can hear a whisper from across a quiet room (%)
Audiometry - People that can hear normal voice from across a quiet room (%)
Audiometry - Ears ringing, roaring, buzzing (%)
Audiometry - Had a job exposure to loud noise (%)
Audiometry - Had off-work exposure to loud noise (%)
Blood Pressure & Cholesterol - Has high blood pressure (%)
Blood Pressure & Cholesterol - Checking blood pressure at home (%)
Blood Pressure & Cholesterol - Frequently checking blood cholesterol (%)
Blood Pressure & Cholesterol - Has high cholesterol level (%)
Consumer Behavior - Money monthly spent on food at supermarket/grocery store
Consumer Behavior - Money monthly spent on food at other stores
Consumer Behavior - Money monthly spent on eating out
Consumer Behavior - Money monthly spent on carryout/delivered foods
Consumer Behavior - Income spent on food at supermarket/grocery store (%)
Consumer Behavior - Income spent on food at other stores (%)
Consumer Behavior - Income spent on eating out (%)
Consumer Behavior - Income spent on carryout/delivered foods (%)
Current Health Status - General health condition (%)
Current Health Status - Blood donors (%)
Current Health Status - Has blood ever tested for HIV virus (%)
Current Health Status - Left-handed people (%)
Dermatology - People using sunscreen (%)
Diabetes - Diabetics (%)
Diabetes - Had a blood test for high blood sugar (%)
Diabetes - People taking insulin (%)
Diet Behavior & Nutrition - Diet health (%)
Diet Behavior & Nutrition - Milk product consumption (# of products/month)
Diet Behavior & Nutrition - Meals not home prepared (#/week)
Diet Behavior & Nutrition - Meals from fast food or pizza place (#/week)
Diet Behavior & Nutrition - Ready-to-eat foods (#/month)
Diet Behavior & Nutrition - Frozen meals/pizza (#/month)
Drug Use - People that ever used marijuana or hashish (%)
Drug Use - Ever used hard drugs (%)
Drug Use - Ever used any form of cocaine (%)
Drug Use - Ever used heroin (%)
Drug Use - Ever used methamphetamine (%)
Health Insurance - People covered by health insurance (%)
Kidney Conditions-Urology - Avg. # of times urinating at night
Medical Conditions - People with asthma (%)
Medical Conditions - People with anemia (%)
Medical Conditions - People with psoriasis (%)
Medical Conditions - People with overweight (%)
Medical Conditions - Elderly people having difficulties in thinking or remembering (%)
Medical Conditions - People who ever received blood transfusion (%)
Medical Conditions - People having trouble seeing even with glass/contacts (%)
Medical Conditions - People with arthritis (%)
Medical Conditions - People with gout (%)
Medical Conditions - People with congestive heart failure (%)
Medical Conditions - People with coronary heart disease (%)
Medical Conditions - People with angina pectoris (%)
Medical Conditions - People who ever had heart attack (%)
Medical Conditions - People who ever had stroke (%)
Medical Conditions - People with emphysema (%)
Medical Conditions - People with thyroid problem (%)
Medical Conditions - People with chronic bronchitis (%)
Medical Conditions - People with any liver condition (%)
Medical Conditions - People who ever had cancer or malignancy (%)
Mental Health - People who have little interest in doing things (%)
Mental Health - People feeling down, depressed, or hopeless (%)
Mental Health - People who have trouble sleeping or sleeping too much (%)
Mental Health - People feeling tired or having little energy (%)
Mental Health - People with poor appetite or overeating (%)
Mental Health - People feeling bad about themself (%)
Mental Health - People who have trouble concentrating on things (%)
Mental Health - People moving or speaking slowly or too fast (%)
Mental Health - People having thoughts they would be better off dead (%)
Oral Health - Average years since last visit a dentist
Oral Health - People embarrassed because of mouth (%)
Oral Health - People with gum disease (%)
Oral Health - General health of teeth and gums (%)
Oral Health - Average days a week using dental floss/device
Oral Health - Average days a week using mouthwash for dental problem
Oral Health - Average number of teeth
Pesticide Use - Households using pesticides to control insects (%)
Pesticide Use - Households using pesticides to kill weeds (%)
Physical Activity - People doing vigorous-intensity work activities (%)
Physical Activity - People doing moderate-intensity work activities (%)
Physical Activity - People walking or bicycling (%)
Physical Activity - People doing vigorous-intensity recreational activities (%)
Physical Activity - People doing moderate-intensity recreational activities (%)
Physical Activity - Average hours a day doing sedentary activities
Physical Activity - Average hours a day watching TV or videos
Physical Activity - Average hours a day using computer
Physical Functioning - People having limitations keeping them from working (%)
Physical Functioning - People limited in amount of work they can do (%)
Physical Functioning - People that need special equipment to walk (%)
Physical Functioning - People experiencing confusion/memory problems (%)
Physical Functioning - People requiring special healthcare equipment (%)
Prescription Medications - Average number of prescription medicines taking
Preventive Aspirin Use - Adults 40+ taking low-dose aspirin (%)
Reproductive Health - Vaginal deliveries (%)
Reproductive Health - Cesarean deliveries (%)
Reproductive Health - Deliveries resulted in a live birth (%)
Reproductive Health - Pregnancies resulted in a delivery (%)
Reproductive Health - Women breastfeeding newborns (%)
Reproductive Health - Women that had a hysterectomy (%)
Reproductive Health - Women that had both ovaries removed (%)
Reproductive Health - Women that have ever taken birth control pills (%)
Reproductive Health - Women taking birth control pills (%)
Reproductive Health - Women that have ever used Depo-Provera or injectables (%)
Reproductive Health - Women that have ever used female hormones (%)
Sexual Behavior - People 18+ that ever had sex (vaginal, anal, or oral) (%)
Sexual Behavior - Males 18+ that ever had vaginal sex with a woman (%)
Sexual Behavior - Males 18+ that ever performed oral sex on a woman (%)
Sexual Behavior - Males 18+ that ever had anal sex with a woman (%)
Sexual Behavior - Males 18+ that ever had any sex with a man (%)
Sexual Behavior - Females 18+ that ever had vaginal sex with a man (%)
Sexual Behavior - Females 18+ that ever performed oral sex on a man (%)
Sexual Behavior - Females 18+ that ever had anal sex with a man (%)
Sexual Behavior - Females 18+ that ever had any kind of sex with a woman (%)
Sexual Behavior - Average age people first had sex
Sexual Behavior - Average number of female sex partners in lifetime (males 18+)
Sexual Behavior - Average number of female vaginal sex partners in lifetime (males 18+)
Sexual Behavior - Average age people first performed oral sex on a woman (18+)
Sexual Behavior - Average number of woman performed oral sex on in lifetime (18+)
Sexual Behavior - Average number of male sex partners in lifetime (males 18+)
Sexual Behavior - Average number of male anal sex partners in lifetime (males 18+)
Sexual Behavior - Average age people first performed oral sex on a man (18+)
Sexual Behavior - Average number of male oral sex partners in lifetime (18+)
Sexual Behavior - People using protection when performing oral sex (%)
Sexual Behavior - Average number of times people have vaginal or anal sex a year
Sexual Behavior - People having sex without condom (%)
Sexual Behavior - Average number of male sex partners in lifetime (females 18+)
Sexual Behavior - Average number of male vaginal sex partners in lifetime (females 18+)
Sexual Behavior - Average number of female sex partners in lifetime (females 18+)
Sexual Behavior - Circumcised males 18+ (%)
Sleep Disorders - Average hours sleeping at night
Sleep Disorders - People that has trouble sleeping (%)
Smoking-Cigarette Use - People smoking cigarettes (%)
Taste & Smell - People 40+ having problems with smell (%)
Taste & Smell - People 40+ having problems with taste (%)
Taste & Smell - People 40+ that ever had wisdom teeth removed (%)
Taste & Smell - People 40+ that ever had tonsils teeth removed (%)
Taste & Smell - People 40+ that ever had a loss of consciousness because of a head injury (%)
Taste & Smell - People 40+ that ever had a broken nose or other serious injury to face or skull (%)
Taste & Smell - People 40+ that ever had two or more sinus infections (%)
Weight - Average height (inches)
Weight - Average weight (pounds)
Weight - Average BMI
Weight - People that are obese (%)
Weight - People that ever were obese (%)
Weight - People trying to lose weight (%)
100%
urban population.
Estimated median house/condo value in 2022: $571,513
78705:
$571,513Texas:
$275,400
According to our research of Texas and other state lists, there were 5 registered sex offenders living in 78705 zip code as of May 28, 2024 . The ratio of all residents to sex offenders in zip code 78705 is 6,576 to 1.The ratio of registered sex offenders to all residents in this zip code is much lower than the state average.
Median resident age: This zip code:
21.3 yearsTexas median age:
35.6 years
Average household size: This zip code:
1.9 peopleTexas:
2.6 people
Averages for the 2020 tax year for zip code 78705, filed in 2021:
Average Adjusted Gross Income (AGI) in 2020: $61,840 (Individual Income Tax Returns) Here:
$61,840State:
$77,054
Salary/wage: $47,722 (reported on 88.7% of returns )Here:
$47,722State:
$62,766
(% of AGI for various income ranges: 1073.6% for AGIs below $25k , 3869.4% for AGIs $25k-50k , 7330.0% for AGIs $50k-75k , 11031.4% for AGIs $75k-100k , 19337.3% for AGIs $100k-200k , 135260.0% for AGIs over 200k ) Taxable interest for individuals: $2,171 (reported on 25.7% of returns )This zip code:
$2,171Texas:
$2,665
(% of AGI for various income ranges: 6.2% for AGIs below $25k , 15.5% for AGIs $25k-50k , 28.0% for AGIs $50k-75k , 135.2% for AGIs $75k-100k , 214.2% for AGIs $100k-200k , 3395.7% for AGIs over 200k ) Ordinary dividends: $7,313 (reported on 24.5% of returns )(% of AGI for various income ranges: 26.2% for AGIs below $25k , 52.8% for AGIs $25k-50k , 141.7% for AGIs $50k-75k , 377.1% for AGIs $75k-100k , 823.1% for AGIs $100k-200k , 9880.0% for AGIs over 200k ) Net capital gain/loss in AGI: +$31,135 (reported on 23.3% of returns )Here:
+$31,135State:
+$39,590
(% of AGI for various income ranges: 28.0% for AGIs below $25k , 61.1% for AGIs $25k-50k , 150.6% for AGIs $50k-75k , 385.2% for AGIs $75k-100k , 1105.4% for AGIs $100k-200k , 60445.7% for AGIs over 200k ) Profit/loss from business: +$14,756 (reported on 16.7% of returns )Here:
+$14,756State:
+$10,888
(% of AGI for various income ranges: 75.8% for AGIs below $25k , 153.3% for AGIs $25k-50k , 246.5% for AGIs $50k-75k , 642.4% for AGIs $75k-100k , 1097.7% for AGIs $100k-200k , 10081.4% for AGIs over 200k ) Taxable individual retirement arrangement distribution: $30,005 (reported on 2.9% of returns )78705:
$30,005Texas:
$24,740
(% of AGI for various income ranges: 10.5% for AGIs below $25k , 23.3% for AGIs $25k-50k , 99.3% for AGIs $50k-75k , 296.2% for AGIs $75k-100k , 561.9% for AGIs $100k-200k , 3620.0% for AGIs over 200k ) Self-employed (Keogh) retirement plans: $23,000 (reported on 0.8% of returns )78705:
$23,000Texas:
$29,298
(% of AGI for various income ranges: 1642.9% for AGIs over 200k ) Total itemized deductions: $34,683 (reported on 5.4% of returns )Here:
$34,683State:
$40,428
(% of AGI for various income ranges: 73.5% for AGIs $25k-50k , 169.6% for AGIs $50k-75k , 329.5% for AGIs $75k-100k , 936.9% for AGIs $100k-200k , 10810.0% for AGIs over 200k ) Charity contributions: $15,554 (reported on 3.9% of returns )Here:
$15,554State:
$18,201
(% of AGI for various income ranges: 66.1% for AGIs $50k-75k , 191.2% for AGIs $100k-200k , 4557.1% for AGIs over 200k ) Taxes paid: $8,568 (reported on 5.1% of returns )(% of AGI for various income ranges: 17.6% for AGIs $25k-50k , 46.7% for AGIs $50k-75k , 81.9% for AGIs $75k-100k , 298.1% for AGIs $100k-200k , 2150.0% for AGIs over 200k ) Earned income credit: $747 (reported on 5.7% of returns )(% of AGI for various income ranges: 8.5% for AGIs below $25k , 5.4% for AGIs $25k-50k ) Percentage of individuals using paid preparers for their 2020 taxes: 93.8%(% for various income ranges: 93.8% for AGIs below $25k , 94.0% for AGIs $25k-50k , 94.7% for AGIs $50k-75k , 94.1% for AGIs $75k-100k , 91.7% for AGIs $100k-200k , 94.1% for AGIs over 200k )
Averages for the 2012 tax year for zip code 78705, filed in 2013:
Average Adjusted Gross Income (AGI) in 2012: $51,304 (Individual Income Tax Returns) Here:
$51,304State:
$65,384
Salary/wage: $36,395 (reported on 89.5% of returns )Here:
$36,395State:
$52,524
(% of AGI for various income ranges: 89.4% for AGIs below $25k , 87.6% for AGIs $25k-50k , 77.7% for AGIs $50k-75k , 77.9% for AGIs $75k-100k , 68.0% for AGIs $100k-200k , 41.8% for AGIs over 200k ) Taxable interest for individuals: $2,032 (reported on 27.4% of returns )This zip code:
$2,032Texas:
$2,372
(% of AGI for various income ranges: 0.4% for AGIs below $25k , 0.4% for AGIs $25k-50k , 0.7% for AGIs $50k-75k , 0.5% for AGIs $75k-100k , 1.2% for AGIs $100k-200k , 1.6% for AGIs over 200k ) Ordinary dividends: $6,945 (reported on 22.4% of returns )(% of AGI for various income ranges: 3.3% for AGIs below $25k , 2.1% for AGIs $25k-50k , 3.8% for AGIs $50k-75k , 1.9% for AGIs $75k-100k , 3.3% for AGIs $100k-200k , 3.2% for AGIs over 200k ) Net capital gain/loss in AGI: +$24,289 (reported on 18.1% of returns )Here:
+$24,289State:
+$35,319
(% of AGI for various income ranges: 0.5% for AGIs below $25k , 1.3% for AGIs $25k-50k , 2.0% for AGIs $50k-75k , 0.7% for AGIs $75k-100k , 2.9% for AGIs $100k-200k , 17.7% for AGIs over 200k ) Profit/loss from business: +$26,410 (reported on 16.3% of returns )Here:
+$26,410State:
+$13,732
(% of AGI for various income ranges: 6.2% for AGIs below $25k , 3.9% for AGIs $25k-50k , 6.3% for AGIs $50k-75k , 7.0% for AGIs $75k-100k , 7.7% for AGIs $100k-200k , 11.3% for AGIs over 200k ) Taxable individual retirement arrangement distribution: $23,711 (reported on 3.3% of returns )78705:
$23,711Texas:
$19,511
(% of AGI for various income ranges: 0.4% for AGIs below $25k , 0.6% for AGIs $25k-50k , 1.5% for AGIs $50k-75k , 2.4% for AGIs $100k-200k , 2.0% for AGIs over 200k ) Self-employment retirement plans: $20,917 (reported on 1.1% of returns )78705:
$20,917Texas:
$23,938
Total itemized deductions: $30,927 (15% of AGI, reported on 13.9% of returns )Here:
$30,927State:
$24,724
Here:
15.0% of AGIState:
15.9% of AGI
(% of AGI for various income ranges: 2.5% for AGIs below $25k , 3.4% for AGIs $25k-50k , 8.2% for AGIs $50k-75k , 9.3% for AGIs $75k-100k , 12.9% for AGIs $100k-200k , 9.9% for AGIs over 200k ) Charity contributions: $8,211 (reported on 10.2% of returns )(% of AGI for various income ranges: 0.1% for AGIs below $25k , 0.4% for AGIs $25k-50k , 1.4% for AGIs $50k-75k , 0.8% for AGIs $75k-100k , 1.8% for AGIs $100k-200k , 2.5% for AGIs over 200k ) Taxes paid: $10,306 (reported on 13.1% of returns )78705:
$10,306State:
$6,921
(% of AGI for various income ranges: 1.0% for AGIs below $25k , 1.0% for AGIs $25k-50k , 2.6% for AGIs $50k-75k , 3.5% for AGIs $75k-100k , 5.1% for AGIs $100k-200k , 2.6% for AGIs over 200k ) Earned income credit: $683 (reported on 7.8% of returns )(% of AGI for various income ranges: 0.8% for AGIs below $25k ) Percentage of individuals using paid preparers for their 2012 taxes: 25.5%(% for various income ranges: 20.9% for AGIs below $25k , 19.2% for AGIs $25k-50k , 30.6% for AGIs $50k-75k , 36.8% for AGIs $75k-100k , 50.0% for AGIs $100k-200k , 69.6% for AGIs over 200k )
Averages for the 2004 tax year for zip code 78705, filed in 2005:
Average Adjusted Gross Income (AGI) in 2004: $48,610 (Individual Income Tax Returns) Here:
$48,610State:
$47,881
Salary/wage: $28,675 (reported on 88.8% of returns )Here:
$28,675State:
$41,947
(% of AGI for various income ranges: 114.3% for AGIs below $10k , 91.2% for AGIs $10k-25k , 89.5% for AGIs $25k-50k , 73.8% for AGIs $50k-75k , 69.4% for AGIs $75k-100k , 31.3% for AGIs over 100k ) Taxable interest for individuals: $3,084 (reported on 33.6% of returns )This zip code:
$3,084Texas:
$2,255
(% of AGI for various income ranges: 1.9% for AGIs below $10k , 1.1% for AGIs $10k-25k , 0.6% for AGIs $25k-50k , 1.9% for AGIs $50k-75k , 1.8% for AGIs $75k-100k , 2.7% for AGIs over 100k ) Taxable dividends: $6,279 (reported on 20.9% of returns )(% of AGI for various income ranges: 2.7% for AGIs below $10k , 1.0% for AGIs $10k-25k , 0.9% for AGIs $25k-50k , 2.1% for AGIs $50k-75k , 2.2% for AGIs $75k-100k , 3.5% for AGIs over 100k ) Net capital gain/loss: +$42,107 (reported on 18.1% of returns )Here:
+$42,107State:
+$16,110
(% of AGI for various income ranges: -1.0% for AGIs below $10k , 0.8% for AGIs $10k-25k , 0.8% for AGIs $25k-50k , 1.4% for AGIs $50k-75k , 2.6% for AGIs $75k-100k , 25.0% for AGIs over 100k ) Profit/loss from business: +$19,179 (reported on 13.1% of returns )Here:
+$19,179State:
+$11,013
(% of AGI for various income ranges: 3.1% for AGIs below $10k , 4.1% for AGIs $10k-25k , 4.1% for AGIs $25k-50k , 8.0% for AGIs $50k-75k , 9.7% for AGIs $75k-100k , 4.9% for AGIs over 100k ) IRA payment deduction: $3,045 (reported on 1.9% of returns )(% of AGI for various income ranges: 0.3% for AGIs $10k-25k , 0.2% for AGIs $25k-50k , 0.3% for AGIs $50k-75k , 0.1% for AGIs over 100k ) Self-employed pension: $15,466 (reported on 1.2% of returns )Here:
$15,466Texas:
$16,401
(% of AGI for various income ranges: 0.2% for AGIs $10k-25k , 0.9% for AGIs $50k-75k , 0.5% for AGIs over 100k ) Total itemized deductions: $20,644 (14% of AGI, reported on 18.2% of returns )Here:
$20,644State:
$19,631
Here:
14.2% of AGIState:
18.9% of AGI
(% of AGI for various income ranges: 7.7% for AGIs below $10k , 5.1% for AGIs $10k-25k , 5.0% for AGIs $25k-50k , 11.4% for AGIs $50k-75k , 15.8% for AGIs $75k-100k , 7.6% for AGIs over 100k ) Charity contributions deductions: $7,139 (5% of AGI, reported on 12.2% of returns )Here:
4.8% of AGIState:
4.2% of AGI
(% of AGI for various income ranges: 0.2% for AGIs below $10k , 0.3% for AGIs $10k-25k , 0.5% for AGIs $25k-50k , 1.6% for AGIs $50k-75k , 2.4% for AGIs $75k-100k , 2.3% for AGIs over 100k ) Total tax: $10,636 (reported on 70.1% of returns )78705:
$10,636State:
$9,058
(% of AGI for various income ranges: 2.5% for AGIs below $10k , 6.0% for AGIs $10k-25k , 9.6% for AGIs $25k-50k , 12.8% for AGIs $50k-75k , 14.3% for AGIs $75k-100k , 19.1% for AGIs over 100k ) Earned income credit: $501 (reported on 7.3% of returns )Percentage of individuals using paid preparers for their 2004 taxes: 24.0%(% for various income ranges: 15.9% for AGIs below $10k , 18.9% for AGIs $10k-25k , 24.5% for AGIs $25k-50k , 39.8% for AGIs $50k-75k , 45.3% for AGIs $75k-100k , 63.4% for AGIs over 100k )
Estimated median household income in 2022: This zip code:
$23,878Texas:
$72,284
Nearest zip codes: 78712 ,
78751 ,
78701 ,
78722 ,
78703 ,
78756 .
Austin Zip Code Map
Percentage of family households: This zip code:
11.3%Texas:
50.5%
Percentage of households with unmarried partners: This zip code:
5.6%Texas:
48.7%
Likely homosexual households (counted as self-reported same-sex unmarried-partner households)
Lesbian couples: 0.7% of all households Gay men: 0.1% of all households
Household received Food Stamps/SNAP in the past 12 months: 132Household did not receive Food Stamps/SNAP in the past 12 months: 10,437
Women who had a birth in the past 12 months: 138 (127 now married , 12 unmarried) Women who did not have a birth in the past 12 months: 17,038 (678 now married , 16,575 unmarried)
Housing units in zip code 78705 with a mortgage: 535 (8
second mortgage , 9
both second mortgage and home equity loan )
Median monthly owner costs for units with a mortgage: $2,181
Median monthly owner costs for units without a mortgage: $1,118
Residents with income below the poverty level in 2022:
This zip code:
56.9%Whole state:
14.0%
Residents with income below 50% of the poverty level in 2022:
This zip code:
10.2%Whole state:
7.4%
Median number of rooms in houses and condos: Median number of rooms in apartments: Notable locations in this zip code not listed on our city pages
Click to draw/clear zip code borders Notable locations in zip code 78705: (A) , Saint David's Rehabilitation Center (B) , Goodall Wooten House (C) , J Frank Dobie House (D) , John M and Ula H Payne House (E) , Andrews Dormitory (F) , Austin Fire Station Number 3 (G) , Batts Hall (H) , Beauford H Jester Center (I) , Behnken Hall (J) , Benedict Hall (K) , Bernard and Audre Rapoport Building (L) , Beto Academic Center (M) , Blanton Dormitory (N) , Bokenkamp Student Center (O) , Brackenridge Hall Dormitory (P) , Calhoun Hall (Q) , Carothers Dormitory (R) , Connally Center for Justice (S) , E P Schoch Building (T) . Display/hide their locations on the map
Shopping Center: (1) . Display/hide its location on the map
Churches in zip code 78705 include: (A) , Saint Austins Catholic Church (B) , University Lutheran Church (C) , First English Lutheran Church (D) , Redeemer Presbyterian Church (E) , The Church of Jesus Christ of Latter Day Saints (F) , Hill Country Bible Church (G) , Hubbard Dianetics Foundation (H) , Intervarsity Christian Church (I) . Display/hide their locations on the map
Parks in zip code 78705 include: (1) , Pease Park (2) , Bailey Park (3) , Fascholz-Keller Baseball Complex (4) , Adams Park (5) , Hemphill Park (6) . Display/hide their locations on the map
Tourist attraction (not listed on the city page) :
Year house built (houses)
21 2020 or later2,687 2010 to 20192,388 2000 to 20091,411 1990 to 19991,369 1980 to 19891,510 1970 to 1979613 1960 to 1969353 1950 to 1959341 1940 to 19491,354 1939 or earlier
Zip code 78705 household income distribution in 2022 3,788 Less than $10,000915 $10,000 to $14,999352 $15,000 to $19,999642 $20,000 to $24,999436 $25,000 to $29,999258 $30,000 to $34,999282 $35,000 to $39,999348 $40,000 to $44,999221 $45,000 to $49,999260 $50,000 to $59,999798 $60,000 to $74,999435 $75,000 to $99,999636 $100,000 to $124,999542 $125,000 to $149,999393 $150,000 to $199,999535 $200,000 or moreEstimate of home value of owner-occupied houses/condos in 2022 in zip code 78705 11 $100,000 to $124,99944 $125,000 to $149,99925 $175,000 to $199,99985 $200,000 to $249,999202 $250,000 to $299,999108 $300,000 to $399,999157 $400,000 to $499,999252 $500,000 to $749,999253 $750,000 to $999,999218 $1,000,000 to $1,499,99927 $1,500,000 to $1,999,999106 $2,000,000 or moreRent paid by renters in 2022 in zip code 78705 31 $250 to $2999 $500 to $54959 $550 to $59967 $600 to $64944 $650 to $699150 $700 to $74977 $750 to $799154 $800 to $899680 $900 to $9992,372 $1,000 to $1,2491,495 $1,250 to $1,4992,523 $1,500 to $1,9991,191 $2,000 to $2,499416 $2,500 to $2,99984 $3,000 to $3,499256 $3,500 or more141 No cash rent
Median gross rent in 2022: $1,525.
Median price asked for vacant for-sale houses and condos in 2022: $850,942.
Estimated median house (or condo) value in 2022 for: White Non-Hispanic householders: $733,685Black or African American householders: $637,469Asian householders: $968,953Some other race householders: $114,914Two or more races householders: $1,076,728Hispanic or Latino householders: $368,202Estimated median house or condo value in 2022: $571,513
78705:
$571,513Texas:
$275,400
Lower value quartile - upper value quartile: $324,303 - $1,050,656
Mean price in 2022: Detached houses: $737,673Here:
$737,673State:
$369,058
Townhouses or other attached units: $533,017Here:
$533,017State:
$327,631
In 2-unit structures: $1,093,219Here:
$1,093,219State:
$374,947
In 3-to-4-unit structures: $301,152Here:
$301,152State:
$209,652
In 5-or-more-unit structures: $800,345Here:
$800,345State:
$413,944
Mobile homes: $105,214Here:
$105,214State:
$124,413
Housing units in structures:
One, detached: 1,676One, attached: 179Two: 4993 or 4: 4555 to 9: 76310 to 19: 1,41320 to 49: 2,06450 or more: 5,685Unemployment : 8.7%
Means of transportation to work in zip code 78705 39.9% 5,887 Drove a car alone6.6% 969 Carpooled3.1% 454 Bus or trolley bus0.2% 32 Streetcar or trolley car0.1% 19 Railroad0.1% 10 Ferryboat0.7% 97 Taxi0.8% 112 Motorcycle3.3% 487 Bicycle27.8% 4,106 Walked1.1% 164 Other means18.7% 2,766 Worked at homeTravel time to work (commute) in zip code 78705 643 Less than 5 minutes2,052 5 to 9 minutes2,430 10 to 14 minutes2,846 15 to 19 minutes1,889 20 to 24 minutes515 25 to 29 minutes1,124 30 to 34 minutes26 35 to 39 minutes224 40 to 44 minutes177 45 to 59 minutes179 60 to 89 minutes44 90 or more minutes
Neighborhoods in zip code 78705: Percentage of zip code residents living and working in this county: 93.8%
Household type by relationship:
Households: 33,521
Male householders: 5,450 (2,629 living alone ), Female householders: 5,173 (1,995 living alone )890 spouses (779 opposite-sex spouses ), 1,047 unmarried partners , (941 opposite-sex unmarried partners ), 515 children (484 natural , 11 adopted , 19 stepchildren ), 0 grandchildren , 366 brothers or sisters , 255 parents , 0 foster children , 19 other relatives , 5,797 non-relatives In group quarters: 13,150 (-1 institutionalized population )
Size of family households: 851 2-persons , 463 3-persons , 157 4-persons , 4 5-persons
Size of nonfamily households: 4,625 1-person , 3,143 2-persons , 802 3-persons , 656 4-persons , 123 5-persons , 44 6-persons
220 married couples with children. single-parent households (30 men , 88 women ).
72.1% of residents of 78705 zip code speak English at home. of residents speak Spanish at home (85% very well, 11% well, 4% not well ).of residents speak other Indo-European language at home (91% very well, 3% well, 6% not well ).of residents speak Asian or Pacific Island language at home (89% very well, 6% well, 5% not well ).of residents speak other language at home (83% very well, 5% well, 12% not well ).
Foreign born population: 4,460 (13.3%)
(38.3%
of them are naturalized citizens )
This zip code:
13.3%Whole state:
17.2%
8% Honduras 7% Japan 7% Kazakhstan 6% Bhutan 5% Azores Islands 4% Colombia 3% Thailand 6% German 5% English 4% Irish 3% American 3% European 2% Italian 2% Arab
Year of entry for the foreign-born population
3,083 2010 or later 1,456 2000 to 2009 579 1990 to 1999 365 Before 1990
There are
133 Nurse Anesthetists 129 Internal Medicine Specialists 122 Anesthesiologists 689 Other Medical Specialists in Zip Code 78705.
Facilities with environmental interests located in this zip code:
ASCENSION HEALTH (1201 W 38TH STREET in AUSTIN, TX)
Small Quantity Generators, between 100 kg and 1000 kg of hazardous waste/month (Resource Conservation and Recovery Act (tracking hazardous waste)) - notification Organizations: ASCENSION HEALTH DBA SETON HEALTHCARE (CONTACT/OPERATOR)
Alternative names: SETON MEDICAL CENTER
AUSTIN NEURO DIAGNOSTICS (1111 W 34TH STREET in AUSTIN, TX)
(Resource Conservation and Recovery Act (tracking hazardous waste))
Housing units lacking complete plumbing facilities: 0.6%
Housing units lacking complete kitchen facilities: 2.4%
71.7% Electricity 26.1% Utility gas 1.1% Bottled, tank, or LP gas 1.0% No fuel used
Population in 1990: 23,679. Population change in the 1990s: +3,146 (+13.3%).
Place of birth for U.S.-born residents:
This state: 18,916Northeast: 1,633Midwest: 2,155South: 2,764West: 2,935
10% of the 78705 zip code residents lived in the same house 5 years ago.
Out of people who lived in different houses, 17% lived in this county.
Out of people who lived in different counties, 50% lived in Texas.
61% of the 78705 zip code residents lived in the same house 1 year ago.
Out of people who lived in different houses, 38% moved from this county.
Out of people who lived in different houses, 21% moved from different county within same state.
Out of people who lived in different houses, 28% moved from different state.
Out of people who lived in different houses, 14% moved from abroad.
Private vs. public school enrollment:
Students in private schools in grades 1 to 8 (elementary and middle school): 5
Students in private schools in grades 9 to 12 (high school): 54
Students in private undergraduate colleges: 3,756
Occupation by median earnings in the past 12 months ($)
67,907 Health diagnosing and treating practitioners and other technical occupations 66,884 Management occupations 39,360 Computer and mathematical occupations 37,139 Community and social service occupations 36,866 Business and financial operations occupations 36,398 Law enforcement workers including supervisors
Companies with federal contracts located in this zip code:
STEVEN M. FASS (3705 MEDICAL PKWY in AUSTIN, TX)
$36,200 with Offices, Boards and Divisions (includes Attorney General, Deputy Attorney General, etc.) for Expert Witness. Signed on 2005-01-30. Completion date: 2006-04-30.
DOBIE CENTER PROPERTIES, LTD (2021 GUADALUPE ST in AUSTIN, TX; small business)
$12,060 with Army for Lease or Rental of Facilities -- Other Non-Building Facilities. Signed on 2004-11-30. Completion date: 2003-10-27.
AUSTIN PRESBYTERIAN THEOLOGICA (100 E 27TH ST in AUSTIN, TX) in 2 contracts in 2004
$0 with Army for Educational Services. Signed on 2004-07-26. Completion date: 2000-03-30.
, same as above. Signed on 2004-07-26. Completion date: 2000-03-30.
Top industries in this zip code by the number of employees in 2005:
Health Care and Social Assistance: General Medical and Surgical Hospitals (over 1000 employees: 2 establishments)Health Care and Social Assistance: Offices of Physicians (except Mental Health Specialists) (100-249: 1, 50-99: 4, 20-49: 26, 10-19: 23, 5-9: 47, 1-4: 110)Accommodation and Food Services: Limited-Service Restaurants (50-99: 2, 20-49: 14, 10-19: 15, 5-9: 4, 1-4: 11)Accommodation and Food Services: Full-Service Restaurants (50-99: 5, 20-49: 2, 10-19: 10, 5-9: 4, 1-4: 8)Other Services (except Public Administration): Religious Organizations (100-249: 1, 50-99: 2, 20-49: 5, 10-19: 3, 5-9: 3, 1-4: 8)Health Care and Social Assistance: Offices of Physical, Occupational and Speech Therapists, and Audiologists (250-499: 1, 5-9: 1)Educational Services: Junior Colleges (250-499: 1)Health Care and Social Assistance: Diagnostic Imaging Centers (50-99: 2, 20-49: 2, 10-19: 2, 5-9: 2, 1-4: 3)Accommodation and Food Services: Rooming and Boarding Houses (50-99: 1, 20-49: 1, 10-19: 3, 5-9: 10, 1-4: 11)
People in group quarters in 2010:
10,707 people in college/university student housing
199 people in hospitals with patients who have no usual home elsewhere
81 people in other noninstitutional facilities
35 people in residential treatment centers for juveniles (non-correctional)
35 people in mental (psychiatric) hospitals and psychiatric units in other hospitals
33 people in group homes intended for adults
13 people in emergency and transitional shelters (with sleeping facilities) for people experiencing homelessness
People in group quarters in 2000:
8,290 people in college dormitories (includes college quarters off campus)
547 people in other nonhousehold living situations
343 people in mental (psychiatric) hospitals or wards
178 people in job corps and vocational training facilities
102 people in homes or halfway houses for drug/alcohol abuse
31 people in other noninstitutional group quarters
18 people in nursing homes
12 people in other group homes
8 people in religious group quarters
Fatal accident statistics in 2013:
Fatal accident count: 1Vehicles involved in fatal accidents: 2Fatal accidents caused by drunken drivers: 0Fatalities: 1Persons involved in fatal accidents: 2Pedestrians involved in fatal accidents: 0
Fatal accident statistics in 2012:
Fatal accident count: 1Vehicles involved in fatal accidents: 2Fatal accidents caused by drunken drivers: 0Fatalities: 1Persons involved in fatal accidents: 2Pedestrians involved in fatal accidents: 2
Home Mortgage Disclosure Act Aggregated Statistics For Year 2009(Based on 7 full and 6 partial tracts) A) FHA, FSA/RHS & VA B) Conventional C) Refinancings D) Home Improvement Loans E) Loans on Dwellings For 5+ Families F) Non-occupant Loans on Number Average Value Number Average Value Number Average Value Number Average Value Number Average Value Number Average Value
LOANS ORIGINATED 26 $205,383 196 $210,402 325 $238,797 17 $208,625 10 $2,169,547 167 $197,406 APPLICATIONS APPROVED, NOT ACCEPTED 1 $303,230 11 $202,332 30 $193,924 1 $23,730 0 $0 15 $177,077 APPLICATIONS DENIED 14 $118,048 58 $170,705 75 $213,779 3 $81,763 2 $15,797,695 67 $182,307 APPLICATIONS WITHDRAWN 5 $170,680 37 $228,425 72 $225,051 4 $8,710 2 $62,384,450 52 $191,246 FILES CLOSED FOR INCOMPLETENESS 0 $0 5 $127,114 20 $276,550 3 $42,270 0 $0 4 $124,642
Aggregated Statistics For Year 2008(Based on 7 full and 6 partial tracts) A) FHA, FSA/RHS & VA B) Conventional C) Refinancings D) Home Improvement Loans E) Loans on Dwellings For 5+ Families F) Non-occupant Loans on G) Loans On Manufactured Number Average Value Number Average Value Number Average Value Number Average Value Number Average Value Number Average Value Number Average Value
LOANS ORIGINATED 7 $177,821 399 $223,523 155 $245,653 26 $100,585 12 $1,830,459 279 $220,626 0 $0 APPLICATIONS APPROVED, NOT ACCEPTED 1 $470,320 46 $192,797 11 $138,259 5 $54,656 2 $697,690 21 $215,987 0 $0 APPLICATIONS DENIED 1 $123,770 99 $163,054 79 $209,180 28 $66,560 2 $750,325 87 $160,060 2 $29,000 APPLICATIONS WITHDRAWN 1 $145,430 73 $180,805 38 $225,013 5 $64,158 0 $0 59 $166,141 0 $0 FILES CLOSED FOR INCOMPLETENESS 0 $0 6 $201,438 13 $210,725 2 $97,840 0 $0 8 $134,916 0 $0
Aggregated Statistics For Year 2007(Based on 7 full and 6 partial tracts) A) FHA, FSA/RHS & VA B) Conventional C) Refinancings D) Home Improvement Loans E) Loans on Dwellings For 5+ Families F) Non-occupant Loans on Number Average Value Number Average Value Number Average Value Number Average Value Number Average Value Number Average Value
LOANS ORIGINATED 2 $167,355 727 $170,537 152 $222,837 22 $67,539 15 $6,142,293 544 $168,575 APPLICATIONS APPROVED, NOT ACCEPTED 1 $169,150 111 $145,329 18 $161,633 6 $51,110 1 $65,865,000 80 $128,647 APPLICATIONS DENIED 2 $59,000 100 $200,538 66 $211,551 13 $65,068 0 $0 87 $192,430 APPLICATIONS WITHDRAWN 0 $0 68 $151,091 32 $193,633 6 $34,703 1 $2,600,000 55 $152,526 FILES CLOSED FOR INCOMPLETENESS 0 $0 28 $202,679 11 $353,125 1 $40,760 0 $0 17 $200,456
Aggregated Statistics For Year 2006(Based on 7 full and 6 partial tracts) A) FHA, FSA/RHS & VA B) Conventional C) Refinancings D) Home Improvement Loans E) Loans on Dwellings For 5+ Families F) Non-occupant Loans on G) Loans On Manufactured Number Average Value Number Average Value Number Average Value Number Average Value Number Average Value Number Average Value Number Average Value
LOANS ORIGINATED 2 $154,490 945 $161,221 119 $232,552 30 $126,032 34 $834,758 657 $153,796 0 $0 APPLICATIONS APPROVED, NOT ACCEPTED 0 $0 132 $151,773 26 $184,625 9 $26,934 4 $1,853,515 92 $140,012 2 $102,000 APPLICATIONS DENIED 0 $0 216 $168,602 73 $188,268 14 $266,794 0 $0 188 $150,605 0 $0 APPLICATIONS WITHDRAWN 0 $0 110 $176,289 40 $145,911 5 $92,802 4 $395,388 73 $166,608 0 $0 FILES CLOSED FOR INCOMPLETENESS 0 $0 28 $199,788 12 $213,267 1 $257,850 2 $418,615 20 $202,840 0 $0
Aggregated Statistics For Year 2005(Based on 7 full and 6 partial tracts) A) FHA, FSA/RHS & VA B) Conventional C) Refinancings D) Home Improvement Loans E) Loans on Dwellings For 5+ Families F) Non-occupant Loans on G) Loans On Manufactured Number Average Value Number Average Value Number Average Value Number Average Value Number Average Value Number Average Value Number Average Value
LOANS ORIGINATED 4 $137,048 773 $144,962 175 $211,034 28 $78,503 29 $753,413 526 $151,533 2 $21,525 APPLICATIONS APPROVED, NOT ACCEPTED 3 $138,377 56 $131,385 27 $217,901 3 $263,367 0 $0 39 $154,011 0 $0 APPLICATIONS DENIED 0 $0 154 $132,690 52 $184,732 8 $53,995 2 $953,940 101 $155,572 6 $38,625 APPLICATIONS WITHDRAWN 0 $0 92 $154,693 38 $179,151 10 $267,990 1 $4,981,900 63 $170,377 0 $0 FILES CLOSED FOR INCOMPLETENESS 0 $0 27 $123,002 16 $199,011 0 $0 0 $0 21 $141,575 0 $0
Aggregated Statistics For Year 2004(Based on 7 full and 4 partial tracts) A) FHA, FSA/RHS & VA B) Conventional C) Refinancings D) Home Improvement Loans E) Loans on Dwellings For 5+ Families F) Non-occupant Loans on G) Loans On Manufactured Number Average Value Number Average Value Number Average Value Number Average Value Number Average Value Number Average Value Number Average Value
LOANS ORIGINATED 9 $130,406 597 $123,811 327 $188,779 27 $98,051 24 $1,398,857 492 $144,485 1 $72,200 APPLICATIONS APPROVED, NOT ACCEPTED 0 $0 65 $128,772 48 $125,353 8 $32,872 0 $0 57 $131,535 0 $0 APPLICATIONS DENIED 0 $0 113 $96,296 99 $150,951 15 $108,125 0 $0 94 $93,805 0 $0 APPLICATIONS WITHDRAWN 2 $111,540 83 $127,525 101 $167,220 11 $136,507 0 $0 74 $125,601 0 $0 FILES CLOSED FOR INCOMPLETENESS 1 $161,000 19 $98,066 27 $160,520 2 $14,950 0 $0 14 $111,659 0 $0
Aggregated Statistics For Year 2003(Based on 7 full and 6 partial tracts) A) FHA, FSA/RHS & VA B) Conventional C) Refinancings D) Home Improvement Loans E) Loans on Dwellings For 5+ Families F) Non-occupant Loans on Number Average Value Number Average Value Number Average Value Number Average Value Number Average Value Number Average Value
LOANS ORIGINATED 13 $102,728 566 $139,589 757 $156,994 43 $79,948 36 $2,812,131 553 $126,039 APPLICATIONS APPROVED, NOT ACCEPTED 0 $0 48 $155,076 84 $179,650 8 $50,832 0 $0 38 $138,661 APPLICATIONS DENIED 9 $105,392 90 $111,930 205 $173,056 13 $83,100 2 $900,000 132 $134,295 APPLICATIONS WITHDRAWN 1 $164,860 70 $150,615 155 $155,125 5 $53,490 0 $0 71 $139,112 FILES CLOSED FOR INCOMPLETENESS 1 $74,000 22 $147,323 21 $159,912 1 $38,040 0 $0 14 $119,958
Aggregated Statistics For Year 2002(Based on 7 full and 4 partial tracts) A) FHA, FSA/RHS & VA B) Conventional C) Refinancings D) Home Improvement Loans E) Loans on Dwellings For 5+ Families F) Non-occupant Loans on Number Average Value Number Average Value Number Average Value Number Average Value Number Average Value Number Average Value
LOANS ORIGINATED 14 $141,015 430 $129,517 546 $167,903 47 $50,530 24 $1,049,842 424 $132,159 APPLICATIONS APPROVED, NOT ACCEPTED 0 $0 48 $174,298 74 $146,898 14 $70,986 0 $0 53 $113,915 APPLICATIONS DENIED 0 $0 62 $104,349 94 $128,554 9 $46,553 3 $941,060 80 $116,333 APPLICATIONS WITHDRAWN 6 $118,580 48 $119,602 96 $196,812 1 $54,350 0 $0 44 $161,096 FILES CLOSED FOR INCOMPLETENESS 2 $84,140 22 $143,078 23 $174,599 2 $48,840 1 $1,315,040 14 $121,092
Aggregated Statistics For Year 2001(Based on 7 full and 6 partial tracts) A) FHA, FSA/RHS & VA B) Conventional C) Refinancings D) Home Improvement Loans E) Loans on Dwellings For 5+ Families F) Non-occupant Loans on Number Average Value Number Average Value Number Average Value Number Average Value Number Average Value Number Average Value
LOANS ORIGINATED 22 $123,387 403 $132,934 348 $176,763 56 $57,126 26 $601,730 263 $120,699 APPLICATIONS APPROVED, NOT ACCEPTED 2 $99,795 47 $81,320 65 $175,889 15 $61,994 0 $0 37 $127,919 APPLICATIONS DENIED 2 $112,980 105 $111,147 70 $164,954 29 $54,561 3 $1,090,127 60 $134,190 APPLICATIONS WITHDRAWN 8 $137,101 40 $144,975 53 $117,108 2 $6,795 1 $1,175,000 23 $84,894 FILES CLOSED FOR INCOMPLETENESS 0 $0 13 $59,212 24 $219,134 0 $0 0 $0 9 $115,606
Aggregated Statistics For Year 2000(Based on 7 full and 6 partial tracts) A) FHA, FSA/RHS & VA B) Conventional C) Refinancings D) Home Improvement Loans E) Loans on Dwellings For 5+ Families F) Non-occupant Loans on Number Average Value Number Average Value Number Average Value Number Average Value Number Average Value Number Average Value
LOANS ORIGINATED 19 $94,545 480 $125,520 80 $172,346 41 $64,332 38 $484,846 172 $117,319 APPLICATIONS APPROVED, NOT ACCEPTED 1 $115,520 65 $101,472 13 $91,179 24 $59,600 0 $0 25 $99,528 APPLICATIONS DENIED 2 $34,035 125 $101,216 21 $192,462 17 $50,112 3 $355,400 37 $101,357 APPLICATIONS WITHDRAWN 1 $56,730 36 $92,164 17 $142,961 15 $28,763 0 $0 11 $98,146 FILES CLOSED FOR INCOMPLETENESS 1 $101,450 9 $130,666 8 $169,232 0 $0 0 $0 1 $49,000
Aggregated Statistics For Year 1999(Based on 3 full and 4 partial tracts) A) FHA, FSA/RHS & VA B) Conventional C) Refinancings D) Home Improvement Loans E) Loans on Dwellings For 5+ Families F) Non-occupant Loans on Number Average Value Number Average Value Number Average Value Number Average Value Number Average Value Number Average Value
LOANS ORIGINATED 21 $99,883 303 $108,508 95 $119,161 43 $49,049 22 $457,566 181 $97,529 APPLICATIONS APPROVED, NOT ACCEPTED 2 $94,035 29 $134,003 19 $92,746 14 $27,936 0 $0 21 $74,979 APPLICATIONS DENIED 0 $0 95 $104,440 22 $192,329 12 $27,627 0 $0 48 $91,430 APPLICATIONS WITHDRAWN 2 $108,000 36 $103,777 17 $108,671 6 $35,712 1 $130,000 19 $73,603 FILES CLOSED FOR INCOMPLETENESS 1 $121,720 11 $130,498 6 $96,413 0 $0 1 $1,040,000 5 $161,260
Private Mortgage Insurance Companies Aggregated Statistics For Year 2009(Based on 7 full and 4 partial tracts) A) Conventional B) Refinancings C) Non-occupant Loans on Number Average Value Number Average Value Number Average Value
LOANS ORIGINATED 20 $259,048 2 $295,495 2 $260,175 APPLICATIONS APPROVED, NOT ACCEPTED 7 $216,661 1 $288,790 1 $315,610 APPLICATIONS DENIED 6 $265,965 4 $288,048 2 $193,360 APPLICATIONS WITHDRAWN 0 $0 0 $0 0 $0 FILES CLOSED FOR INCOMPLETENESS 1 $225,880 2 $604,000 0 $0
Aggregated Statistics For Year 2008(Based on 5 full and 4 partial tracts) A) Conventional B) Refinancings C) Non-occupant Loans on Number Average Value Number Average Value Number Average Value
LOANS ORIGINATED 76 $218,078 9 $335,118 39 $225,086 APPLICATIONS APPROVED, NOT ACCEPTED 28 $212,578 0 $0 13 $158,458 APPLICATIONS DENIED 4 $209,550 0 $0 2 $147,000 APPLICATIONS WITHDRAWN 2 $312,110 0 $0 0 $0 FILES CLOSED FOR INCOMPLETENESS 0 $0 0 $0 0 $0
Aggregated Statistics For Year 2007(Based on 7 full and 4 partial tracts) A) Conventional B) Refinancings C) Non-occupant Loans on Number Average Value Number Average Value Number Average Value
LOANS ORIGINATED 96 $166,990 5 $264,558 59 $168,873 APPLICATIONS APPROVED, NOT ACCEPTED 10 $215,153 0 $0 5 $232,972 APPLICATIONS DENIED 2 $72,760 0 $0 0 $0 APPLICATIONS WITHDRAWN 5 $154,424 0 $0 3 $159,033 FILES CLOSED FOR INCOMPLETENESS 3 $236,277 0 $0 2 $129,570
Aggregated Statistics For Year 2006(Based on 5 full and 4 partial tracts) A) Conventional B) Refinancings C) Non-occupant Loans on Number Average Value Number Average Value Number Average Value
LOANS ORIGINATED 47 $171,789 2 $177,425 35 $160,659 APPLICATIONS APPROVED, NOT ACCEPTED 9 $140,648 0 $0 7 $140,119 APPLICATIONS DENIED 1 $157,610 0 $0 0 $0 APPLICATIONS WITHDRAWN 4 $107,488 0 $0 0 $0 FILES CLOSED FOR INCOMPLETENESS 0 $0 0 $0 0 $0
Aggregated Statistics For Year 2005(Based on 5 full and 4 partial tracts) A) Conventional B) Refinancings C) Non-occupant Loans on Number Average Value Number Average Value Number Average Value
LOANS ORIGINATED 56 $159,102 4 $171,030 37 $143,182 APPLICATIONS APPROVED, NOT ACCEPTED 12 $144,448 2 $127,580 9 $134,783 APPLICATIONS DENIED 0 $0 0 $0 0 $0 APPLICATIONS WITHDRAWN 1 $180,000 0 $0 1 $180,000 FILES CLOSED FOR INCOMPLETENESS 1 $185,000 0 $0 0 $0
Aggregated Statistics For Year 2004(Based on 7 full and 4 partial tracts) A) Conventional B) Refinancings C) Non-occupant Loans on Number Average Value Number Average Value Number Average Value
LOANS ORIGINATED 70 $161,655 11 $240,015 43 $167,202 APPLICATIONS APPROVED, NOT ACCEPTED 28 $147,053 5 $230,258 22 $139,845 APPLICATIONS DENIED 0 $0 0 $0 0 $0 APPLICATIONS WITHDRAWN 6 $159,398 5 $376,590 8 $225,449 FILES CLOSED FOR INCOMPLETENESS 1 $192,000 1 $157,800 0 $0
Aggregated Statistics For Year 2003(Based on 5 full and 6 partial tracts) A) Conventional B) Refinancings C) Non-occupant Loans on Number Average Value Number Average Value Number Average Value
LOANS ORIGINATED 126 $138,171 14 $161,604 89 $117,135 APPLICATIONS APPROVED, NOT ACCEPTED 25 $145,434 5 $147,520 11 $89,115 APPLICATIONS DENIED 2 $132,505 0 $0 1 $97,000 APPLICATIONS WITHDRAWN 15 $175,389 2 $132,920 10 $150,935 FILES CLOSED FOR INCOMPLETENESS 2 $108,500 0 $0 2 $108,500
Aggregated Statistics For Year 2002(Based on 5 full and 4 partial tracts) A) Conventional B) Refinancings C) Non-occupant Loans on Number Average Value Number Average Value Number Average Value
LOANS ORIGINATED 86 $136,803 15 $184,281 54 $136,501 APPLICATIONS APPROVED, NOT ACCEPTED 31 $111,585 4 $131,235 10 $103,783 APPLICATIONS DENIED 3 $116,443 0 $0 1 $40,760 APPLICATIONS WITHDRAWN 9 $111,110 2 $358,810 4 $76,810 FILES CLOSED FOR INCOMPLETENESS 0 $0 0 $0 0 $0
Aggregated Statistics For Year 2001(Based on 5 full and 4 partial tracts) A) Conventional B) Refinancings C) Non-occupant Loans on Number Average Value Number Average Value Number Average Value
LOANS ORIGINATED 113 $138,917 7 $137,086 46 $110,130 APPLICATIONS APPROVED, NOT ACCEPTED 19 $143,004 2 $129,645 7 $72,731 APPLICATIONS DENIED 4 $118,285 0 $0 1 $68,000 APPLICATIONS WITHDRAWN 2 $96,000 1 $145,830 1 $119,000 FILES CLOSED FOR INCOMPLETENESS 0 $0 0 $0 0 $0
Aggregated Statistics For Year 2000(Based on 5 full and 4 partial tracts) A) Conventional B) Refinancings C) Non-occupant Loans on Number Average Value Number Average Value Number Average Value
LOANS ORIGINATED 130 $118,091 5 $86,286 57 $93,634 APPLICATIONS APPROVED, NOT ACCEPTED 15 $104,243 2 $97,915 7 $92,333 APPLICATIONS DENIED 11 $146,336 1 $287,760 6 $126,025 APPLICATIONS WITHDRAWN 5 $112,604 0 $0 3 $118,570 FILES CLOSED FOR INCOMPLETENESS 1 $125,000 0 $0 1 $125,000
Aggregated Statistics For Year 1999(Based on 3 full and 3 partial tracts) A) Conventional B) Refinancings C) Non-occupant Loans on Number Average Value Number Average Value Number Average Value
LOANS ORIGINATED 77 $105,965 3 $125,643 38 $91,273 APPLICATIONS APPROVED, NOT ACCEPTED 8 $115,805 0 $0 6 $91,665 APPLICATIONS DENIED 7 $106,860 0 $0 2 $96,845 APPLICATIONS WITHDRAWN 5 $131,252 0 $0 0 $0 FILES CLOSED FOR INCOMPLETENESS 3 $108,013 0 $0 0 $0
2002 - 2018 National Fire Incident Reporting System (NFIRS) incidents See full 2006 National Fire Incident Reporting System statistics for zip code 78705, Texas
Most common first names in zip code 78705 among deceased individuals Name Count Lived (average)
Mary 43 84.0 years John 33 71.4 years William 28 68.0 years James 25 72.8 years Margaret 24 79.1 years Charles 22 73.7 years Robert 19 72.2 years Henry 18 78.5 years Helen 15 79.1 years Elizabeth 14 83.0 years
Most common last names in zip code 78705 among deceased individuals Last name Count Lived (average)
Smith 23 77.8 years Brown 13 75.8 years Johnson 11 76.5 years Anderson 11 77.3 years Miller 9 71.6 years Moore 8 79.2 years Williams 8 81.8 years Hill 7 74.6 years Nelson 7 87.6 years Taylor 6 70.8 years
Businesses in zip code 78705
Name Count Name Count
7-Eleven 1 Little Caesars Pizza 1 Blockbuster 1 New Balance 2 Burger King 1 Nike 2 CVS 1 Quiznos 1 Chipotle 1 Rodeway Inn 1 Cinnabon 1 Sprint Nextel 1 Cricket Wireless 1 Starbucks 3 FedEx 12 Subway 4 Jack In The Box 1 UPS 4 Jamba Juice 1 Urban Outfitters 1 Jones New York 3 Vans 1

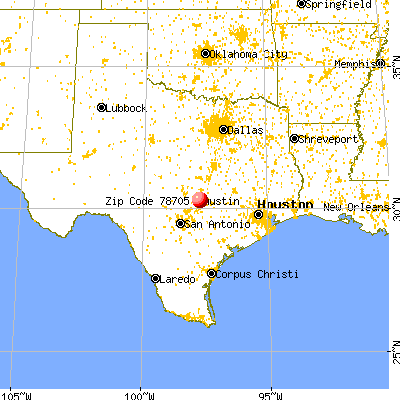


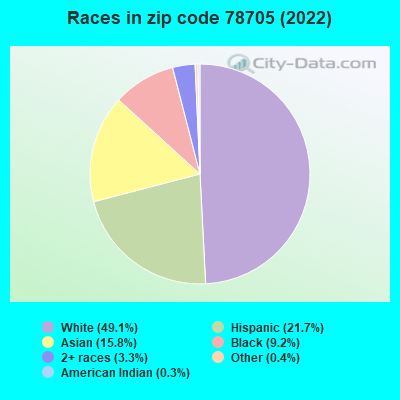


 Nearest zip codes: 78712, 78751, 78701, 78722, 78703, 78756.
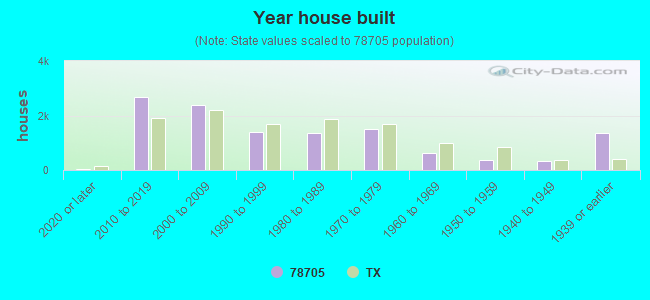


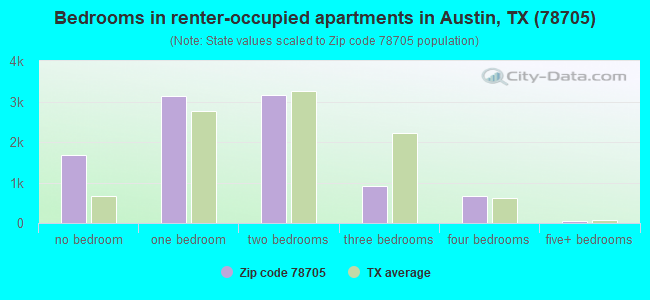
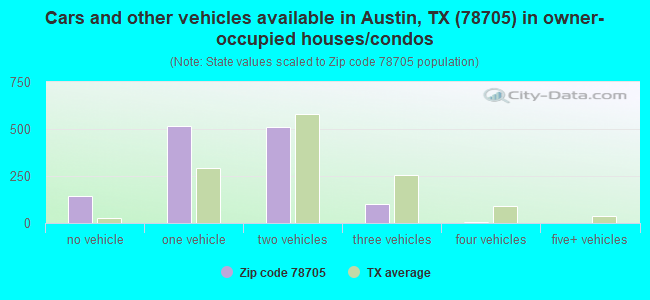
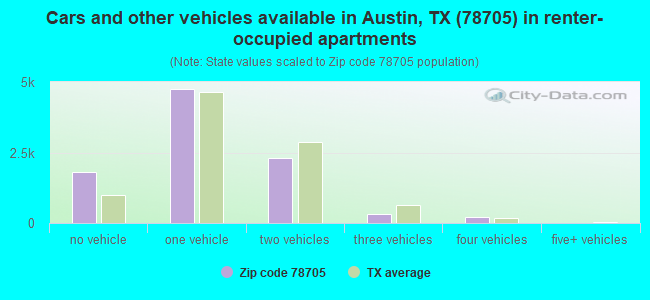


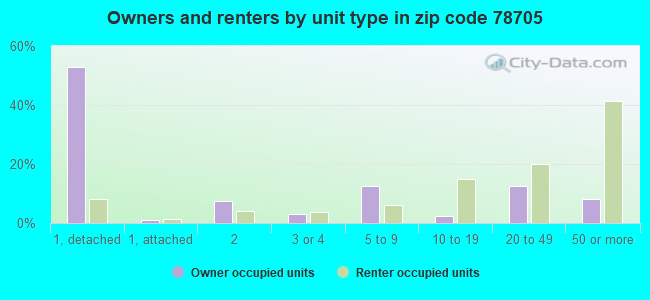
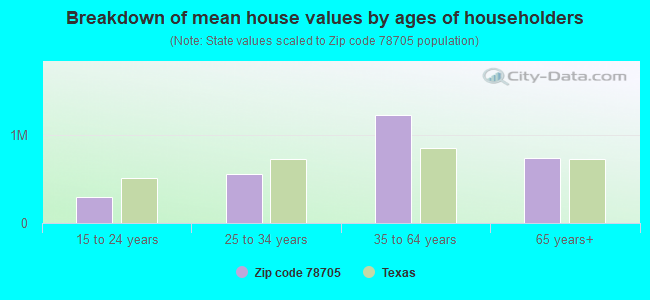


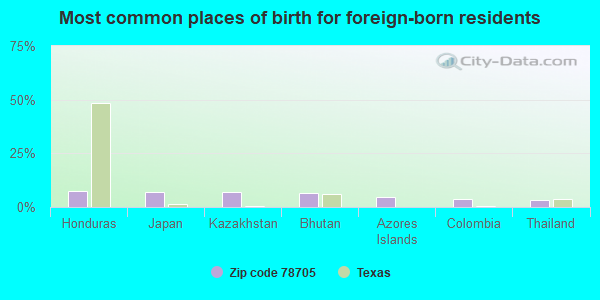
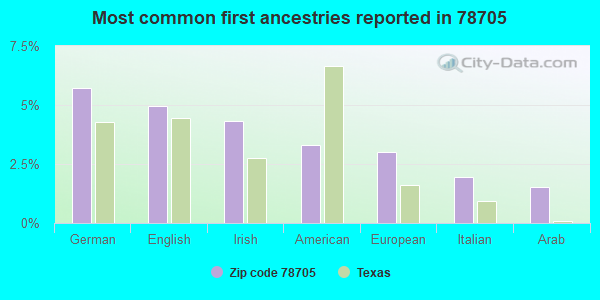
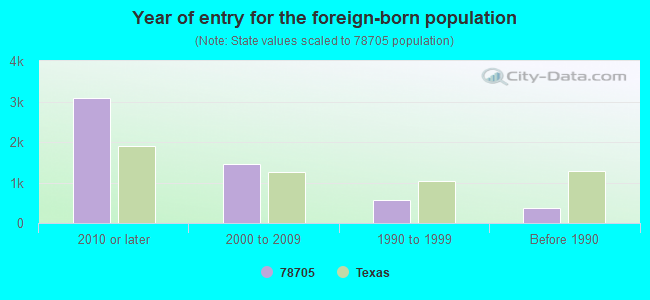
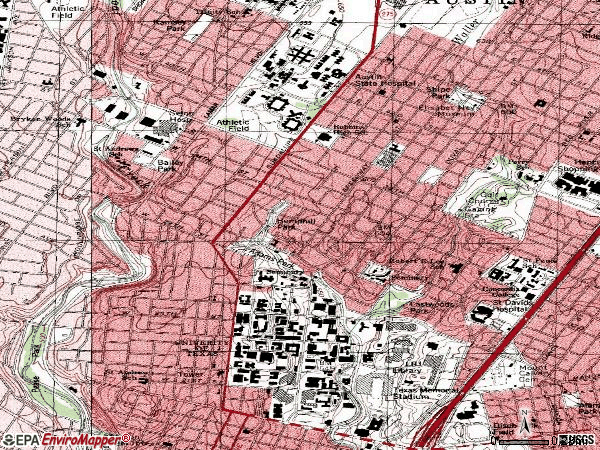


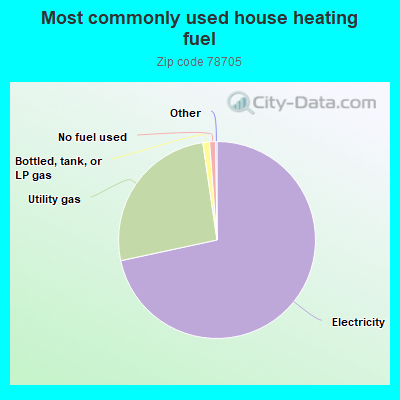
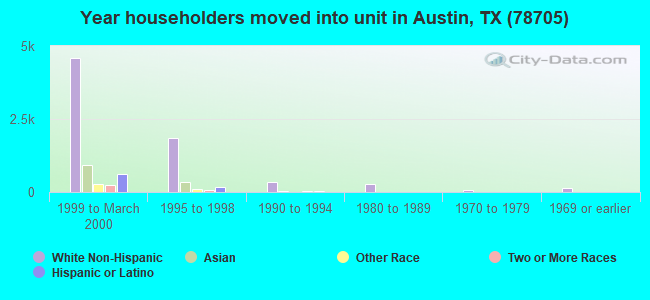
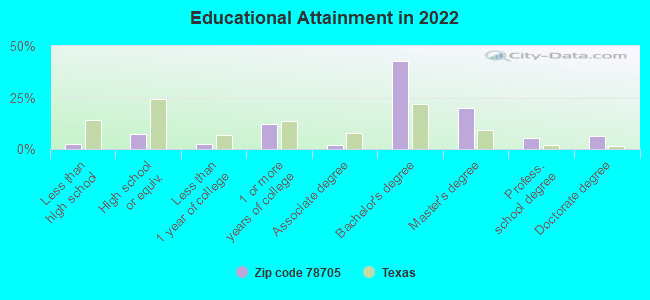
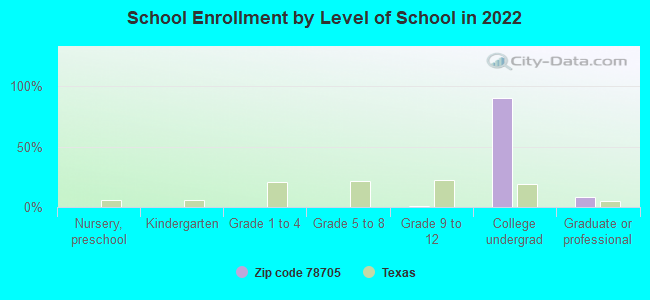
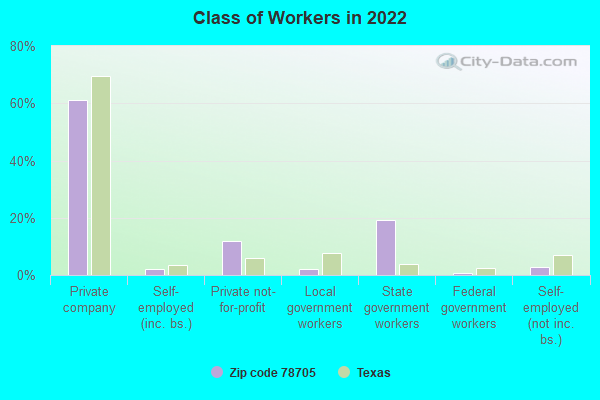
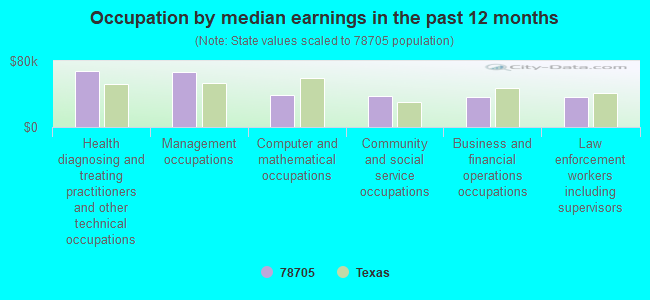
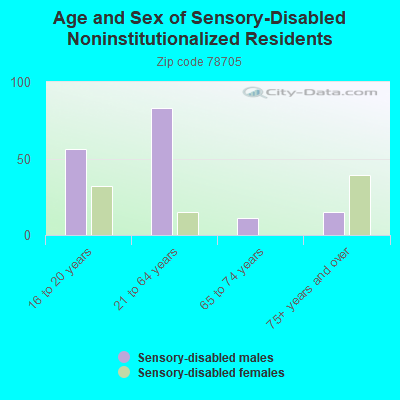
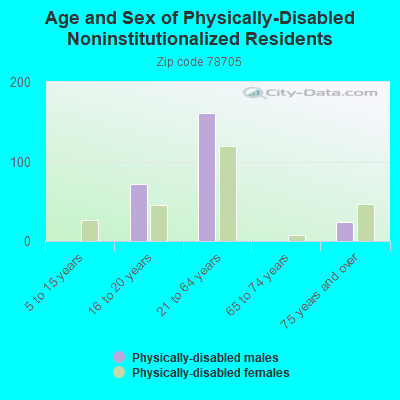
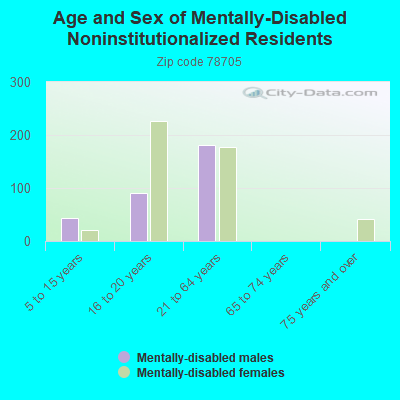
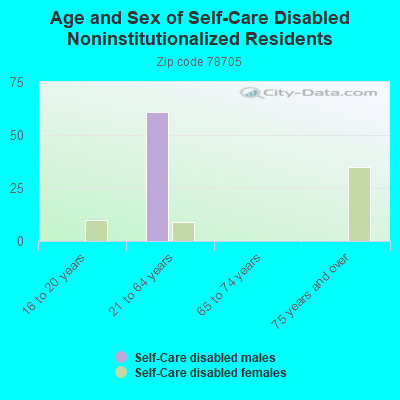
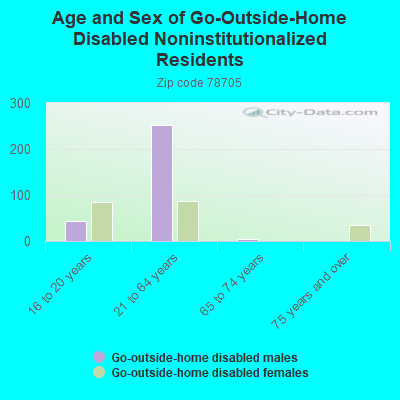
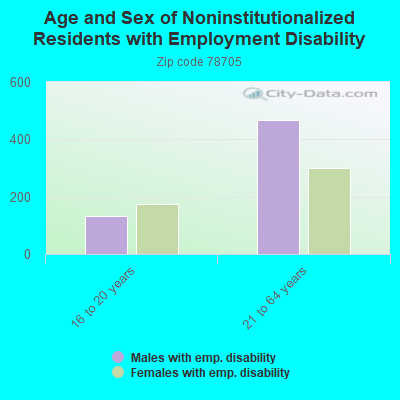
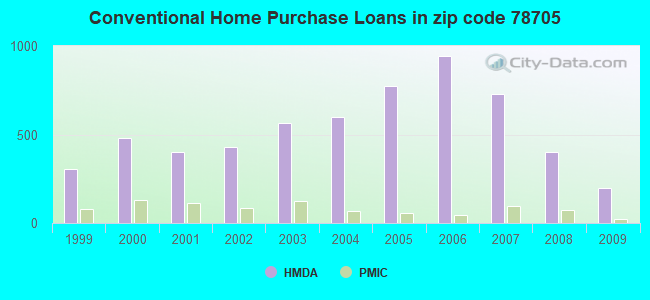
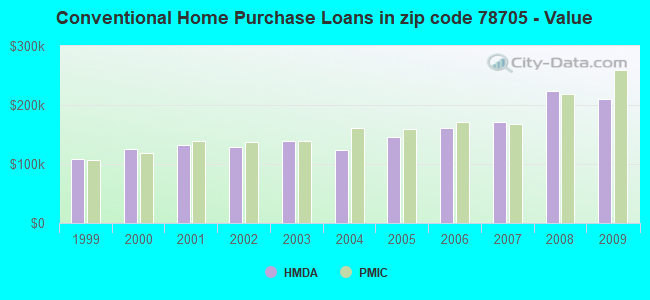
 According to the data from the years 2002 - 2018 the average number of fire incidents per year is 67. The highest number of fires - 94 took place in 2009, and the least - 8 in 2017. The data has a growing trend.
 When looking into fire subcategories, the most reports belonged to: Outside Fires (58.4%), and Structure Fires (27.7%).