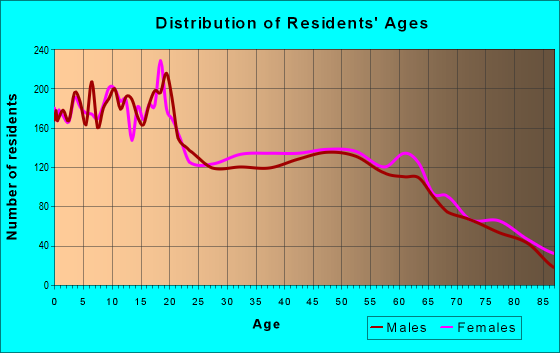
Estimated zip code population in 2022: 21,819 Zip code population in 2010: 21,780 Zip code population in 2000: 21,837
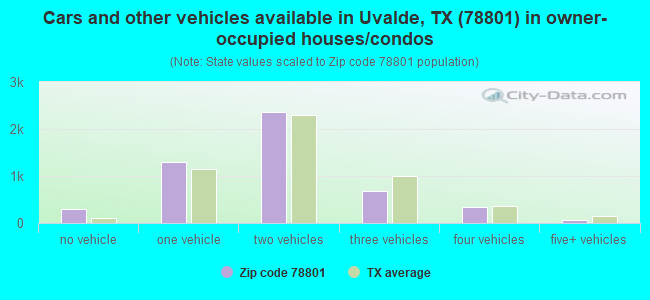
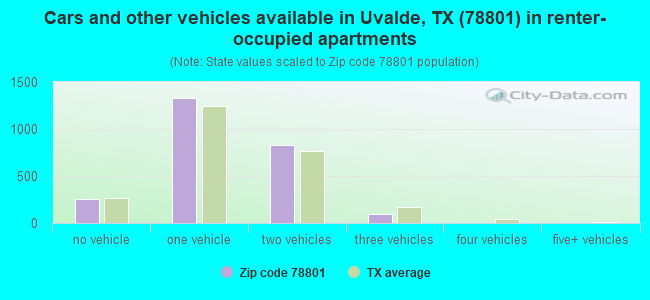
Houses and condos: 8,519 Renter-occupied apartments: 2,506
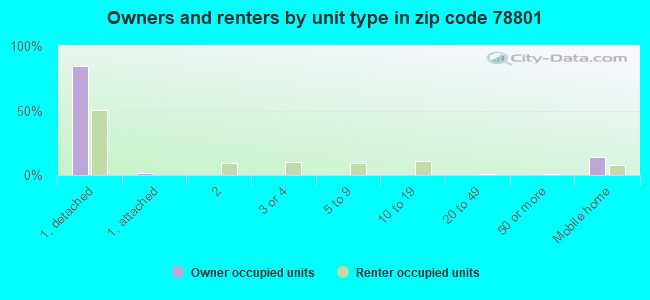
% of renters here:
33%
State:
38%
March 2022 cost of living index in zip code 78801: 79.3 (low, U.S. average is 100)
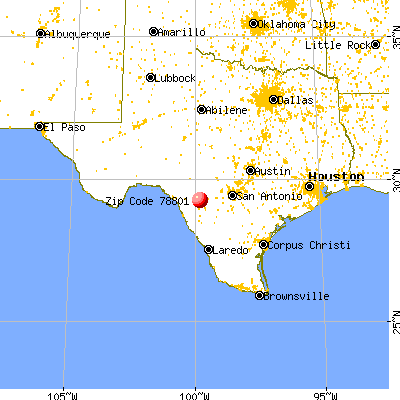
Land area: 815.0 sq. mi. Water area: 2.9 sq. mi.
Population density: 27 people per square mile
(very low).
OSM Map
General Map
Google Map
MSN Map
OSM Map
General Map
Google Map
MSN Map
OSM Map
General Map
Google Map
MSN Map
OSM Map
General Map
Google Map
MSN Map
Please wait while loading the map...
Real estate property taxes paid for housing units in 2022:
This zip code:
1.5% ($2,219)
Texas:
1.5% ($4,050)
Median real estate property taxes paid for housing units with mortgages in 2022: $3,122 (1.6%) Median real estate property taxes paid for housing units with no mortgage in 2022: $1,447 (1.3%)
Averages for the 2020 tax year for zip code 78801, filed in 2021:
Average Adjusted Gross Income (AGI) in 2020: $44,746 (Individual Income Tax Returns)
Here:
$44,746
State:
$77,054
Salary/wage: $39,455 (reported on 84.8% of returns)
Here:
$39,455
State:
$62,766
(% of AGI for various income ranges: 1237.1% for AGIs below $25k, 3626.1% for AGIs $25k-50k, 6566.8% for AGIs $50k-75k, 9957.4% for AGIs $75k-100k, 18181.8% for AGIs $100k-200k, 78296.7% for AGIs over 200k)
Taxable interest for individuals: $1,880 (reported on 14.6% of returns)
This zip code:
$1,880
Texas:
$2,665
(% of AGI for various income ranges: 5.1% for AGIs below $25k, 6.7% for AGIs $25k-50k, 31.2% for AGIs $50k-75k, 27.4% for AGIs $75k-100k, 249.2% for AGIs $100k-200k, 2820.0% for AGIs over 200k)
Ordinary dividends: $6,276 (reported on 6.5% of returns)
Here:
$6,276
State:
$10,044
(% of AGI for various income ranges: 5.4% for AGIs below $25k, 7.8% for AGIs $25k-50k, 46.9% for AGIs $50k-75k, 79.2% for AGIs $75k-100k, 292.6% for AGIs $100k-200k, 5080.0% for AGIs over 200k)
Net capital gain/loss in AGI: +$12,124 (reported on 6.1% of returns)
Here:
+$12,124
State:
+$39,590
(% of AGI for various income ranges: 2.2% for AGIs below $25k, 9.7% for AGIs $25k-50k, 42.7% for AGIs $50k-75k, 168.9% for AGIs $75k-100k, 720.8% for AGIs $100k-200k, 8526.7% for AGIs over 200k)
Profit/loss from business: +$9,074 (reported on 21.9% of returns)
Here:
+$9,074
State:
+$10,888
(% of AGI for various income ranges: 209.4% for AGIs below $25k, 65.5% for AGIs $25k-50k, 12.7% for AGIs $50k-75k, 199.2% for AGIs $75k-100k, 835.8% for AGIs $100k-200k, 18746.7% for AGIs over 200k)
Taxable individual retirement arrangement distribution: $17,906 (reported on 3.5% of returns)
78801:
$17,906
Texas:
$24,740
(% of AGI for various income ranges: 13.2% for AGIs below $25k, 28.4% for AGIs $25k-50k, 91.8% for AGIs $50k-75k, 246.3% for AGIs $75k-100k, 757.6% for AGIs $100k-200k)
Total itemized deductions: $34,379 (reported on 2.7% of returns)
Here:
$34,379
State:
$40,428
(% of AGI for various income ranges: 66.0% for AGIs $25k-50k, 125.6% for AGIs $50k-75k, 307.1% for AGIs $75k-100k, 605.5% for AGIs $100k-200k, 8033.3% for AGIs over 200k)
Charity contributions: $14,989 (reported on 2.1% of returns)
Here:
$14,989
State:
$18,201
(% of AGI for various income ranges: 11.8% for AGIs $25k-50k, 78.2% for AGIs $75k-100k, 198.2% for AGIs $100k-200k, 5163.3% for AGIs over 200k)
Taxes paid: $6,258 (reported on 2.7% of returns)
78801:
$6,258
State:
$7,821
(% of AGI for various income ranges: 9.3% for AGIs $25k-50k, 29.1% for AGIs $50k-75k, 55.0% for AGIs $75k-100k, 133.9% for AGIs $100k-200k, 1200.0% for AGIs over 200k)
Earned income credit: $2,901 (reported on 33.5% of returns)
Here:
$2,901
State:
$2,584
(% of AGI for various income ranges: 191.0% for AGIs below $25k, 121.2% for AGIs $25k-50k, 2.1% for AGIs $50k-75k)
Percentage of individuals using paid preparers for their 2020 taxes: 92.7%
Here:
93%
State:
92%
(% for various income ranges: 92.5% for AGIs below $25k, 93.3% for AGIs $25k-50k, 92.0% for AGIs $50k-75k, 92.7% for AGIs $75k-100k, 92.6% for AGIs $100k-200k, 93.3% for AGIs over 200k)
Averages for the 2012 tax year for zip code 78801, filed in 2013:
Average Adjusted Gross Income (AGI) in 2012: $44,167 (Individual Income Tax Returns)
Here:
$44,167
State:
$65,384
Salary/wage: $33,156 (reported on 86.4% of returns)
Here:
$33,156
State:
$52,524
(% of AGI for various income ranges: 80.8% for AGIs below $25k, 86.6% for AGIs $25k-50k, 80.4% for AGIs $50k-75k, 79.8% for AGIs $75k-100k, 72.3% for AGIs $100k-200k, 17.7% for AGIs over 200k)
Taxable interest for individuals: $2,268 (reported on 15.9% of returns)
This zip code:
$2,268
Texas:
$2,372
(% of AGI for various income ranges: 0.6% for AGIs below $25k, 0.6% for AGIs $25k-50k, 0.8% for AGIs $50k-75k, 0.3% for AGIs $75k-100k, 0.9% for AGIs $100k-200k, 1.4% for AGIs over 200k)
Ordinary dividends: $6,200 (reported on 7.5% of returns)
Here:
$6,200
State:
$9,721
(% of AGI for various income ranges: 0.3% for AGIs below $25k, 0.4% for AGIs $25k-50k, 1.0% for AGIs $50k-75k, 1.0% for AGIs $75k-100k, 1.3% for AGIs $100k-200k, 1.9% for AGIs over 200k)
Net capital gain/loss in AGI: +$24,079 (reported on 6.4% of returns)
Here:
+$24,079
State:
+$35,319
(% of AGI for various income ranges: 0.4% for AGIs $25k-50k, 0.4% for AGIs $50k-75k, 0.8% for AGIs $75k-100k, 2.0% for AGIs $100k-200k, 11.9% for AGIs over 200k)
Profit/loss from business: +$11,009 (reported on 22.2% of returns)
Here:
+$11,009
State:
+$13,732
(% of AGI for various income ranges: 13.4% for AGIs below $25k, 2.3% for AGIs $25k-50k, 3.7% for AGIs $50k-75k, 3.6% for AGIs $75k-100k, 7.0% for AGIs $100k-200k, 3.8% for AGIs over 200k)
Taxable individual retirement arrangement distribution: $12,153 (reported on 4.7% of returns)
78801:
$12,153
Texas:
$19,511
(% of AGI for various income ranges: 0.6% for AGIs below $25k, 1.1% for AGIs $25k-50k, 1.7% for AGIs $50k-75k, 2.4% for AGIs $75k-100k, 3.1% for AGIs $100k-200k)
Self-employment retirement plans: $13,400 (reported on 0.4% of returns)
78801:
$13,400
Texas:
$23,938
Total itemized deductions: $20,756 (17% of AGI, reported on 15.2% of returns)
Here:
$20,756
State:
$24,724
Here:
16.6% of AGI
State:
15.9% of AGI
(% of AGI for various income ranges: 3.5% for AGIs below $25k, 7.7% for AGIs $25k-50k, 10.3% for AGIs $50k-75k, 9.5% for AGIs $75k-100k, 10.0% for AGIs $100k-200k, 4.5% for AGIs over 200k)
Charity contributions: $5,399 (reported on 10.3% of returns)
Here:
$5,399
State:
$6,808
(% of AGI for various income ranges: 0.3% for AGIs below $25k, 0.5% for AGIs $25k-50k, 1.0% for AGIs $50k-75k, 1.5% for AGIs $75k-100k, 1.6% for AGIs $100k-200k, 2.2% for AGIs over 200k)
Taxes paid: $4,369 (reported on 14.6% of returns)
78801:
$4,369
State:
$6,921
(% of AGI for various income ranges: 0.5% for AGIs below $25k, 1.2% for AGIs $25k-50k, 1.8% for AGIs $50k-75k, 2.1% for AGIs $75k-100k, 2.7% for AGIs $100k-200k, 0.9% for AGIs over 200k)
Earned income credit: $2,881 (reported on 39.5% of returns)
Here:
$2,881
State:
$2,570
(% of AGI for various income ranges: 13.5% for AGIs below $25k, 2.2% for AGIs $25k-50k)
Percentage of individuals using paid preparers for their 2012 taxes: 61.4%
Here:
61%
State:
51%
(% for various income ranges: 61.2% for AGIs below $25k, 61.2% for AGIs $25k-50k, 61.8% for AGIs $50k-75k, 54.2% for AGIs $75k-100k, 65.9% for AGIs $100k-200k, 83.3% for AGIs over 200k)
Averages for the 2004 tax year for zip code 78801, filed in 2005:
Average Adjusted Gross Income (AGI) in 2004: $28,400 (Individual Income Tax Returns)
Here:
$28,400
State:
$47,881
Salary/wage: $24,545 (reported on 85.6% of returns)
Here:
$24,545
State:
$41,947
(% of AGI for various income ranges: 140.1% for AGIs below $10k, 84.1% for AGIs $10k-25k, 83.9% for AGIs $25k-50k, 78.1% for AGIs $50k-75k, 75.8% for AGIs $75k-100k, 43.2% for AGIs over 100k)
Taxable interest for individuals: $2,781 (reported on 21.1% of returns)
This zip code:
$2,781
Texas:
$2,255
(% of AGI for various income ranges: 8.1% for AGIs below $10k, 0.9% for AGIs $10k-25k, 1.2% for AGIs $25k-50k, 2.1% for AGIs $50k-75k, 1.8% for AGIs $75k-100k, 3.3% for AGIs over 100k)
Taxable dividends: $3,695 (reported on 10.1% of returns)
Here:
$3,695
State:
$4,261
(% of AGI for various income ranges: 2.3% for AGIs below $10k, 0.4% for AGIs $10k-25k, 0.8% for AGIs $25k-50k, 1.7% for AGIs $50k-75k, 1.1% for AGIs $75k-100k, 2.3% for AGIs over 100k)
Net capital gain/loss: +$10,193 (reported on 8.9% of returns)
Here:
+$10,193
State:
+$16,110
(% of AGI for various income ranges: -1.3% for AGIs below $10k, -0.0% for AGIs $10k-25k, 0.6% for AGIs $25k-50k, 0.9% for AGIs $50k-75k, 1.6% for AGIs $75k-100k, 11.6% for AGIs over 100k)
Profit/loss from business: +$8,496 (reported on 21.1% of returns)
Here:
+$8,496
State:
+$11,013
(% of AGI for various income ranges: 28.0% for AGIs below $10k, 8.9% for AGIs $10k-25k, 3.7% for AGIs $25k-50k, 3.3% for AGIs $50k-75k, 4.5% for AGIs $75k-100k, 6.9% for AGIs over 100k)
IRA payment deduction: $3,496 (reported on 1.7% of returns)
78801:
$3,496
Texas:
$3,120
(% of AGI for various income ranges: 0.1% for AGIs $10k-25k, 0.2% for AGIs $25k-50k, 0.2% for AGIs $50k-75k, 0.2% for AGIs $75k-100k, 0.3% for AGIs over 100k)
Self-employed pension: $12,720 (reported on 0.3% of returns)
Here:
$12,720
Texas:
$16,401
Total itemized deductions: $16,987 (21% of AGI, reported on 10.0% of returns)
Here:
$16,987
State:
$19,631
Here:
21.3% of AGI
State:
18.9% of AGI
(% of AGI for various income ranges: 5.2% for AGIs below $10k, 2.2% for AGIs $10k-25k, 5.1% for AGIs $25k-50k, 7.4% for AGIs $50k-75k, 9.1% for AGIs $75k-100k, 7.9% for AGIs over 100k)
Charity contributions deductions: $4,606 (5% of AGI, reported on 8.2% of returns)
Here:
$4,606
State:
$4,753
Here:
5.4% of AGI
State:
4.2% of AGI
(% of AGI for various income ranges: 0.2% for AGIs below $10k, 0.3% for AGIs $10k-25k, 0.6% for AGIs $25k-50k, 1.2% for AGIs $50k-75k, 2.0% for AGIs $75k-100k, 2.9% for AGIs over 100k)
Total tax: $4,674 (reported on 57.4% of returns)
78801:
$4,674
State:
$9,058
(% of AGI for various income ranges: 6.1% for AGIs below $10k, 3.1% for AGIs $10k-25k, 5.4% for AGIs $25k-50k, 8.7% for AGIs $50k-75k, 11.4% for AGIs $75k-100k, 19.2% for AGIs over 100k)
Earned income credit: $2,325 (reported on 43.5% of returns)
Here:
$2,325
State:
$2,024
Percentage of individuals using paid preparers for their 2004 taxes: 66.2%
Here:
66%
State:
57%
(% for various income ranges: 63.1% for AGIs below $10k, 70.1% for AGIs $10k-25k, 65.1% for AGIs $25k-50k, 61.2% for AGIs $50k-75k, 59.9% for AGIs $75k-100k, 74.1% for AGIs over 100k)
Likely homosexual households (counted as self-reported same-sex unmarried-partner households)
Lesbian couples: 0.2% of all households
Gay men: 0.0% of all households
Household received Food Stamps/SNAP in the past 12 months: 2,286 Household did not receive Food Stamps/SNAP in the past 12 months: 5,327
Women who had a birth in the past 12 months: 545 (406 now married, 140 unmarried) Women who did not have a birth in the past 12 months: 4,526 (1,779 now married, 2,753 unmarried)
Housing units in zip code 78801 with a mortgage: 1,692 (39 second mortgage, 42 both second mortgage and home equity loan) Median monthly owner costs for units with a mortgage: $1,421 Median monthly owner costs for units without a mortgage: $488
Residents with income below the poverty level in 2022:
This zip code:
25.7%
Whole state:
14.0%
Residents with income below 50% of the poverty level in 2022:
This zip code:
17.0%
Whole state:
7.4%
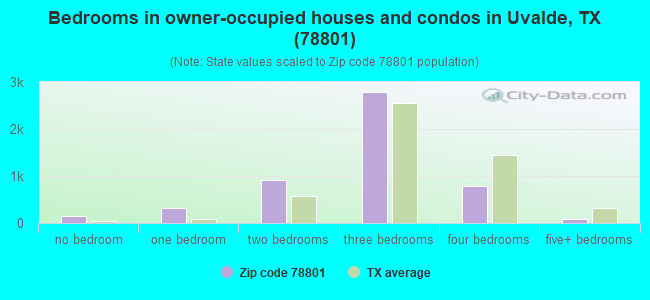
Median number of rooms in houses and condos:
Here:
5.7
State:
6.3
Median number of rooms in apartments:
Here:
4.6
State:
4.0
Notable locations in this zip code not listed on our city pages
In group quarters: 722 (-1 institutionalized population)
Size of family households: 1,899 2-persons, 1,607 3-persons, 570 4-persons, 827 5-persons, 184 6-persons, 237 7-or-more-persons
Size of nonfamily households: 1,916 1-person, 299 2-persons, 6 3-persons
2,538 married couples with children.
1,837 single-parent households (233 men, 1,604 women).
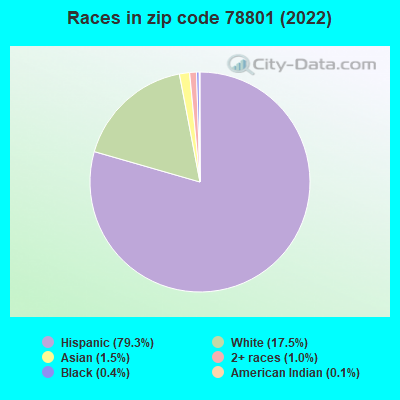
46.6% of residents of 78801 zip code speak English at home.
52.2% of residents speak Spanish at home (71% very well, 14% well, 12% not well, 3% not at all).
0.2% of residents speak other Indo-European language at home (75% very well, 25% well).
1.0% of residents speak Asian or Pacific Island language at home (78% very well, 22% not well).
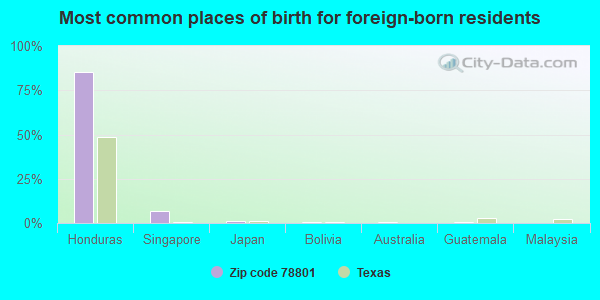
Foreign born population: 2,576 (11.8%) (43.8% of them are naturalized citizens)
This zip code:
11.8%
Whole state:
17.2%
85%Honduras
7%Singapore
1%Japan
1%Bolivia
0%Australia
0%Guatemala
0%Malaysia
4%American
3%German
2%English
2%Irish
1%French
0%Czech
0%Polish
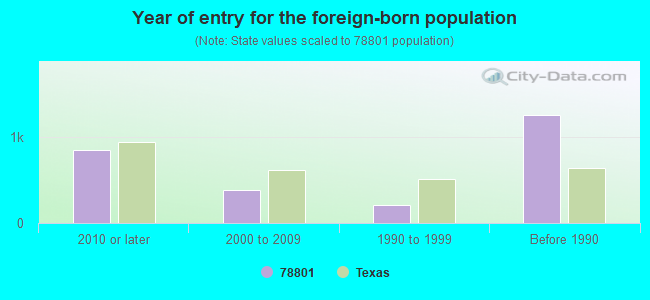
Year of entry for the foreign-born population
8452010 or later
3832000 to 2009
2131990 to 1999
1,252Before 1990
Facilities with environmental interests located in this zip code:
ANTHON EL (1000 N GETTY in UVALDE, TX)
(National Center for Education Statistics) - STATE ID-232903104 Organizations: UVALDE CONS ISD (SCHOOL DISTRICT)
AEP TEXAS CENTRAL COMPANY (512 W LEONA ST in UVALDE, TX)
(Resource Conservation and Recovery Act (tracking hazardous waste)) Business NAICS classification: ELECTRIC POWER DISTRIBUTION. Alternative names: UVALDE SERVICE CENTER
Housing units lacking complete plumbing facilities: 3.5% Housing units lacking complete kitchen facilities: 2.5%
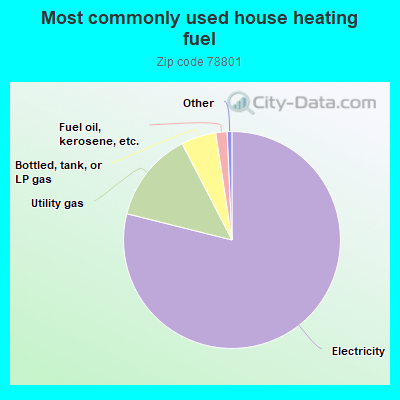
78.9%Electricity
13.5%Utility gas
5.2%Bottled, tank, or LP gas
1.7%Fuel oil, kerosene, etc.
Population in 1990: 19,725. Population change in the 1990s: +2,112 (+10.7%).
Place of birth for U.S.-born residents:
This state: 16,383
Northeast: 225
Midwest: 1,060
South: 755
West: 508
60% of the 78801 zip code residents lived in the same house 5 years ago. Out of people who lived in different houses, 58% lived in this county. Out of people who lived in different counties, 50% lived in Texas.
91% of the 78801 zip code residents lived in the same house 1 year ago. Out of people who lived in different houses, 62% moved from this county. Out of people who lived in different houses, 24% moved from different county within same state. Out of people who lived in different houses, 10% moved from different state. Out of people who lived in different houses, 3% moved from abroad.
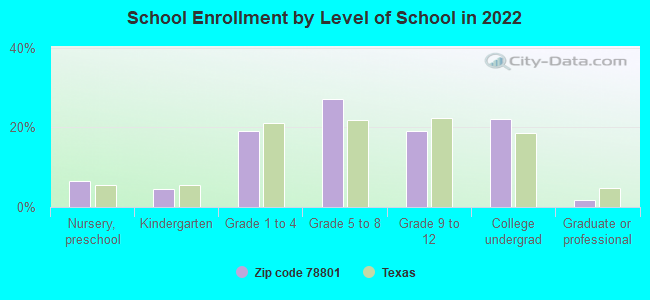
Private vs. public school enrollment:
Students in private schools in grades 1 to 8 (elementary and middle school): 178
Here:
6.7%
Texas:
8.8%
Students in private schools in grades 9 to 12 (high school): 162
Here:
14.8%
Texas:
8.0%
Students in private undergraduate colleges: 176
Here:
13.9%
Texas:
16.2%
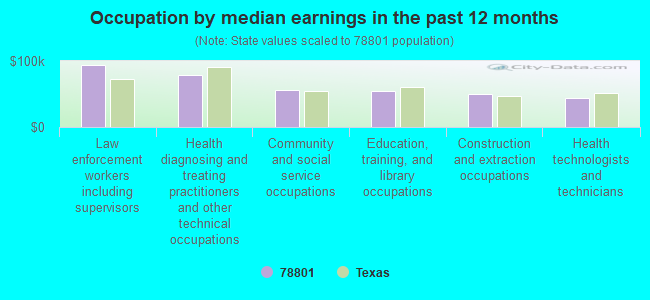
Occupation by median earnings in the past 12 months ($)
93,786Law enforcement workers including supervisors
78,927Health diagnosing and treating practitioners and other technical occupations
55,532Community and social service occupations
54,967Education, training, and library occupations
49,912Construction and extraction occupations
43,667Health technologists and technicians
Companies with federal contracts located in this zip code:
SOUTH TEXAS AGGREGATES, INC (4343 US 90 EAST in UVALDE, TX; small business) : $74,917 in 3 contractsfrom 2000 to 2004
$26,471 with Army for Miscellaneous Construction Materials. Signed on 2000-05-12. Completion date: 2000-05-10.
$24,223 with Army for Pipe and Conduit, Nonmetallic. Signed on 2004-07-23. Completion date: 2004-09-23.
$24,223 with U.S. Army Corps of Engineers - civil program financing only for Pipe and Conduit, Nonmetallic. Signed on 2004-07-23. Completion date: 2004-09-23.
SIERRA INDUSTRIES INC (GARNER FIELD RD in UVALDE, TX; small business) 115 employees, $14400000 revenue.
$27,258 with Office of Policy, Management and Budget/Chief Financial Officer for Miscellaneous Aircraft Accessories and Components. Signed on 2003-04-15. Completion date: 2003-06-15.
SPURGEON, CARY (728 SKYLANE DR N in UVALDE, TX; small business)
$5,500 with Army for Well Drilling/Exploratory Services. Signed on 2004-10-15. Completion date: 2004-10-31.
Top industries in this zip code by the number of employees in 2005:
Other Services (except Public Administration): Religious Organizations (20-49: 3, 10-19: 2, 5-9: 2, 1-4: 8)
People in group quarters in 2010:
193 people in college/university student housing
191 people in nursing facilities/skilled-nursing facilities
82 people in correctional residential facilities
27 people in local jails and other municipal confinement facilities
12 people in group homes intended for adults
People in group quarters in 2000:
263 people in nursing homes
161 people in college dormitories (includes college quarters off campus)
87 people in other types of correctional institutions
47 people in local jails and other confinement facilities (including police lockups)
15 people in other noninstitutional group quarters
12 people in homes for the mentally retarded
6 people in religious group quarters
2004 - 2017 National Fire Incident Reporting System (NFIRS) incidents
Based on the data from the years 2004 - 2017 the average number of fire incidents per year is 54. The highest number of fires - 135 took place in 2006, and the least - 0 in 2008. The data has a dropping trend.
When looking into fire subcategories, the most reports belonged to: Outside Fires (53.2%), and Structure Fires (23.1%).
Fire incident types reported to NFIRS in Zip Code 78801


 Nearest zip codes: 78838, 78802, 78870, 78879, 78833, 78881.


 Based on the data from the years 2004 - 2017 the average number of fire incidents per year is 54. The highest number of fires - 135 took place in 2006, and the least - 0 in 2008. The data has a dropping trend.
 When looking into fire subcategories, the most reports belonged to: Outside Fires (53.2%), and Structure Fires (23.1%).