Estimated zip code population in 2022: 312
Zip code population in 2010: 352
Zip code population in 2000: 318
Houses and condos: 185
Renter-occupied apartments: 86
| % of renters here: | 46% |
| State: | 38% |
77.2
(low, U.S. average is 100)
Land area: 5.8
sq. mi.
Water area: 0.1
sq. mi.
| Population density: 54 people per square mile | | (very low). |
![Age and Sex of Residents in zip code 78943]()
- OSM Map
- General Map
- Google Map
- MSN Map
- OSM Map
- General Map
- Google Map
- MSN Map
- OSM Map
- General Map
- Google Map
- MSN Map
- OSM Map
- General Map
- Google Map
- MSN Map
Please wait while loading the map...
Real estate property taxes paid for housing units in 2022:
| This zip code: | 15.7% ($4,483) |
| Texas: | 1.5% ($4,050) |
Business Search - 14 Million verified businesses
| Males: 102 |  (32.9%) (32.9%) |
| Females: 209 |  (67.1%) (67.1%) |
For population 25 years and over in 78943:
- High school or higher: 27.6%
- Bachelor's degree or higher: 0.0%
- Graduate or professional degree: 0.0%
- Mean travel time to work (commute): 50.6 minutes
For population 15 years and over in 78943:
- Never married: 5.8%
- Now married: 69.0%
- Separated: 22.0%
- Widowed: 0.0%
- Divorced: 3.2%
Zip code 78943 compared to state average:
- Median household income significantly below state average.
- Median house value significantly below state average.
- Unemployed percentage significantly below state average.
- Hispanic race population percentage above state average.
- Median age significantly above state average.
- Foreign-born population percentage above state average.
- Length of stay since moving in significantly above state average.
- Number of rooms per house significantly below state average.
- Number of college students significantly below state average.
- Percentage of population with a bachelor's degree or higher significantly below state average.

- 24077.2%Hispanic or Latino
- 4514.5%Black
- 268.4%White
Data:
Urban population: 269
Rural population: 42
Median resident age:| This zip code: | 51.3 years |
| Texas median age: | 35.6 years |
Average household size:| This zip code: | 1.7 people |
| Texas: | 2.6 people |
Averages for the 2020 tax year for zip code 78943, filed in 2021:
Average Adjusted Gross Income (AGI) in 2020: $37,311 (Individual Income Tax Returns)
| Here: | $37,311 |
| State: | $77,054 |
Salary/wage: $34,556 (reported on 88.9% of returns)
| Here: | $34,556 |
| State: | $62,766 |
(% of AGI for various income ranges: 1498.0% for AGIs below $25k, 3782.0% for AGIs $25k-50k, 9630.0% for AGIs $50k-75k)
Profit/loss from business: +$8,033 (reported on 16.7% of returns)
| Here: | +$8,033 |
| State: | +$10,888 |
(% of AGI for various income ranges: 482.0% for AGIs below $25k)
Earned income credit: $3,150 (reported on 22.2% of returns)
(% of AGI for various income ranges: 130.0% for AGIs below $25k, 122.0% for AGIs $25k-50k)
Percentage of individuals using paid preparers for their 2020 taxes: 83.3%
(% for various income ranges: 85.7% for AGIs below $25k, 83.3% for AGIs $25k-50k, 80.0% for AGIs $50k-75k)
Averages for the 2012 tax year for zip code 78943, filed in 2013:
Average Adjusted Gross Income (AGI) in 2012: $30,747 (Individual Income Tax Returns)
| Here: | $30,747 |
| State: | $65,384 |
Salary/wage: $31,153 (reported on 88.2% of returns)
| Here: | $31,153 |
| State: | $52,524 |
(% of AGI for various income ranges: 86.8% for AGIs below $25k, 90.1% for AGIs $25k-50k, 90.2% for AGIs $50k-75k)
Profit/loss from business: +$4,433 (reported on 17.6% of returns)
| Here: | +$4,433 |
| State: | +$13,732 |
Earned income credit: $2,067 (reported on 35.3% of returns)
(% of AGI for various income ranges: 10.1% for AGIs below $25k)
Percentage of individuals using paid preparers for their 2012 taxes: 52.9%
(% for various income ranges: 55.6% for AGIs below $25k, 80.0% for AGIs $25k-50k)
Averages for the 2004 tax year for zip code 78943, filed in 2005:
Average Adjusted Gross Income (AGI) in 2004: $21,089 (Individual Income Tax Returns)
| Here: | $21,089 |
| State: | $47,881 |
Salary/wage: $21,748 (reported on 86.3% of returns)
| Here: | $21,748 |
| State: | $41,947 |
Taxable interest for individuals: $421 (reported on 15.3% of returns)
| This zip code: | $421 |
| Texas: | $2,255 |
Profit/loss from business: +$5,278 (reported on 14.5% of returns)
| Here: | +$5,278 |
| State: | +$11,013 |
Total tax: $1,781 (reported on 58.9% of returns)
Earned income credit: $1,860 (reported on 34.7% of returns)
Percentage of individuals using paid preparers for their 2004 taxes: 65.3%
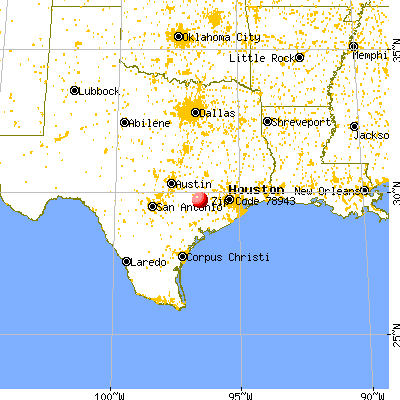
![Glidden, TX (78943) map]() Nearest zip codes: 78934
Nearest zip codes: 78934,
78938,
78962,
77470,
78935,
77475.
Glidden Zip Code Map
Percentage of family households:| This zip code: | 44.8% |
| Texas: | 50.5% |
Percentage of households with unmarried partners:| This zip code: | 0.0% |
| Texas: | 48.7% |
No gay or lesbian households reported
Household received Food Stamps/SNAP in the past 12 months: 13
Household did not receive Food Stamps/SNAP in the past 12 months: 174
Women who did not have a birth in the past 12 months: 84 (70 now married, 12 unmarried)
Residents with income below the poverty level in 2022:
| This zip code: | 38.1% |
| Whole state: | 14.0% |
| This zip code: | 8.3% |
| Whole state: | 7.4% |

- Year house built (houses)
- 02020 or later
- 02010 to 2019
- 02000 to 2009
- 01990 to 1999
- 1621980 to 1989
- 121970 to 1979
- 01960 to 1969
- 01950 to 1959
- 01940 to 1949
- 01939 or earlier
![Zip code 78943 satellite photo by USGS]()
Zip code 78943 household income distribution in 2022
![Zip code 78943 household income distribution in 2022]()
- 99Less than $10,000
- 11$15,000 to $19,999
- 9$40,000 to $44,999
- 76$60,000 to $74,999
Rent paid by renters in 2022 in zip code 78943
![Rent paid by renters in 2022 in zip code 78943]()
- 14$400 to $449
- 71$1,000 to $1,249
Estimated median house (or condo) value in 2022 for:
- White Non-Hispanic householders: $22,289
- Black or African American householders: $40,281
- Some other race householders: $36,343
- Hispanic or Latino householders: $36,343
Mean price in 2022:
Mobile homes: $110,612| Here: | $110,612 |
| State: | $124,413 |
Housing units in structures:
- One, detached: 85
- Mobile homes: 94
Travel time to work (commute) in zip code 78943
![Travel time to work (commute) in zip code 78943]()
- 8910 to 14 minutes
- 7060 to 89 minutes
Percentage of zip code residents living and working in this county: 56.3%
Household type by relationship:
Households: 312
- Male householders: 9 (0 living alone), Female householders: 180 (94 living alone)
94 spouses (94 opposite-sex spouses), 0 unmarried partners, (0 opposite-sex unmarried partners), 35 children (35 natural, 0 adopted, 0 stepchildren), 0 grandchildren, 0 brothers or sisters, 0 parents, 0 foster children, 0 other relatives, 0 non-relatives
Size of family households: 87 2-persons, 9 3-persons
Size of nonfamily households: 94 1-person
23.0% of residents of 78943 zip code speak English at home.
77.3% of residents speak Spanish at home (100% very well).
Foreign born population: 84 (27.2%)
(100.0%
of them are naturalized citizens)
| This zip code: | 27.2% |
| Whole state: | 17.2% |
- Year of entry for the foreign-born population
- 02010 or later
- 02000 to 2009
- 741990 to 1999
- 0Before 1990
- 56.0%Electricity
- 44.7%Bottled, tank, or LP gas
Place of birth for U.S.-born residents:
- This state: 141
- Northeast: 90
83% of the 78943 zip code residents lived in the same house 5 years ago.
Out of people who lived in different houses, 86% lived in this county.
85% of the 78943 zip code residents lived in the same house 1 year ago.
Out of people who lived in different houses, 91% moved from this county.
Private vs. public school enrollment:
Students in private schools in grades 1 to 8 (elementary and middle school):
Top industries in this zip code by the number of employees in 2005:
- Accommodation and Food Services: Limited-Service Restaurants (1-4 employees: 1 establishment)
| Most common first names in zip code 78943 among deceased individuals |
| Name | Count | Lived (average) |
|---|
| James | 3 | 72.6 years |
| Edwin | 3 | 79.3 years |
| Daisy | 2 | 63.5 years |
| Beatrice | 2 | 75.0 years |
| Hazel | 2 | 81.5 years |
| Henry | 2 | 74.0 years |
| John | 2 | 71.9 years |
| Lonnie | 2 | 70.0 years |
| Mary | 2 | 82.5 years |
| Woodrow | 2 | 64.5 years |
| Most common last names in zip code 78943 among deceased individuals |
| Last name | Count | Lived (average) |
|---|
| Wilson | 4 | 69.8 years |
| Krhovjak | 3 | 84.0 years |
| Kuhn | 3 | 88.3 years |
| Smallwood | 3 | 72.0 years |
| Smith | 3 | 66.9 years |
| Fields | 2 | 73.6 years |
| Hanak | 2 | 81.5 years |
| Wright | 2 | 49.5 years |
| Moore | 2 | 84.5 years |
| Nunley | 2 | 97.0 years |


 Nearest zip codes: 78934, 78938, 78962, 77470, 78935, 77475.


