Estimated zip code population in 2022: 1,713 Zip code population in 2010: 1,735 Zip code population in 2000: 1,528
Houses and condos: 745 Renter-occupied apartments: 136
% of renters here:
22%
State:
38%
March 2022 cost of living index in zip code 79005: 78.7 (low, U.S. average is 100)
Land area: 198.6 sq. mi. Water area: 0.0 sq. mi.
Population density: 9 people per square mile
(very low).
OSM Map
General Map
Google Map
MSN Map
OSM Map
General Map
Google Map
MSN Map
OSM Map
General Map
Google Map
MSN Map
OSM Map
General Map
Google Map
MSN Map
Please wait while loading the map...
Real estate property taxes paid for housing units in 2022:
This zip code:
1.0% ($1,652)
Texas:
1.5% ($4,050)
Median real estate property taxes paid for housing units with mortgages in 2022: $1,564 (1.0%) Median real estate property taxes paid for housing units with no mortgage in 2022: $1,741 (1.1%)
Business Search- 14 Million verified businesses
Males: 812
(47.4%)
Females: 901
(52.6%)
For population 25 years and over in 79005:
High school or higher: 77.8%
Bachelor's degree or higher: 22.5%
Graduate or professional degree: 4.5%
Unemployed: 4.9%
Mean travel time to work (commute): 17.0 minutes
For population 15 years and over in 79005:
Never married: 22.1%
Now married: 58.5%
Separated: 2.0%
Widowed: 4.8%
Divorced: 12.7%
Zip code 79005 compared to state average:
Median house value below state average.
Black race population percentage significantly below state average.
Renting percentage below state average.
Percentage of population with a bachelor's degree or higher below state average.
Estimated median house/condo value in 2022: $157,487
79005:
$157,487
Texas:
$275,400
According to our research of Texas and other state lists, there was 1 registered sex offender living in 79005 zip code as of May 28, 2024. The ratio of all residents to sex offenders in zip code 79005 is 1,682 to 1. The ratio of registered sex offenders to all residents in this zip code is much lower than the state average.
Median resident age:
This zip code:
32.6 years
Texas median age:
35.6 years
Average household size:
This zip code:
2.7 people
Texas:
2.6 people
Averages for the 2020 tax year for zip code 79005, filed in 2021:
Average Adjusted Gross Income (AGI) in 2020: $73,350 (Individual Income Tax Returns)
Here:
$73,350
State:
$77,054
Salary/wage: $55,200 (reported on 86.7% of returns)
Here:
$55,200
State:
$62,766
(% of AGI for various income ranges: 1300.0% for AGIs below $25k, 4230.0% for AGIs $25k-50k, 7362.9% for AGIs $50k-75k, 11792.5% for AGIs $75k-100k, 12141.7% for AGIs $100k-200k)
Taxable interest for individuals: $3,157 (reported on 23.3% of returns)
This zip code:
$3,157
Texas:
$2,665
(% of AGI for various income ranges: 26.7% for AGIs below $25k, 26.4% for AGIs $25k-50k, 7.5% for AGIs $75k-100k, 121.7% for AGIs $100k-200k)
Ordinary dividends: $12,300 (reported on 13.3% of returns)
Here:
$12,300
State:
$10,044
(% of AGI for various income ranges: 58.2% for AGIs $25k-50k, 1533.3% for AGIs $100k-200k)
Net capital gain/loss in AGI: +$23,643 (reported on 11.7% of returns)
Here:
+$23,643
State:
+$39,590
(% of AGI for various income ranges: 17.3% for AGIs $25k-50k, 2726.7% for AGIs $100k-200k)
Profit/loss from business: +$8,285 (reported on 21.7% of returns)
Here:
+$8,285
State:
+$10,888
(% of AGI for various income ranges: 120.0% for AGIs below $25k, 178.2% for AGIs $25k-50k, 841.4% for AGIs $50k-75k, 246.7% for AGIs $100k-200k)
Taxable individual retirement arrangement distribution: $7,633 (reported on 5.0% of returns)
79005:
$7,633
Texas:
$24,740
(% of AGI for various income ranges: 208.2% for AGIs $25k-50k)
Taxes paid: $4,250 (reported on 3.3% of returns)
79005:
$4,250
State:
$7,821
(% of AGI for various income ranges: 77.3% for AGIs $25k-50k)
Earned income credit: $2,336 (reported on 18.3% of returns)
Here:
$2,336
State:
$2,584
(% of AGI for various income ranges: 126.7% for AGIs below $25k, 95.5% for AGIs $25k-50k)
Percentage of individuals using paid preparers for their 2020 taxes: 91.7%
Here:
92%
State:
92%
(% for various income ranges: 88.9% for AGIs below $25k, 93.3% for AGIs $25k-50k, 100.0% for AGIs $50k-75k, 85.7% for AGIs $75k-100k, 87.5% for AGIs $100k-200k, 100.0% for AGIs over 200k)
Averages for the 2012 tax year for zip code 79005, filed in 2013:
Average Adjusted Gross Income (AGI) in 2012: $96,688 (Individual Income Tax Returns)
Here:
$96,688
State:
$65,384
Salary/wage: $52,981 (reported on 88.1% of returns)
Here:
$52,981
State:
$52,524
(% of AGI for various income ranges: 79.4% for AGIs below $25k, 88.1% for AGIs $25k-50k, 86.5% for AGIs $50k-75k, 88.5% for AGIs $75k-100k, 68.7% for AGIs $100k-200k, 15.8% for AGIs over 200k)
Taxable interest for individuals: $1,805 (reported on 28.4% of returns)
This zip code:
$1,805
Texas:
$2,372
(% of AGI for various income ranges: 1.3% for AGIs below $25k, 0.3% for AGIs $25k-50k, 0.3% for AGIs $50k-75k, 0.5% for AGIs $100k-200k, 0.7% for AGIs over 200k)
Ordinary dividends: $36,838 (reported on 11.9% of returns)
Here:
$36,838
State:
$9,721
(% of AGI for various income ranges: 0.4% for AGIs $25k-50k, 0.3% for AGIs $100k-200k, 8.9% for AGIs over 200k)
Net capital gain/loss in AGI: +$15,630 (reported on 14.9% of returns)
Here:
+$15,630
State:
+$35,319
(% of AGI for various income ranges: 0.6% for AGIs $25k-50k, 1.1% for AGIs $100k-200k, 4.4% for AGIs over 200k)
Profit/loss from business: +$4,808 (reported on 19.4% of returns)
Here:
+$4,808
State:
+$13,732
(% of AGI for various income ranges: 6.3% for AGIs below $25k, 2.6% for AGIs $25k-50k, 2.2% for AGIs $50k-75k, 1.7% for AGIs $100k-200k)
Taxable individual retirement arrangement distribution: $7,300 (reported on 4.5% of returns)
79005:
$7,300
Texas:
$19,511
Total itemized deductions: $32,846 (13% of AGI, reported on 19.4% of returns)
Here:
$32,846
State:
$24,724
Here:
12.6% of AGI
State:
15.9% of AGI
(% of AGI for various income ranges: 17.3% for AGIs $25k-50k, 4.9% for AGIs $75k-100k, 7.9% for AGIs $100k-200k, 6.5% for AGIs over 200k)
Charity contributions: $22,040 (reported on 14.9% of returns)
Here:
$22,040
State:
$6,808
(% of AGI for various income ranges: 3.7% for AGIs $50k-75k, 2.8% for AGIs $100k-200k, 5.1% for AGIs over 200k)
Taxes paid: $4,285 (reported on 19.4% of returns)
79005:
$4,285
State:
$6,921
(% of AGI for various income ranges: 1.3% for AGIs $25k-50k, 1.1% for AGIs $75k-100k, 1.2% for AGIs $100k-200k, 0.9% for AGIs over 200k)
Earned income credit: $2,267 (reported on 13.4% of returns)
Here:
$2,267
State:
$2,570
(% of AGI for various income ranges: 6.8% for AGIs below $25k, 0.9% for AGIs $25k-50k)
Percentage of individuals using paid preparers for their 2012 taxes: 76.1%
Here:
76%
State:
51%
(% for various income ranges: 66.7% for AGIs below $25k, 80.0% for AGIs $25k-50k, 72.7% for AGIs $50k-75k, 87.5% for AGIs $75k-100k, 75.0% for AGIs $100k-200k, 100.0% for AGIs over 200k)
Averages for the 2004 tax year for zip code 79005, filed in 2005:
Average Adjusted Gross Income (AGI) in 2004: $41,038 (Individual Income Tax Returns)
Here:
$41,038
State:
$47,881
Salary/wage: $32,874 (reported on 84.4% of returns)
Here:
$32,874
State:
$41,947
(% of AGI for various income ranges: 96.5% for AGIs below $10k, 81.1% for AGIs $10k-25k, 85.6% for AGIs $25k-50k, 81.1% for AGIs $50k-75k, 72.5% for AGIs $75k-100k, 33.7% for AGIs over 100k)
Taxable interest for individuals: $1,913 (reported on 35.3% of returns)
This zip code:
$1,913
Texas:
$2,255
(% of AGI for various income ranges: 4.8% for AGIs below $10k, 1.9% for AGIs $10k-25k, 1.1% for AGIs $25k-50k, 0.9% for AGIs $50k-75k, 0.4% for AGIs $75k-100k, 3.0% for AGIs over 100k)
Taxable dividends: $1,373 (reported on 14.2% of returns)
Here:
$1,373
State:
$4,261
(% of AGI for various income ranges: 4.2% for AGIs below $10k, 0.3% for AGIs $25k-50k, 0.4% for AGIs $75k-100k, 0.9% for AGIs over 100k)
Net capital gain/loss: +$3,690 (reported on 14.9% of returns)
Here:
+$3,690
State:
+$16,110
(% of AGI for various income ranges: -4.2% for AGIs below $10k, 0.0% for AGIs $10k-25k, 1.1% for AGIs $25k-50k, 0.7% for AGIs $50k-75k, 1.1% for AGIs $75k-100k, 3.0% for AGIs over 100k)
Profit/loss from business: +$6,966 (reported on 20.4% of returns)
Here:
+$6,966
State:
+$11,013
(% of AGI for various income ranges: -6.5% for AGIs below $10k, 7.9% for AGIs $10k-25k, 2.4% for AGIs $25k-50k, 0.9% for AGIs $50k-75k, 6.9% for AGIs over 100k)
Profit/loss from farming: +$1,357 (reported on 9.6% of returns)
Here:
+$1,357
State:
-$9,403
Total itemized deductions: $20,420 (24% of AGI, reported on 17.2% of returns)
Here:
$20,420
State:
$19,631
Here:
23.7% of AGI
State:
18.9% of AGI
(% of AGI for various income ranges: 23.2% for AGIs below $10k, 7.3% for AGIs $25k-50k, 13.4% for AGIs $50k-75k, 10.9% for AGIs $75k-100k, 7.0% for AGIs over 100k)
Charity contributions deductions: $7,173 (8% of AGI, reported on 13.9% of returns)
Here:
$7,173
State:
$4,753
Here:
7.8% of AGI
State:
4.2% of AGI
(% of AGI for various income ranges: 4.0% for AGIs below $10k, 1.6% for AGIs $25k-50k, 1.8% for AGIs $50k-75k, 1.6% for AGIs $75k-100k, 4.7% for AGIs over 100k)
Total tax: $6,893 (reported on 64.0% of returns)
79005:
$6,893
State:
$9,058
(% of AGI for various income ranges: 1.9% for AGIs below $10k, 4.1% for AGIs $10k-25k, 4.8% for AGIs $25k-50k, 7.9% for AGIs $50k-75k, 10.9% for AGIs $75k-100k, 20.7% for AGIs over 100k)
Earned income credit: $2,029 (reported on 18.0% of returns)
Here:
$2,029
State:
$2,024
Percentage of individuals using paid preparers for their 2004 taxes: 74.8%
Here:
75%
State:
57%
(% for various income ranges: 70.0% for AGIs below $10k, 71.4% for AGIs $10k-25k, 76.3% for AGIs $25k-50k, 81.5% for AGIs $50k-75k, 72.5% for AGIs $75k-100k, 87.9% for AGIs over 100k)
Household received Food Stamps/SNAP in the past 12 months: 54 Household did not receive Food Stamps/SNAP in the past 12 months: 570
Women who had a birth in the past 12 months: 37 (18 now married, 17 unmarried) Women who did not have a birth in the past 12 months: 365 (168 now married, 196 unmarried)
Housing units in zip code 79005 with a mortgage: 182 (2 second mortgage, 3 both second mortgage and home equity loan) Median monthly owner costs for units with a mortgage: $1,197 Median monthly owner costs for units without a mortgage: $612
Residents with income below the poverty level in 2022:
This zip code:
14.4%
Whole state:
14.0%
Residents with income below 50% of the poverty level in 2022:
This zip code:
7.3%
Whole state:
7.4%
Median number of rooms in houses and condos:
Here:
5.9
State:
6.3
Median number of rooms in apartments:
Here:
4.5
State:
4.0
Notable locations in this zip code not listed on our city pages
In group quarters: 37 (-1 institutionalized population)
Size of family households: 180 2-persons, 114 3-persons, 97 4-persons, 83 5-persons, 17 6-persons, 12 7-or-more-persons
Size of nonfamily households: 101 1-person, 12 2-persons
282 married couples with children.
144 single-parent households (11 men, 133 women).
54.3% of residents of 79005 zip code speak English at home.
43.0% of residents speak Spanish at home (57% very well, 15% well, 14% not well, 15% not at all).
0.4% of residents speak Asian or Pacific Island language at home (100% very well).
1.6% of residents speak other language at home (20% well, 80% not well).
Foreign born population: 393 (23.0%) (23.2% of them are naturalized citizens)
This zip code:
23.0%
Whole state:
17.2%
71%Honduras
28%El Salvador
1%Malaysia
9%German
9%English
4%American
2%Irish
1%Scotch-Irish
1%European
1%Scottish
Year of entry for the foreign-born population
1032010 or later
1772000 to 2009
721990 to 1999
82Before 1990
Housing units lacking complete plumbing facilities: 2.8% Housing units lacking complete kitchen facilities: 3.1%
63.5%Utility gas
24.7%Electricity
8.1%Bottled, tank, or LP gas
3.9%Other fuel
Population in 1990: 1,454. Population change in the 1990s: +74 (+5.1%).
Place of birth for U.S.-born residents:
This state: 737
Northeast: 5
Midwest: 119
South: 283
West: 129
58% of the 79005 zip code residents lived in the same house 5 years ago. Out of people who lived in different houses, 38% lived in this county. Out of people who lived in different counties, 50% lived in Texas.
90% of the 79005 zip code residents lived in the same house 1 year ago. Out of people who lived in different houses, 24% moved from this county. Out of people who lived in different houses, 16% moved from different county within same state. Out of people who lived in different houses, 67% moved from different state.
Private vs. public school enrollment:
Students in private schools in grades 1 to 8 (elementary and middle school): 24
Here:
12.6%
Texas:
8.8%
Students in private schools in grades 9 to 12 (high school): 2
Here:
1.9%
Texas:
8.0%
Students in private undergraduate colleges:
Here:
0.0%
Texas:
16.2%
Occupation by median earnings in the past 12 months ($)
76,271Construction and extraction occupations
63,948Community and social service occupations
62,839Education, training, and library occupations
60,811Business and financial operations occupations
54,240Transportation occupations
53,929Installation, maintenance, and repair occupations
Top industries in this zip code by the number of employees in 2005:
Wholesale Trade: Other Chemical and Allied Products Merchant Wholesalers (20-49 employees: 1 establishment)
Finance and Insurance: Commercial Banking (10-19: 1)
Mining: Crude Petroleum and Natural Gas Extraction (5-9: 2)
Finance and Insurance: Insurance Agencies and Brokerages (5-9: 1, 1-4: 2)
Other Services (except Public Administration): Religious Organizations (5-9: 1, 1-4: 2)
People in group quarters in 2010:
33 people in nursing facilities/skilled-nursing facilities
People in group quarters in 2000:
45 people in nursing homes
Fatal accident statistics in 2013:
Fatal accident count: 1
Vehicles involved in fatal accidents: 1
Fatal accidents caused by drunken drivers: 1
Fatalities: 1
Persons involved in fatal accidents: 1
Pedestrians involved in fatal accidents: 0
Most common first names in zip code 79005 among deceased individuals
Name
Count
Lived (average)
Mary
10
75.3 years
George
9
79.7 years
William
8
71.3 years
James
7
76.1 years
Harold
5
75.7 years
Hazel
5
82.0 years
John
5
82.4 years
Charles
5
68.8 years
Alice
5
83.4 years
Paul
4
76.0 years
Most common last names in zip code 79005 among deceased individuals
Last name
Count
Lived (average)
Trosper
10
77.1 years
Smith
9
78.9 years
Slovacek
9
76.0 years
Sell
6
85.2 years
Howard
5
74.0 years
Mills
5
82.6 years
Vaughn
4
81.0 years
Garton
4
82.0 years
Halliburton
4
89.2 years
Hoover
4
79.0 years
Discuss Booker, Texas (TX) on our hugely popular Texas forum.


+$1,357
-$9,403
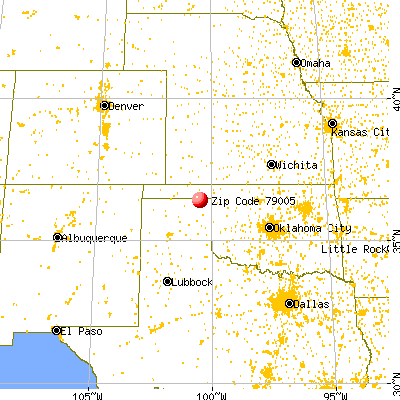
 Nearest zip codes: 79024, 79070, 79056, 73932, 79034, 73931.


