Averages for the 2012 tax year for zip code 79010, filed in 2013:
Average Adjusted Gross Income (AGI) in 2012: $46,381 (Individual Income Tax Returns)
Here:
$46,381
State:
$65,384
Salary/wage: $45,158 (reported on 90.5% of returns)
Here:
$45,158
State:
$52,524
(% of AGI for various income ranges: 85.5% for AGIs below $25k, 90.4% for AGIs $25k-50k, 92.0% for AGIs $50k-75k, 82.2% for AGIs $75k-100k)
Taxable interest for individuals: $320 (reported on 23.8% of returns)
This zip code:
$320
Texas:
$2,372
Profit/loss from business: +$1,967 (reported on 14.3% of returns)
Here:
+$1,967
State:
+$13,732
Earned income credit: $2,400 (reported on 14.3% of returns)
Here:
$2,400
State:
$2,570
(% of AGI for various income ranges: 9.5% for AGIs below $25k)
Percentage of individuals using paid preparers for their 2012 taxes: 47.6%
Here:
48%
State:
51%
(% for various income ranges: 50.0% for AGIs below $25k, 40.0% for AGIs $25k-50k, 71.4% for AGIs $50k-75k)
Averages for the 2004 tax year for zip code 79010, filed in 2005:
Average Adjusted Gross Income (AGI) in 2004: $34,854 (Individual Income Tax Returns)
Here:
$34,854
State:
$47,881
Salary/wage: $35,784 (reported on 91.7% of returns)
Here:
$35,784
State:
$41,947
(% of AGI for various income ranges: 91.7% for AGIs below $10k, 96.8% for AGIs $10k-25k, 94.4% for AGIs $25k-50k, 92.1% for AGIs $50k-75k, 97.0% for AGIs $75k-100k)
Taxable interest for individuals: $204 (reported on 28.1% of returns)
This zip code:
$204
Texas:
$2,255
Taxable dividends: $71 (reported on 7.3% of returns)
Here:
$71
State:
$4,261
Profit/loss from business: +$67 (reported on 7.8% of returns)
Here:
+$67
State:
+$11,013
Total itemized deductions: $13,000 (26% of AGI, reported on 15.6% of returns)
Here:
$13,000
State:
$19,631
Here:
26.5% of AGI
State:
18.9% of AGI
Charity contributions deductions: $3,300 (6% of AGI, reported on 10.4% of returns)
Here:
$3,300
State:
$4,753
Here:
6.3% of AGI
State:
4.2% of AGI
Total tax: $3,264 (reported on 75.0% of returns)
79010:
$3,264
State:
$9,058
(% of AGI for various income ranges: 4.3% for AGIs $10k-25k, 5.1% for AGIs $25k-50k, 8.6% for AGIs $50k-75k, 10.8% for AGIs $75k-100k)
Earned income credit: $1,360 (reported on 13.0% of returns)
Here:
$1,360
State:
$2,024
Percentage of individuals using paid preparers for their 2004 taxes: 37.5%
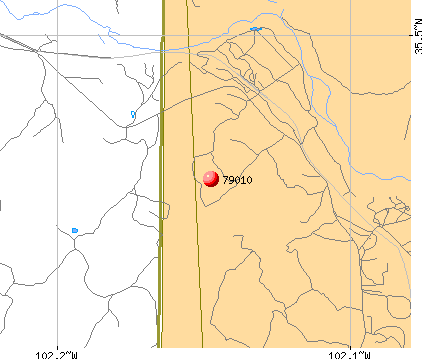
Notable locations in zip code 79010: Creek Windmill (A), High Windmill (B), Highway Windmill (C), House Windmill (D), LS Ranch (E), Parker Windmill (F), Pocket Windmill (G), Southwest Windmill (H), Cal Farley's Boys Ranch Fire Department (I), Potter County Fire Rescue Station 2 (J), Cal Farley's Boys Ranch Emergency Medical Services (K). Display/hide their locations on the map
Creeks: Sierrita de la Cruz Creek (A), Tascosa Creek (B), Tecovas Creek (C), Cedar Creek (D), Sand Creek (E), Rica Creek (F), Pescado Creek (G), Pedrosa Creek (H), Bush Creek (I). Display/hide their locations on the map
Year house built (houses)
02020 or later
02010 to 2019
02000 to 2009
31990 to 1999
01980 to 1989
31970 to 1979
131960 to 1969
151950 to 1959
21940 to 1949
61939 or earlier
Bedrooms in renter-occupied apartments in Boys Ranch, TX (79010)
0no bedroom
01 bedroom
02 bedrooms
323 bedrooms
04 bedrooms
05+ bedrooms
Cars and other vehicles available in Boys Ranch, TX (79010) in renter-occupied apartments
0no vehicle
21 vehicle
202 vehicles
93 vehicles
04 vehicles
05+ vehicles
Zip code 79010 household income distribution in 2022
16$50,000 to $59,999
6$75,000 to $99,999
7$100,000 to $124,999
3$150,000 to $199,999
Estimated median house (or condo) value in 2022 for:
White Non-Hispanic householders: $502,429
Mean price in 2022:
Detached houses: $320,264
Here:
$320,264
State:
$369,058
Mobile homes: $78,079
Here:
$78,079
State:
$124,413
Housing units in structures:
One, detached: 16
One, attached: 5
Two: 20
Mobile homes: 2
Means of transportation to work in zip code 79010
54.6%35Drove a car alone
3.1%2Bus or trolley bus
35.9%23Walked
Travel time to work (commute) in zip code 79010
3Less than 5 minutes
355 to 9 minutes
1310 to 14 minutes
730 to 34 minutes
390 or more minutes
Percentage of zip code residents living and working in this county: 89.1%
Household type by relationship:
Households: 434
Male householders: 10 (0 living alone), Female householders: 22 (16 living alone)
In group quarters: 314 (-1 institutionalized population)
Size of family households: 12 4-persons, 4 6-persons
Size of nonfamily households: 16 1-person
51 married couples with children.
0 single-parent households ().
96.2% of residents of 79010 zip code speak English at home.
1.9% of residents speak Spanish at home (100% very well).
1.2% of residents speak other Indo-European language at home (100% very well).
Foreign born population: 9 (2.3%) (0.0% of them are naturalized citizens)
:
2.3%
Whole state:
17.2%
80%Tanzania
70%Serbia
32%Irish
8%German
7%African
2%Ukrainian
2%English
1%Norwegian
Year of entry for the foreign-born population
232010 or later
02000 to 2009
01990 to 1999
0Before 1990
Housing units lacking complete plumbing facilities: 6.0% Housing units lacking complete kitchen facilities: 6.0%
66.1%Utility gas
36.3%Electricity
Place of birth for U.S.-born residents:
This state: 187
Northeast: 9
Midwest: 67
South: 99
West: 53
49% of the 79010 zip code residents lived in the same house 5 years ago. Out of people who lived in different houses, 1% lived in this county. Out of people who lived in different counties, 50% lived in Texas.
100% of the 79010 zip code residents lived in the same house 1 year ago.
Private vs. public school enrollment:
Students in private schools in grades 1 to 8 (elementary and middle school):
Here:
0.0%
Texas:
8.8%
Students in private schools in grades 9 to 12 (high school): 120
Here:
41.4%
Texas:
8.0%
Students in private undergraduate colleges:
Here:
0.0%
Texas:
16.2%
Top industries in this zip code by the number of employees in 2005:
Health Care and Social Assistance: Other Residential Care Facilities (250-499 employees: 1 establishment)
Construction: Site Preparation Contractors (1-4: 1)
Construction: Drywall and Insulation Contractors (1-4: 1)
People in group quarters in 2010:
240 people in group homes for juveniles (non-correctional)
24 people in other noninstitutional facilities
10 people in residential treatment centers for juveniles (non-correctional)
6 people in workers' group living quarters and job corps centers
People in group quarters in 2000:
225 people in other group homes
12 people in homes or halfway houses for drug/alcohol abuse
Fatal accident statistics in 2014:
Fatal accident count: 3
Vehicles involved in fatal accidents: 6
Fatal accidents caused by drunken drivers: 1
Fatalities: 7
Persons involved in fatal accidents: 12
Pedestrians involved in fatal accidents: 0
Fatal accident statistics in 2013:
Fatal accident count: 2
Vehicles involved in fatal accidents: 3
Fatal accidents caused by drunken drivers: 0
Fatalities: 2
Persons involved in fatal accidents: 6
Pedestrians involved in fatal accidents: 0
Home Mortgage Disclosure Act Aggregated Statistics For Year 2009 (Based on 2 partial tracts)
A) FHA, FSA/RHS & VA Home Purchase Loans
B) Conventional Home Purchase Loans
C) Refinancings
D) Home Improvement Loans
F) Non-occupant Loans on < 5 Family Dwellings (A B C & D)
G) Loans On Manufactured Home Dwelling (A B C & D)
Number
Average Value
Number
Average Value
Number
Average Value
Number
Average Value
Number
Average Value
Number
Average Value
LOANS ORIGINATED
5
$130,994
7
$214,576
20
$155,266
1
$91,840
1
$67,780
2
$74,595
APPLICATIONS APPROVED, NOT ACCEPTED
1
$56,520
3
$153,453
5
$154,676
0
$0
0
$0
0
$0
APPLICATIONS DENIED
1
$87,800
1
$158,950
4
$163,785
1
$6,730
0
$0
2
$53,065
APPLICATIONS WITHDRAWN
1
$70,980
0
$0
3
$173,920
0
$0
0
$0
0
$0
FILES CLOSED FOR INCOMPLETENESS
0
$0
0
$0
1
$167,700
0
$0
0
$0
0
$0
Aggregated Statistics For Year 2008 (Based on 2 partial tracts)
A) FHA, FSA/RHS & VA Home Purchase Loans
B) Conventional Home Purchase Loans
C) Refinancings
D) Home Improvement Loans
F) Non-occupant Loans on < 5 Family Dwellings (A B C & D)
G) Loans On Manufactured Home Dwelling (A B C & D)
Number
Average Value
Number
Average Value
Number
Average Value
Number
Average Value
Number
Average Value
Number
Average Value
LOANS ORIGINATED
4
$168,410
10
$190,453
10
$148,352
2
$39,020
2
$135,485
2
$99,745
APPLICATIONS APPROVED, NOT ACCEPTED
1
$99,570
3
$167,863
2
$162,060
1
$76,190
1
$60,050
1
$54,670
APPLICATIONS DENIED
1
$160,460
3
$166,463
4
$137,378
1
$22,880
0
$0
1
$81,410
APPLICATIONS WITHDRAWN
1
$84,440
1
$268,280
2
$162,060
0
$0
0
$0
0
$0
FILES CLOSED FOR INCOMPLETENESS
0
$0
0
$0
1
$121,100
0
$0
0
$0
0
$0
Aggregated Statistics For Year 2007 (Based on 2 partial tracts)
A) FHA, FSA/RHS & VA Home Purchase Loans
B) Conventional Home Purchase Loans
C) Refinancings
D) Home Improvement Loans
F) Non-occupant Loans on < 5 Family Dwellings (A B C & D)
G) Loans On Manufactured Home Dwelling (A B C & D)
Number
Average Value
Number
Average Value
Number
Average Value
Number
Average Value
Number
Average Value
Number
Average Value
LOANS ORIGINATED
2
$153,145
16
$165,951
9
$178,778
4
$32,925
2
$176,695
3
$93,350
APPLICATIONS APPROVED, NOT ACCEPTED
0
$0
3
$135,343
2
$136,915
0
$0
0
$0
1
$56,520
APPLICATIONS DENIED
1
$96,210
1
$100,080
4
$153,820
2
$46,425
0
$0
2
$54,415
APPLICATIONS WITHDRAWN
0
$0
1
$88,470
3
$139,493
0
$0
0
$0
0
$0
FILES CLOSED FOR INCOMPLETENESS
0
$0
0
$0
1
$178,290
0
$0
0
$0
0
$0
Aggregated Statistics For Year 2006 (Based on 2 partial tracts)
A) FHA, FSA/RHS & VA Home Purchase Loans
B) Conventional Home Purchase Loans
C) Refinancings
D) Home Improvement Loans
F) Non-occupant Loans on < 5 Family Dwellings (A B C & D)
G) Loans On Manufactured Home Dwelling (A B C & D)
Number
Average Value
Number
Average Value
Number
Average Value
Number
Average Value
Number
Average Value
Number
Average Value
LOANS ORIGINATED
3
$132,823
16
$123,553
8
$176,379
3
$35,377
1
$155,590
4
$68,500
APPLICATIONS APPROVED, NOT ACCEPTED
0
$0
5
$95,706
2
$95,115
0
$0
0
$0
3
$49,843
APPLICATIONS DENIED
1
$38,180
5
$99,406
7
$93,183
2
$21,615
1
$17,320
4
$51,048
APPLICATIONS WITHDRAWN
0
$0
2
$118,580
4
$170,680
0
$0
0
$0
0
$0
FILES CLOSED FOR INCOMPLETENESS
0
$0
0
$0
2
$132,540
0
$0
0
$0
0
$0
Aggregated Statistics For Year 2005 (Based on 2 partial tracts)
A) FHA, FSA/RHS & VA Home Purchase Loans
B) Conventional Home Purchase Loans
C) Refinancings
D) Home Improvement Loans
F) Non-occupant Loans on < 5 Family Dwellings (A B C & D)
G) Loans On Manufactured Home Dwelling (A B C & D)
Number
Average Value
Number
Average Value
Number
Average Value
Number
Average Value
Number
Average Value
Number
Average Value
LOANS ORIGINATED
2
$115,135
17
$129,732
11
$137,741
4
$25,272
2
$61,055
4
$57,650
APPLICATIONS APPROVED, NOT ACCEPTED
0
$0
3
$100,583
3
$146,727
1
$39,530
0
$0
1
$48,270
APPLICATIONS DENIED
0
$0
4
$118,540
7
$87,704
2
$25,400
0
$0
3
$44,630
APPLICATIONS WITHDRAWN
0
$0
2
$178,795
6
$131,223
1
$27,750
0
$0
0
$0
FILES CLOSED FOR INCOMPLETENESS
0
$0
0
$0
2
$134,560
0
$0
0
$0
0
$0
Aggregated Statistics For Year 2004 (Based on 2 partial tracts)
A) FHA, FSA/RHS & VA Home Purchase Loans
B) Conventional Home Purchase Loans
C) Refinancings
D) Home Improvement Loans
F) Non-occupant Loans on < 5 Family Dwellings (A B C & D)
G) Loans On Manufactured Home Dwelling (A B C & D)
Number
Average Value
Number
Average Value
Number
Average Value
Number
Average Value
Number
Average Value
Number
Average Value
LOANS ORIGINATED
4
$116,015
13
$144,898
16
$127,180
3
$32,127
1
$87,130
4
$66,775
APPLICATIONS APPROVED, NOT ACCEPTED
0
$0
3
$104,733
2
$178,210
0
$0
0
$0
1
$58,370
APPLICATIONS DENIED
0
$0
6
$70,475
9
$133,009
2
$36,920
1
$68,630
4
$53,572
APPLICATIONS WITHDRAWN
0
$0
2
$221,770
6
$92,258
0
$0
0
$0
1
$60,890
FILES CLOSED FOR INCOMPLETENESS
0
$0
0
$0
3
$76,193
0
$0
0
$0
0
$0
Aggregated Statistics For Year 2003 (Based on 2 partial tracts)
A) FHA, FSA/RHS & VA Home Purchase Loans
B) Conventional Home Purchase Loans
C) Refinancings
D) Home Improvement Loans
F) Non-occupant Loans on < 5 Family Dwellings (A B C & D)
Number
Average Value
Number
Average Value
Number
Average Value
Number
Average Value
Number
Average Value
LOANS ORIGINATED
3
$127,217
14
$120,035
28
$118,563
3
$18,613
1
$96,210
APPLICATIONS APPROVED, NOT ACCEPTED
0
$0
3
$102,433
3
$118,973
0
$0
0
$0
APPLICATIONS DENIED
0
$0
3
$83,597
10
$85,395
2
$36,670
0
$0
APPLICATIONS WITHDRAWN
1
$49,960
0
$0
6
$100,192
0
$0
0
$0
FILES CLOSED FOR INCOMPLETENESS
0
$0
1
$96,720
1
$110,510
0
$0
0
$0
Aggregated Statistics For Year 2002 (Based on 2 partial tracts)
A) FHA, FSA/RHS & VA Home Purchase Loans
B) Conventional Home Purchase Loans
C) Refinancings
D) Home Improvement Loans
F) Non-occupant Loans on < 5 Family Dwellings (A B C & D)
Number
Average Value
Number
Average Value
Number
Average Value
Number
Average Value
Number
Average Value
LOANS ORIGINATED
1
$116,900
13
$115,748
19
$121,555
2
$13,035
1
$82,920
APPLICATIONS APPROVED, NOT ACCEPTED
0
$0
3
$102,940
3
$113,087
1
$20,180
0
$0
APPLICATIONS DENIED
1
$62,400
3
$112,583
4
$114,545
1
$23,880
0
$0
APPLICATIONS WITHDRAWN
1
$57,520
1
$67,780
2
$134,895
0
$0
1
$23,720
FILES CLOSED FOR INCOMPLETENESS
0
$0
1
$111,180
1
$138,090
0
$0
0
$0
Aggregated Statistics For Year 2001 (Based on 2 partial tracts)
A) FHA, FSA/RHS & VA Home Purchase Loans
B) Conventional Home Purchase Loans
C) Refinancings
D) Home Improvement Loans
F) Non-occupant Loans on < 5 Family Dwellings (A B C & D)
Number
Average Value
Number
Average Value
Number
Average Value
Number
Average Value
Number
Average Value
LOANS ORIGINATED
2
$84,775
15
$103,779
21
$108,209
3
$28,313
2
$84,015
APPLICATIONS APPROVED, NOT ACCEPTED
0
$0
4
$95,538
4
$74,260
0
$0
0
$0
APPLICATIONS DENIED
0
$0
6
$54,833
8
$77,478
2
$13,960
1
$24,220
APPLICATIONS WITHDRAWN
0
$0
2
$109,245
4
$95,200
0
$0
1
$44,740
FILES CLOSED FOR INCOMPLETENESS
0
$0
0
$0
2
$70,980
0
$0
0
$0
Aggregated Statistics For Year 2000 (Based on 2 partial tracts)
A) FHA, FSA/RHS & VA Home Purchase Loans
B) Conventional Home Purchase Loans
C) Refinancings
D) Home Improvement Loans
F) Non-occupant Loans on < 5 Family Dwellings (A B C & D)
Number
Average Value
Number
Average Value
Number
Average Value
Number
Average Value
Number
Average Value
LOANS ORIGINATED
1
$81,910
16
$104,263
6
$98,958
2
$12,110
1
$112,860
APPLICATIONS APPROVED, NOT ACCEPTED
0
$0
6
$101,368
2
$50,460
1
$24,890
0
$0
APPLICATIONS DENIED
1
$30,610
7
$64,349
4
$97,555
1
$16,480
0
$0
APPLICATIONS WITHDRAWN
0
$0
1
$58,370
2
$57,440
0
$0
0
$0
FILES CLOSED FOR INCOMPLETENESS
0
$0
1
$90,320
1
$48,270
0
$0
0
$0
Aggregated Statistics For Year 1999 (Based on 1 partial tract)

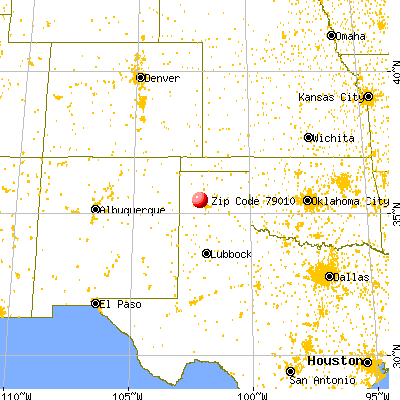


 Nearest zip codes: 79012, 79124, 79018, 79098, 79058, 79092.