Estimated zip code population in 2022: 15,770 Zip code population in 2010: 16,177 Zip code population in 2000: 15,062
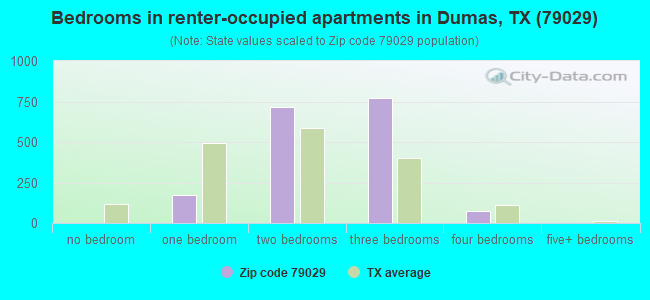
Houses and condos: 5,987 Renter-occupied apartments: 1,764
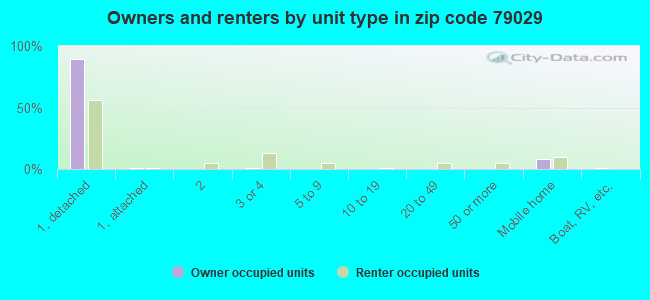
% of renters here:
33%
State:
38%
March 2022 cost of living index in zip code 79029: 77.9 (low, U.S. average is 100)
Land area: 300.9 sq. mi. Water area: 0.7 sq. mi.
Population density: 52 people per square mile
(very low).
OSM Map
General Map
Google Map
MSN Map
OSM Map
General Map
Google Map
MSN Map
OSM Map
General Map
Google Map
MSN Map
OSM Map
General Map
Google Map
MSN Map
Please wait while loading the map...
Real estate property taxes paid for housing units in 2022:
This zip code:
1.4% ($2,296)
Texas:
1.5% ($4,050)
Median real estate property taxes paid for housing units with mortgages in 2022: $2,731 (1.5%) Median real estate property taxes paid for housing units with no mortgage in 2022: $1,448 (1.1%)
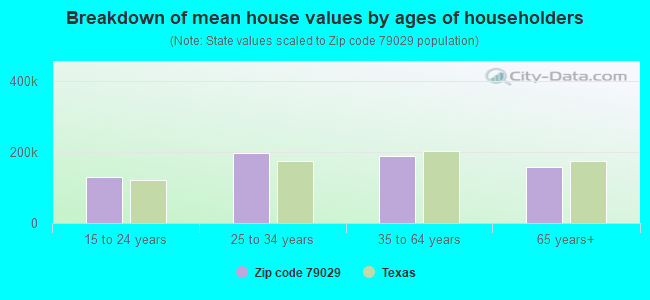
Estimated median house/condo value in 2022: $162,694
79029:
$162,694
Texas:
$275,400
According to our research of Texas and other state lists, there were 23 registered sex offenders living in 79029 zip code as of May 28, 2024. The ratio of all residents to sex offenders in zip code 79029 is 730 to 1. The ratio of registered sex offenders to all residents in this zip code is lower than the state average.
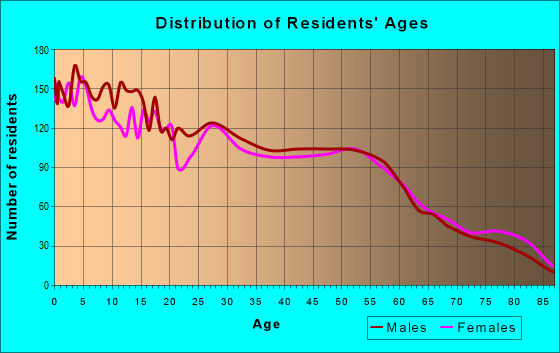
Median resident age:
This zip code:
30.1 years
Texas median age:
35.6 years
Average household size:
This zip code:
3.0 people
Texas:
2.6 people
Averages for the 2020 tax year for zip code 79029, filed in 2021:
Average Adjusted Gross Income (AGI) in 2020: $54,778 (Individual Income Tax Returns)
Here:
$54,778
State:
$77,054
Salary/wage: $50,687 (reported on 90.0% of returns)
Here:
$50,687
State:
$62,766
(% of AGI for various income ranges: 1456.8% for AGIs below $25k, 4252.5% for AGIs $25k-50k, 7071.7% for AGIs $50k-75k, 10351.7% for AGIs $75k-100k, 17447.6% for AGIs $100k-200k, 68142.5% for AGIs over 200k)
Taxable interest for individuals: $1,359 (reported on 18.5% of returns)
This zip code:
$1,359
Texas:
$2,665
(% of AGI for various income ranges: 9.7% for AGIs below $25k, 7.6% for AGIs $25k-50k, 17.4% for AGIs $50k-75k, 37.2% for AGIs $75k-100k, 149.0% for AGIs $100k-200k, 1057.5% for AGIs over 200k)
Ordinary dividends: $4,449 (reported on 8.0% of returns)
Here:
$4,449
State:
$10,044
(% of AGI for various income ranges: 10.8% for AGIs below $25k, 12.2% for AGIs $25k-50k, 27.2% for AGIs $50k-75k, 42.4% for AGIs $75k-100k, 149.8% for AGIs $100k-200k, 2405.0% for AGIs over 200k)
Net capital gain/loss in AGI: +$10,225 (reported on 7.9% of returns)
Here:
+$10,225
State:
+$39,590
(% of AGI for various income ranges: 10.0% for AGIs below $25k, 12.3% for AGIs $25k-50k, 27.6% for AGIs $50k-75k, 121.1% for AGIs $75k-100k, 362.9% for AGIs $100k-200k, 6887.5% for AGIs over 200k)
Profit/loss from business: +$5,182 (reported on 14.4% of returns)
Here:
+$5,182
State:
+$10,888
(% of AGI for various income ranges: 50.2% for AGIs below $25k, 8.9% for AGIs $25k-50k, 105.7% for AGIs $50k-75k, 87.6% for AGIs $75k-100k, 203.5% for AGIs $100k-200k, 4752.5% for AGIs over 200k)
Taxable individual retirement arrangement distribution: $25,197 (reported on 5.5% of returns)
79029:
$25,197
Texas:
$24,740
(% of AGI for various income ranges: 40.4% for AGIs below $25k, 59.4% for AGIs $25k-50k, 133.2% for AGIs $50k-75k, 435.2% for AGIs $75k-100k, 646.1% for AGIs $100k-200k, 4290.0% for AGIs over 200k)
Total itemized deductions: $35,600 (reported on 3.4% of returns)
Here:
$35,600
State:
$40,428
(% of AGI for various income ranges: 88.5% for AGIs $25k-50k, 134.7% for AGIs $50k-75k, 142.8% for AGIs $75k-100k, 450.6% for AGIs $100k-200k, 7247.5% for AGIs over 200k)
Charity contributions: $13,886 (reported on 3.0% of returns)
Here:
$13,886
State:
$18,201
(% of AGI for various income ranges: 14.1% for AGIs $25k-50k, 55.4% for AGIs $50k-75k, 181.8% for AGIs $100k-200k, 3157.5% for AGIs over 200k)
Taxes paid: $5,600 (reported on 3.1% of returns)
79029:
$5,600
State:
$7,821
(% of AGI for various income ranges: 8.5% for AGIs $25k-50k, 24.0% for AGIs $50k-75k, 25.0% for AGIs $75k-100k, 71.6% for AGIs $100k-200k, 987.5% for AGIs over 200k)
Earned income credit: $2,429 (reported on 20.1% of returns)
Here:
$2,429
State:
$2,584
(% of AGI for various income ranges: 121.1% for AGIs below $25k, 83.9% for AGIs $25k-50k, 1.7% for AGIs $50k-75k)
Percentage of individuals using paid preparers for their 2020 taxes: 89.0%
Here:
89%
State:
92%
(% for various income ranges: 86.8% for AGIs below $25k, 88.9% for AGIs $25k-50k, 90.3% for AGIs $50k-75k, 89.2% for AGIs $75k-100k, 92.4% for AGIs $100k-200k, 93.3% for AGIs over 200k)
Averages for the 2012 tax year for zip code 79029, filed in 2013:
Average Adjusted Gross Income (AGI) in 2012: $47,969 (Individual Income Tax Returns)
Here:
$47,969
State:
$65,384
Salary/wage: $43,042 (reported on 90.1% of returns)
Here:
$43,042
State:
$52,524
(% of AGI for various income ranges: 86.4% for AGIs below $25k, 89.9% for AGIs $25k-50k, 84.4% for AGIs $50k-75k, 84.1% for AGIs $75k-100k, 82.2% for AGIs $100k-200k, 48.2% for AGIs over 200k)
Taxable interest for individuals: $1,328 (reported on 20.9% of returns)
This zip code:
$1,328
Texas:
$2,372
(% of AGI for various income ranges: 0.8% for AGIs below $25k, 0.4% for AGIs $25k-50k, 0.3% for AGIs $50k-75k, 0.3% for AGIs $75k-100k, 0.6% for AGIs $100k-200k, 1.3% for AGIs over 200k)
Ordinary dividends: $3,544 (reported on 10.2% of returns)
Here:
$3,544
State:
$9,721
(% of AGI for various income ranges: 0.7% for AGIs below $25k, 0.4% for AGIs $25k-50k, 0.5% for AGIs $50k-75k, 0.3% for AGIs $75k-100k, 0.9% for AGIs $100k-200k, 2.2% for AGIs over 200k)
Net capital gain/loss in AGI: +$6,641 (reported on 8.4% of returns)
Here:
+$6,641
State:
+$35,319
(% of AGI for various income ranges: 0.4% for AGIs $25k-50k, 0.2% for AGIs $50k-75k, 0.3% for AGIs $75k-100k, 1.0% for AGIs $100k-200k, 6.2% for AGIs over 200k)
Profit/loss from business: +$14,309 (reported on 11.4% of returns)
Here:
+$14,309
State:
+$13,732
(% of AGI for various income ranges: 4.6% for AGIs below $25k, 2.7% for AGIs $25k-50k, 3.1% for AGIs $50k-75k, 2.0% for AGIs $75k-100k, 2.1% for AGIs $100k-200k, 8.2% for AGIs over 200k)
Taxable individual retirement arrangement distribution: $14,267 (reported on 7.1% of returns)
79029:
$14,267
Texas:
$19,511
(% of AGI for various income ranges: 2.9% for AGIs below $25k, 1.5% for AGIs $25k-50k, 2.5% for AGIs $50k-75k, 3.3% for AGIs $75k-100k, 2.5% for AGIs $100k-200k)
Self-employment retirement plans: $18,700 (reported on 0.3% of returns)
79029:
$18,700
Texas:
$23,938
(% of AGI for various income ranges: 0.5% for AGIs $100k-200k)
Total itemized deductions: $20,638 (19% of AGI, reported on 13.3% of returns)
Here:
$20,638
State:
$24,724
Here:
18.8% of AGI
State:
15.9% of AGI
(% of AGI for various income ranges: 3.8% for AGIs below $25k, 3.0% for AGIs $25k-50k, 5.5% for AGIs $50k-75k, 6.6% for AGIs $75k-100k, 7.8% for AGIs $100k-200k, 7.5% for AGIs over 200k)
Charity contributions: $7,926 (reported on 9.4% of returns)
Here:
$7,926
State:
$6,808
(% of AGI for various income ranges: 0.4% for AGIs below $25k, 0.5% for AGIs $25k-50k, 1.3% for AGIs $50k-75k, 1.6% for AGIs $75k-100k, 2.2% for AGIs $100k-200k, 3.5% for AGIs over 200k)
Taxes paid: $3,967 (reported on 13.1% of returns)
79029:
$3,967
State:
$6,921
(% of AGI for various income ranges: 0.5% for AGIs below $25k, 0.4% for AGIs $25k-50k, 0.9% for AGIs $50k-75k, 1.3% for AGIs $75k-100k, 1.7% for AGIs $100k-200k, 1.8% for AGIs over 200k)
Earned income credit: $2,516 (reported on 25.1% of returns)
Here:
$2,516
State:
$2,570
(% of AGI for various income ranges: 8.5% for AGIs below $25k, 2.1% for AGIs $25k-50k)
Percentage of individuals using paid preparers for their 2012 taxes: 62.8%
Here:
63%
State:
51%
(% for various income ranges: 60.1% for AGIs below $25k, 65.0% for AGIs $25k-50k, 64.2% for AGIs $50k-75k, 60.7% for AGIs $75k-100k, 62.7% for AGIs $100k-200k, 83.3% for AGIs over 200k)
Averages for the 2004 tax year for zip code 79029, filed in 2005:
Average Adjusted Gross Income (AGI) in 2004: $37,025 (Individual Income Tax Returns)
Here:
$37,025
State:
$47,881
Salary/wage: $33,774 (reported on 86.2% of returns)
Here:
$33,774
State:
$41,947
(% of AGI for various income ranges: 160.9% for AGIs below $10k, 82.0% for AGIs $10k-25k, 85.0% for AGIs $25k-50k, 80.7% for AGIs $50k-75k, 84.2% for AGIs $75k-100k, 58.9% for AGIs over 100k)
Taxable interest for individuals: $1,737 (reported on 32.0% of returns)
This zip code:
$1,737
Texas:
$2,255
(% of AGI for various income ranges: 8.2% for AGIs below $10k, 1.7% for AGIs $10k-25k, 1.0% for AGIs $25k-50k, 1.2% for AGIs $50k-75k, 0.7% for AGIs $75k-100k, 2.3% for AGIs over 100k)
Taxable dividends: $1,674 (reported on 14.8% of returns)
Here:
$1,674
State:
$4,261
(% of AGI for various income ranges: 2.2% for AGIs below $10k, 0.7% for AGIs $10k-25k, 0.5% for AGIs $25k-50k, 0.6% for AGIs $50k-75k, 0.7% for AGIs $75k-100k, 0.9% for AGIs over 100k)
Net capital gain/loss: +$4,401 (reported on 12.4% of returns)
Here:
+$4,401
State:
+$16,110
(% of AGI for various income ranges: -3.4% for AGIs below $10k, 0.3% for AGIs $10k-25k, 0.3% for AGIs $25k-50k, 0.6% for AGIs $50k-75k, 0.0% for AGIs $75k-100k, 5.5% for AGIs over 100k)
Profit/loss from business: +$12,766 (reported on 14.1% of returns)
Here:
+$12,766
State:
+$11,013
(% of AGI for various income ranges: 4.4% for AGIs below $10k, 4.3% for AGIs $10k-25k, 3.4% for AGIs $25k-50k, 3.5% for AGIs $50k-75k, 2.7% for AGIs $75k-100k, 9.5% for AGIs over 100k)
IRA payment deduction: $3,124 (reported on 1.5% of returns)
79029:
$3,124
Texas:
$3,120
(% of AGI for various income ranges: 0.1% for AGIs $10k-25k, 0.1% for AGIs $25k-50k, 0.2% for AGIs $50k-75k, 0.1% for AGIs $75k-100k, 0.1% for AGIs over 100k)
Self-employed pension: $13,111 (reported on 0.3% of returns)
Here:
$13,111
Texas:
$16,401
Total itemized deductions: $15,781 (20% of AGI, reported on 13.9% of returns)
Here:
$15,781
State:
$19,631
Here:
20.0% of AGI
State:
18.9% of AGI
(% of AGI for various income ranges: 8.7% for AGIs below $10k, 3.7% for AGIs $10k-25k, 4.0% for AGIs $25k-50k, 6.0% for AGIs $50k-75k, 6.9% for AGIs $75k-100k, 8.3% for AGIs over 100k)
Charity contributions deductions: $5,528 (7% of AGI, reported on 11.8% of returns)
Here:
$5,528
State:
$4,753
Here:
6.7% of AGI
State:
4.2% of AGI
(% of AGI for various income ranges: 0.6% for AGIs below $10k, 0.8% for AGIs $10k-25k, 1.0% for AGIs $25k-50k, 1.7% for AGIs $50k-75k, 2.1% for AGIs $75k-100k, 3.1% for AGIs over 100k)
Total tax: $5,581 (reported on 64.2% of returns)
79029:
$5,581
State:
$9,058
(% of AGI for various income ranges: 4.6% for AGIs below $10k, 2.9% for AGIs $10k-25k, 5.2% for AGIs $25k-50k, 9.1% for AGIs $50k-75k, 11.3% for AGIs $75k-100k, 18.3% for AGIs over 100k)
Earned income credit: $2,007 (reported on 25.6% of returns)
Here:
$2,007
State:
$2,024
Percentage of individuals using paid preparers for their 2004 taxes: 67.1%
Here:
67%
State:
57%
(% for various income ranges: 60.0% for AGIs below $10k, 71.0% for AGIs $10k-25k, 67.6% for AGIs $25k-50k, 63.9% for AGIs $50k-75k, 65.5% for AGIs $75k-100k, 77.2% for AGIs over 100k)
Household received Food Stamps/SNAP in the past 12 months: 582 Household did not receive Food Stamps/SNAP in the past 12 months: 4,699
Women who had a birth in the past 12 months: 236 (163 now married, 73 unmarried) Women who did not have a birth in the past 12 months: 3,352 (1,471 now married, 1,880 unmarried)
Housing units in zip code 79029 with a mortgage: 2,007 Median monthly owner costs for units with a mortgage: $1,296 Median monthly owner costs for units without a mortgage: $551
Residents with income below the poverty level in 2022:
This zip code:
13.4%
Whole state:
14.0%
Residents with income below 50% of the poverty level in 2022:
This zip code:
8.6%
Whole state:
7.4%
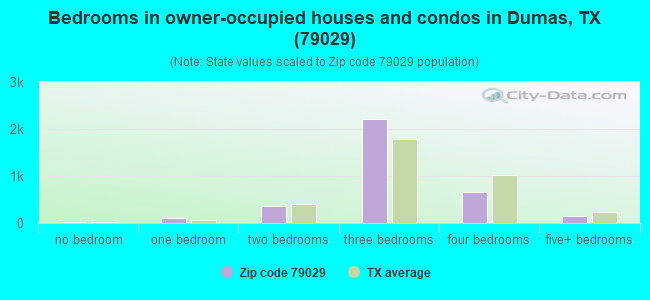
Median number of rooms in houses and condos:
Here:
5.9
State:
6.3
Median number of rooms in apartments:
Here:
4.7
State:
4.0
Notable locations in this zip code not listed on our city pages
Notable locations in zip code 79029: Terry Thompson Ranch (A), North Plains Country Club (B), Beauchamp Ranch (C), Cactus Feedyard (D), Burnett Ranch (E), Moore County Courthouse (F), Moore County Historical Museum (G), Dumas Fire Department (H). Display/hide their locations on the map
Churches in zip code 79029 include: United Pentecostal Church (A), Church of the Nazarene (B), First Street Church of Christ (C), Church of Christ (D), Temple Baptist Church (E), Southside Baptist Church (F), Primera Iglesia Bautista Church (G), First Baptist Church Hispana Mission (H), First Baptist Church (I). Display/hide their locations on the map
Parks in zip code 79029 include: Texhoma Park (1), Morton Park (2), Shamrock Park (3), Durrett Park (4), Pioneer Park (5), Phillips Park (6), Dumas Football Stadium (7), Phillips Park Baseball Fields (8), Pioneer Park Baseball Field (9). Display/hide their locations on the map
2,961 married couples with children.
1,382 single-parent households (270 men, 1,112 women).
54.6% of residents of 79029 zip code speak English at home.
39.4% of residents speak Spanish at home (63% very well, 13% well, 15% not well, 9% not at all).
0.4% of residents speak other Indo-European language at home (50% very well, 50% well).
2.9% of residents speak Asian or Pacific Island language at home (56% very well, 23% well, 13% not well, 8% not at all).
2.2% of residents speak other language at home (77% very well, 14% well, 9% not well).
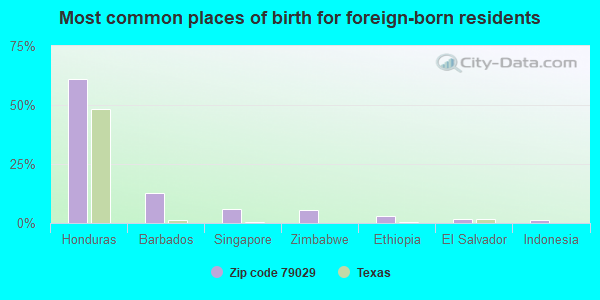
Foreign born population: 3,267 (20.7%) (33.7% of them are naturalized citizens)
This zip code:
20.7%
Whole state:
17.2%
61%Honduras
13%Barbados
6%Singapore
6%Zimbabwe
3%Ethiopia
2%El Salvador
1%Indonesia
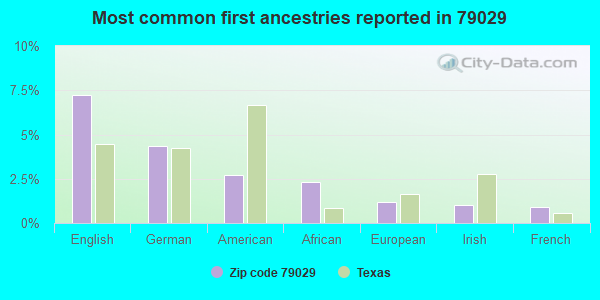
7%English
4%German
3%American
2%African
1%European
1%Irish
1%French
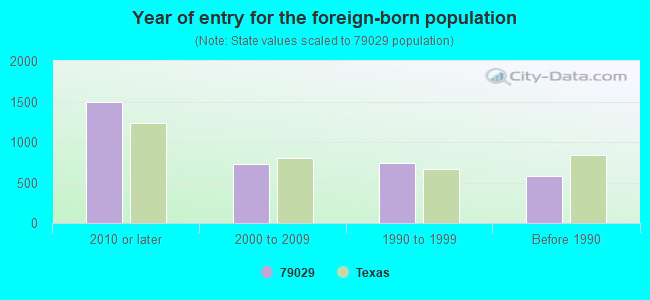
Year of entry for the foreign-born population
1,4882010 or later
7292000 to 2009
7431990 to 1999
584Before 1990
Facilities with environmental interests located in this zip code:
AMAX POTASH CORPORATION (5 MILES N OF DUMAS TEXAS in DUMAS, TX)
(Resource Conservation and Recovery Act (tracking hazardous waste)) TRI REPORTER (Tracking of toxic chemicals releasing facilities) Business SIC classification: INDUSTRIAL INORGANIC CHEMICALS
ACE SPRAYING SERVICE INC (HWY 87 W DUMAS AIRPORT in DUMAS, TX)
(Resource Conservation and Recovery Act (tracking hazardous waste)) Business NAICS classification: SOIL PREPARATION, PLANTING, AND CULTIVATING.
B & B RECOVERY INC (1607 S BLISS in DUMAS, TX)
(Resource Conservation and Recovery Act (tracking hazardous waste)) Business NAICS classification: GENERAL AUTOMOTIVE REPAIR. Organizations: LES WILLIAM BLEVINS (CONTACT/OPERATOR)
Alternative names: PANHANDLE TRUCK & TRAILER REPAIR
AMERICAN ZINC (HWY 287 APPROX 35 MI N & 5 MI in DUMAS, TX)
(Resource Conservation and Recovery Act (tracking hazardous waste))
ANADARKO GATHERING CO (12 MI S, 11 MI E, 2.5 MI N in DUMAS, TX)
AIR MAJOR (AIRS/AFS) Business SIC classification: NATURAL GAS TRANSMISSION
ANADARKO GATHERING CO. (12 MI. S., 11 MI. E., 2.5 MI. in DUMAS, TX)
CRITERIA AND HAZARDOUS AIR POLLUTANT INVENTORY (Inventory of air pollution sources) Business SIC classification: NATURAL GAS TRANSMISSION Business NAICS classification: PIPELINE TRANSPORTATION OF NATURAL GAS.
Housing units lacking complete plumbing facilities: 1.6% Housing units lacking complete kitchen facilities: 5.9%
58.9%Utility gas
37.1%Electricity
2.0%Bottled, tank, or LP gas
1.1%No fuel used
0.7%Other fuel
Population in 1990: 15,902.
Place of birth for U.S.-born residents:
This state: 9,337
Northeast: 186
Midwest: 690
South: 587
West: 1,515
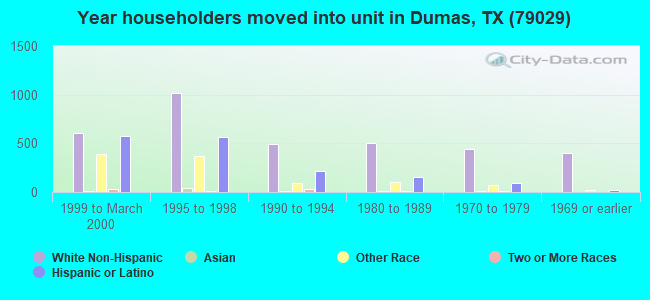
50% of the 79029 zip code residents lived in the same house 5 years ago. Out of people who lived in different houses, 62% lived in this county. Out of people who lived in different counties, 50% lived in Texas.
93% of the 79029 zip code residents lived in the same house 1 year ago. Out of people who lived in different houses, 64% moved from this county. Out of people who lived in different houses, 27% moved from different county within same state. Out of people who lived in different houses, 9% moved from different state.
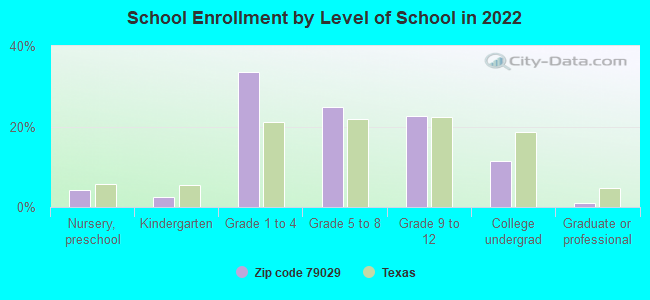
Private vs. public school enrollment:
Students in private schools in grades 1 to 8 (elementary and middle school):
Here:
0.0%
Texas:
8.8%
Students in private schools in grades 9 to 12 (high school):
Here:
0.0%
Texas:
8.0%
Students in private undergraduate colleges: 48
Here:
10.1%
Texas:
16.2%
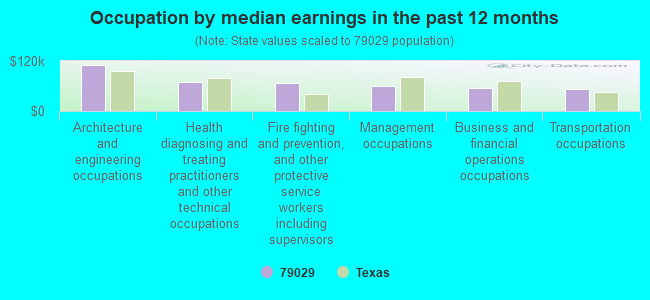
Occupation by median earnings in the past 12 months ($)
110,582Architecture and engineering occupations
70,351Health diagnosing and treating practitioners and other technical occupations
66,968Fire fighting and prevention, and other protective service workers including supervisors
58,942Management occupations
55,527Business and financial operations occupations
52,553Transportation occupations
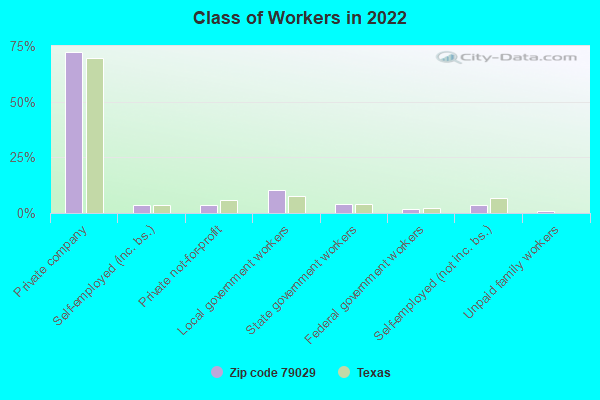
Top industries in this zip code by the number of employees in 2005:
Health Care and Social Assistance: General Medical and Surgical Hospitals (250-499 employees: 1 establishment)
Construction: Oil and Gas Pipeline and Related Structures Construction (100-249: 1, 20-49: 1, 10-19: 1)
Other Services (except Public Administration): Religious Organizations (20-49: 1, 10-19: 1, 5-9: 5, 1-4: 10)
Health Care and Social Assistance: Offices of Physicians (except Mental Health Specialists) (10-19: 1, 5-9: 9, 1-4: 6)
Accommodation and Food Services: Hotels (except Casino Hotels) and Motels (10-19: 4, 5-9: 2, 1-4: 1)
People in group quarters in 2010:
101 people in nursing facilities/skilled-nursing facilities
39 people in local jails and other municipal confinement facilities
13 people in residential treatment centers for adults
People in group quarters in 2000:
102 people in nursing homes
60 people in orthopedic wards and institutions for the physically handicapped
35 people in local jails and other confinement facilities (including police lockups)
7 people in other noninstitutional group quarters
Fatal accident statistics in 2014:
Fatal accident count: 5
Vehicles involved in fatal accidents: 7
Fatal accidents caused by drunken drivers: 2
Fatalities: 5
Persons involved in fatal accidents: 18
Pedestrians involved in fatal accidents: 0
Fatal accident statistics in 2013:
Fatal accident count: 7
Vehicles involved in fatal accidents: 11
Fatal accidents caused by drunken drivers: 2
Fatalities: 16
Persons involved in fatal accidents: 23
Pedestrians involved in fatal accidents: 1
2002 - 2018 National Fire Incident Reporting System (NFIRS) incidents
According to the data from the years 2002 - 2018 the average number of fires per year is 88. The highest number of reported fire incidents - 139 took place in 2011, and the least - 27 in 2005. The data has a rising trend.
When looking into fire subcategories, the most reports belonged to: Outside Fires (62.1%), and Structure Fires (20.3%).
Fire incident types reported to NFIRS in Zip Code 79029
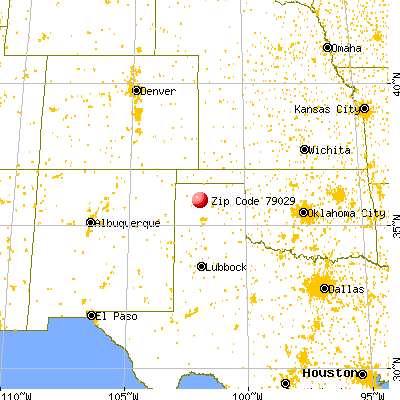


 Nearest zip codes: 79013, 79018, 79086, 79105, 79044, 79058.


 According to the data from the years 2002 - 2018 the average number of fires per year is 88. The highest number of reported fire incidents - 139 took place in 2011, and the least - 27 in 2005. The data has a rising trend.
 When looking into fire subcategories, the most reports belonged to: Outside Fires (62.1%), and Structure Fires (20.3%).