Estimated zip code population in 2022: 1,198 Zip code population in 2010: 1,206 Zip code population in 2000: 1,207
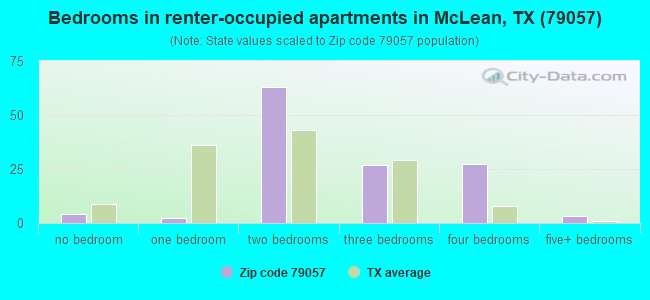
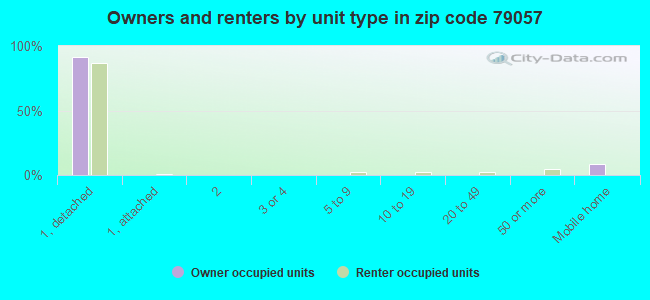
Houses and condos: 646 Renter-occupied apartments: 126
% of renters here:
27%
State:
38%
March 2022 cost of living index in zip code 79057: 78.1 (low, U.S. average is 100)
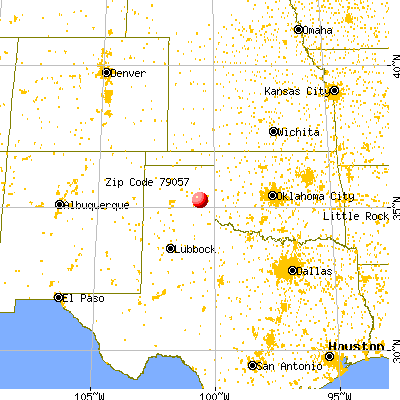
Land area: 384.9 sq. mi. Water area: 1.0 sq. mi.
Population density: 3 people per square mile
(very low).
OSM Map
General Map
Google Map
MSN Map
OSM Map
General Map
Google Map
MSN Map
OSM Map
General Map
Google Map
MSN Map
OSM Map
General Map
Google Map
MSN Map
Please wait while loading the map...
Real estate property taxes paid for housing units in 2022:
This zip code:
1.1% ($1,049)
Texas:
1.5% ($4,050)
Median real estate property taxes paid for housing units with mortgages in 2022: $1,247 (1.3%) Median real estate property taxes paid for housing units with no mortgage in 2022: $748 (1.3%)
Business Search- 14 Million verified businesses
Males: 569
(47.5%)
Females: 629
(52.5%)
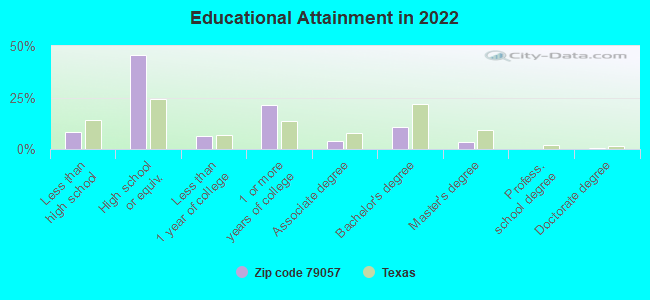
For population 25 years and over in 79057:
High school or higher: 89.2%
Bachelor's degree or higher: 14.3%
Graduate or professional degree: 3.7%
Unemployed: 2.1%
Mean travel time to work (commute): 31.0 minutes
For population 15 years and over in 79057:
Never married: 28.0%
Now married: 52.3%
Separated: 0.0%
Widowed: 8.4%
Divorced: 11.2%
Zip code 79057 compared to state average:
Median house value significantly below state average.
Unemployed percentage below state average.
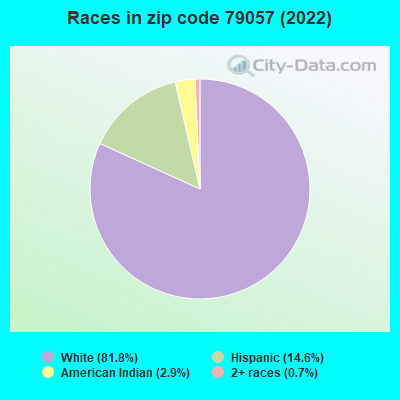
Black race population percentage significantly below state average.
Hispanic race population percentage below state average.
Foreign-born population percentage significantly below state average.
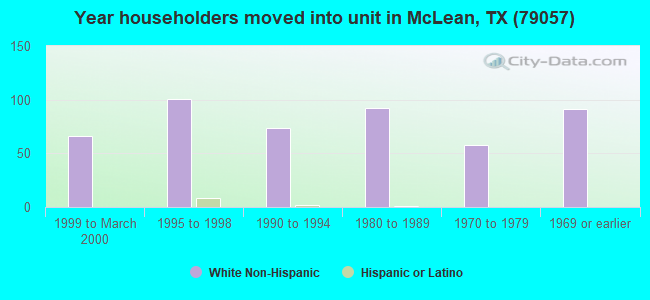
Length of stay since moving in significantly above state average.
House age significantly above state average.
Number of college students significantly below state average.
Percentage of population with a bachelor's degree or higher significantly below state average.
Averages for the 2020 tax year for zip code 79057, filed in 2021:
Average Adjusted Gross Income (AGI) in 2020: $51,181 (Individual Income Tax Returns)
Here:
$51,181
State:
$77,054
Salary/wage: $46,612 (reported on 78.6% of returns)
Here:
$46,612
State:
$62,766
(% of AGI for various income ranges: 1168.3% for AGIs below $25k, 3985.0% for AGIs $25k-50k, 6715.0% for AGIs $50k-75k, 7650.0% for AGIs $75k-100k, 19370.0% for AGIs $100k-200k)
Taxable interest for individuals: $990 (reported on 23.8% of returns)
This zip code:
$990
Texas:
$2,665
(% of AGI for various income ranges: 2.5% for AGIs below $25k, 17.5% for AGIs $25k-50k, 10.0% for AGIs $50k-75k, 260.0% for AGIs $100k-200k)
Ordinary dividends: $3,700 (reported on 9.5% of returns)
Here:
$3,700
State:
$10,044
(% of AGI for various income ranges: 493.3% for AGIs $75k-100k)
Net capital gain/loss in AGI: +$6,175 (reported on 9.5% of returns)
Here:
+$6,175
State:
+$39,590
(% of AGI for various income ranges: 617.5% for AGIs $50k-75k)
Profit/loss from business: +$2,862 (reported on 19.0% of returns)
Here:
+$2,862
State:
+$10,888
(% of AGI for various income ranges: 117.5% for AGIs below $25k, 6.2% for AGIs $25k-50k, 207.5% for AGIs $50k-75k)
Earned income credit: $2,589 (reported on 21.4% of returns)
Here:
$2,589
State:
$2,584
(% of AGI for various income ranges: 125.8% for AGIs below $25k, 102.5% for AGIs $25k-50k)
Percentage of individuals using paid preparers for their 2020 taxes: 92.9%
Here:
93%
State:
92%
(% for various income ranges: 94.1% for AGIs below $25k, 90.0% for AGIs $25k-50k, 83.3% for AGIs $50k-75k, 100.0% for AGIs $75k-100k, 100.0% for AGIs $100k-200k)
Averages for the 2012 tax year for zip code 79057, filed in 2013:
Average Adjusted Gross Income (AGI) in 2012: $52,592 (Individual Income Tax Returns)
Here:
$52,592
State:
$65,384
Salary/wage: $39,661 (reported on 79.2% of returns)
Here:
$39,661
State:
$52,524
(% of AGI for various income ranges: 72.6% for AGIs below $25k, 74.2% for AGIs $25k-50k, 79.4% for AGIs $50k-75k, 74.9% for AGIs $75k-100k, 40.1% for AGIs $100k-200k)
Taxable interest for individuals: $838 (reported on 27.1% of returns)
This zip code:
$838
Texas:
$2,372
(% of AGI for various income ranges: 1.5% for AGIs below $25k, 0.6% for AGIs $25k-50k, 0.7% for AGIs $50k-75k, 0.2% for AGIs $100k-200k)
Ordinary dividends: $6,360 (reported on 10.4% of returns)
Here:
$6,360
State:
$9,721
Net capital gain/loss in AGI: +$780 (reported on 10.4% of returns)
Here:
+$780
State:
+$35,319
Profit/loss from business: +$12,364 (reported on 22.9% of returns)
Here:
+$12,364
State:
+$13,732
(% of AGI for various income ranges: 11.3% for AGIs $25k-50k, 22.5% for AGIs $75k-100k)
Taxable individual retirement arrangement distribution: $14,550 (reported on 4.2% of returns)
79057:
$14,550
Texas:
$19,511
Total itemized deductions: $23,450 (18% of AGI, reported on 12.5% of returns)
Here:
$23,450
State:
$24,724
Here:
18.5% of AGI
State:
15.9% of AGI
(% of AGI for various income ranges: 18.1% for AGIs below $25k, 11.7% for AGIs $50k-75k, 5.2% for AGIs $100k-200k)
Charity contributions: $9,200 (reported on 10.4% of returns)
Here:
$9,200
State:
$6,808
Taxes paid: $2,733 (reported on 12.5% of returns)
79057:
$2,733
State:
$6,921
(% of AGI for various income ranges: 1.5% for AGIs below $25k, 1.5% for AGIs $50k-75k, 0.7% for AGIs $100k-200k)
Earned income credit: $2,080 (reported on 20.8% of returns)
Here:
$2,080
State:
$2,570
(% of AGI for various income ranges: 6.7% for AGIs below $25k, 1.4% for AGIs $25k-50k)
Percentage of individuals using paid preparers for their 2012 taxes: 58.3%
Here:
58%
State:
51%
(% for various income ranges: 50.0% for AGIs below $25k, 58.3% for AGIs $25k-50k, 66.7% for AGIs $50k-75k, 60.0% for AGIs $75k-100k, 80.0% for AGIs $100k-200k)
Averages for the 2004 tax year for zip code 79057, filed in 2005:
Average Adjusted Gross Income (AGI) in 2004: $32,564 (Individual Income Tax Returns)
Here:
$32,564
State:
$47,881
Salary/wage: $25,957 (reported on 76.1% of returns)
Here:
$25,957
State:
$41,947
(% of AGI for various income ranges: 89.6% for AGIs below $10k, 74.5% for AGIs $10k-25k, 74.5% for AGIs $25k-50k, 69.7% for AGIs $50k-75k, 59.3% for AGIs $75k-100k, 27.2% for AGIs over 100k)
Taxable interest for individuals: $1,602 (reported on 39.7% of returns)
This zip code:
$1,602
Texas:
$2,255
(% of AGI for various income ranges: 8.4% for AGIs below $10k, 2.2% for AGIs $10k-25k, 1.9% for AGIs $25k-50k, 1.8% for AGIs $50k-75k, 1.1% for AGIs $75k-100k, 1.4% for AGIs over 100k)
Taxable dividends: $2,164 (reported on 12.1% of returns)
Here:
$2,164
State:
$4,261
(% of AGI for various income ranges: 1.3% for AGIs below $10k, 1.0% for AGIs $10k-25k, 1.0% for AGIs $25k-50k, 1.8% for AGIs $50k-75k)
Net capital gain/loss: +$5,950 (reported on 13.2% of returns)
Here:
+$5,950
State:
+$16,110
(% of AGI for various income ranges: 2.1% for AGIs below $10k, 0.7% for AGIs $10k-25k, 0.4% for AGIs $25k-50k, 1.4% for AGIs $50k-75k, 7.4% for AGIs over 100k)
Profit/loss from business: +$991 (reported on 23.2% of returns)
Here:
+$991
State:
+$11,013
(% of AGI for various income ranges: 18.0% for AGIs below $10k, 3.1% for AGIs $10k-25k, -1.1% for AGIs $25k-50k, -0.1% for AGIs $50k-75k, -0.9% for AGIs $75k-100k)
Total itemized deductions: $15,204 (32% of AGI, reported on 11.8% of returns)
Here:
$15,204
State:
$19,631
Here:
31.6% of AGI
State:
18.9% of AGI
Charity contributions deductions: $4,581 (9% of AGI, reported on 9.4% of returns)
Here:
$4,581
State:
$4,753
Here:
9.0% of AGI
State:
4.2% of AGI
Total tax: $4,390 (reported on 67.5% of returns)
79057:
$4,390
State:
$9,058
(% of AGI for various income ranges: 4.4% for AGIs below $10k, 3.5% for AGIs $10k-25k, 5.6% for AGIs $25k-50k, 8.0% for AGIs $50k-75k, 12.1% for AGIs $75k-100k, 16.5% for AGIs over 100k)
Earned income credit: $1,821 (reported on 20.8% of returns)
Here:
$1,821
State:
$2,024
Percentage of individuals using paid preparers for their 2004 taxes: 70.8%
Here:
71%
State:
57%
(% for various income ranges: 64.8% for AGIs below $10k, 74.5% for AGIs $10k-25k, 71.6% for AGIs $25k-50k, 64.4% for AGIs $50k-75k, 78.9% for AGIs $75k-100k, 88.9% for AGIs over 100k)
Household received Food Stamps/SNAP in the past 12 months: 51 Household did not receive Food Stamps/SNAP in the past 12 months: 408
Women who had a birth in the past 12 months: 9 (9 now married, 0 unmarried) Women who did not have a birth in the past 12 months: 333 (121 now married, 212 unmarried)
Housing units in zip code 79057 with a mortgage: 129 Median monthly owner costs for units with a mortgage: $1,149 Median monthly owner costs for units without a mortgage: $324
Residents with income below the poverty level in 2022:
This zip code:
15.8%
Whole state:
14.0%
Residents with income below 50% of the poverty level in 2022:
This zip code:
9.5%
Whole state:
7.4%
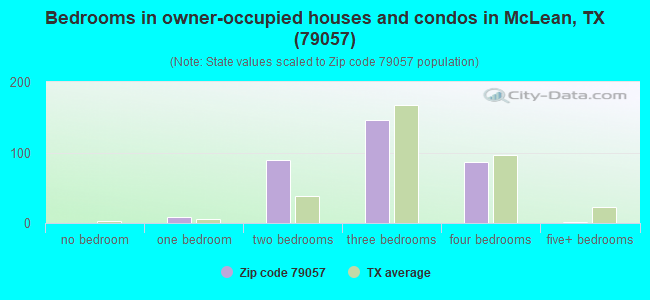
Median number of rooms in houses and condos:
Here:
5.7
State:
6.3
Median number of rooms in apartments:
Here:
5.0
State:
4.0
Notable locations in this zip code not listed on our city pages
Notable locations in zip code 79057: Dial-Dickey Ranch (A), Hudgens Ranch (B), Pursley Ranch (C), Taylor Ranch (D), Johnson Ranch (E), McLean Volunteer Fire Department (F), McLean-Alanreed Museum (G), Devils Rope Museum (H), McLean Emergency Medical Service (I), Historical Museum of Barbed Wire and Fencing Tools (J). Display/hide their locations on the map
Reservoirs: Sandspru Lake (A), Spencer Lake (B), Sandspur Club Lake (C), Machina Lake (D), Hrnciar Lake (E), Avent Reservoir (F), Cubine Lake (G), R D Back Lake (H). Display/hide their locations on the map
Creeks: Skillet Creek (A), McClellan Creek (B), Peterson Creek (C), Dry Sandy Creek (D), Rock Creek (E), Pond Creek (F), Parks Creek (G), Mitchell Creek (H), Hackberry Creek (I). Display/hide their locations on the map
Tourist attraction (not listed on the city page) : Devil's Rope Museum (Cultural Attractions- Events- & Facilities; 100 South Kingsley Street) (1). Display/hide its approximate location on the map
In group quarters: 44 (-1 institutionalized population)
Size of family households: 151 2-persons, 89 3-persons, 35 4-persons, 11 5-persons, 59 6-persons, 3 7-or-more-persons
Size of nonfamily households: 91 1-person, 17 2-persons
153 married couples with children.
193 single-parent households (4 men, 189 women).
88.6% of residents of 79057 zip code speak English at home.
10.8% of residents speak Spanish at home (54% very well, 34% well, 12% not well).
0.4% of residents speak other Indo-European language at home (100% very well).
Foreign born population: 46 (3.9%) (47.1% of them are naturalized citizens)
This zip code:
3.9%
Whole state:
17.2%
50%Honduras
13%Hungary
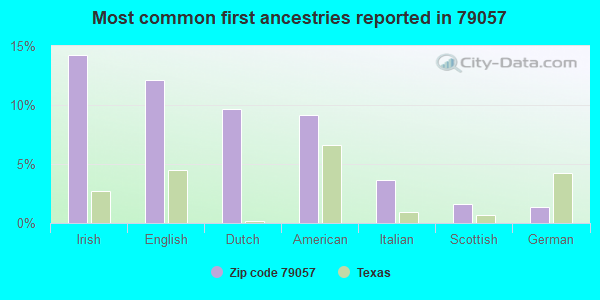
14%Irish
12%English
10%Dutch
9%American
4%Italian
2%Scottish
1%German
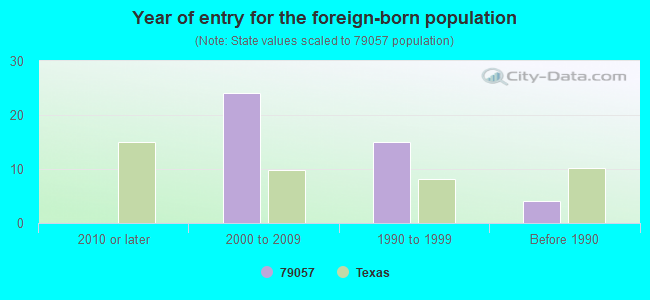
Year of entry for the foreign-born population
02010 or later
242000 to 2009
151990 to 1999
4Before 1990
Housing units lacking complete plumbing facilities: 9.9% Housing units lacking complete kitchen facilities: 4.5%
60.5%Utility gas
30.9%Electricity
4.4%Other fuel
3.2%Bottled, tank, or LP gas
1.2%No fuel used
Population in 1990: 1,151. Population change in the 1990s: +56 (+4.9%).
Place of birth for U.S.-born residents:
This state: 878
Northeast: 2
Midwest: 37
South: 154
West: 73
61% of the 79057 zip code residents lived in the same house 5 years ago. Out of people who lived in different houses, 37% lived in this county. Out of people who lived in different counties, 50% lived in Texas.
81% of the 79057 zip code residents lived in the same house 1 year ago. Out of people who lived in different houses, 37% moved from this county. Out of people who lived in different houses, 11% moved from different county within same state. Out of people who lived in different houses, 55% moved from different state.
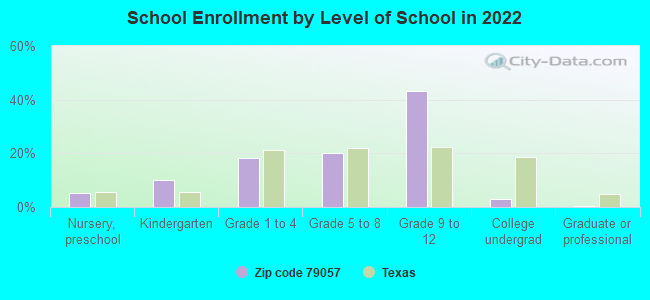
Private vs. public school enrollment:
Students in private schools in grades 1 to 8 (elementary and middle school): 18
Here:
15.7%
Texas:
8.8%
Students in private schools in grades 9 to 12 (high school): 2
Here:
1.6%
Texas:
8.0%
Students in private undergraduate colleges:
Here:
0.0%
Texas:
16.2%
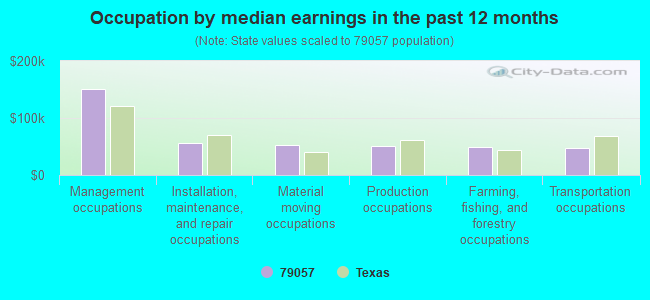
Occupation by median earnings in the past 12 months ($)
150,042Management occupations
56,624Installation, maintenance, and repair occupations
52,219Material moving occupations
51,741Production occupations
49,144Farming, fishing, and forestry occupations
47,191Transportation occupations
Top industries in this zip code by the number of employees in 2005:
Health Care and Social Assistance: Nursing Care Facilities (50-99 employees: 1 establishment)
Health Care and Social Assistance: Home Health Care Services (10-19: 1)
Wholesale Trade: Business to Business Electronic Markets (10-19: 1)
Finance and Insurance: Commercial Banking (5-9: 1)
Other Services (except Public Administration): Religious Organizations (1-4: 3)
Arts, Entertainment, and Recreation: Museums (1-4: 2)
People in group quarters in 2010:
34 people in nursing facilities/skilled-nursing facilities
People in group quarters in 2000:
104 people in nursing homes
Fatal accident statistics in 2014:
Fatal accident count: 1
Vehicles involved in fatal accidents: 1
Fatal accidents caused by drunken drivers: 0
Fatalities: 2
Persons involved in fatal accidents: 4
Pedestrians involved in fatal accidents: 0
Fatal accident statistics in 2013:
Fatal accident count: 1
Vehicles involved in fatal accidents: 1
Fatal accidents caused by drunken drivers: 1
Fatalities: 1
Persons involved in fatal accidents: 1
Pedestrians involved in fatal accidents: 0
2002 - 2014 National Fire Incident Reporting System (NFIRS) incidents
Based on the data from the years 2002 - 2014 the average number of fire incidents per year is 49. The highest number of fire incidents - 91 took place in 2011, and the least - 2 in 2007. The data has a decreasing trend.
When looking into fire subcategories, the most incidents belonged to: Outside Fires (77.0%), and Mobile Property/Vehicle Fires (15.0%).
Fire incident types reported to NFIRS in Zip Code 79057


 Nearest zip codes: 79054, 79237, 79061, 79251, 79240, 79065.
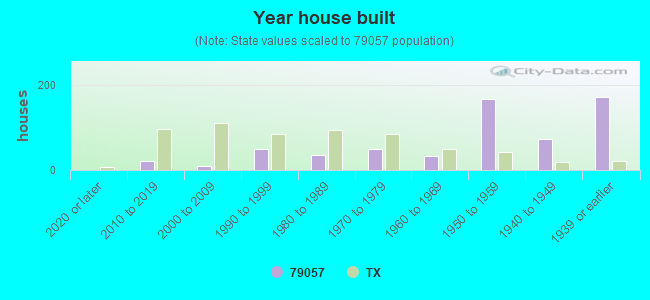


 Based on the data from the years 2002 - 2014 the average number of fire incidents per year is 49. The highest number of fire incidents - 91 took place in 2011, and the least - 2 in 2007. The data has a decreasing trend.
 When looking into fire subcategories, the most incidents belonged to: Outside Fires (77.0%), and Mobile Property/Vehicle Fires (15.0%).