Estimated zip code population in 2022: 3,344 Zip code population in 2010: 3,912 Zip code population in 2000: 3,497
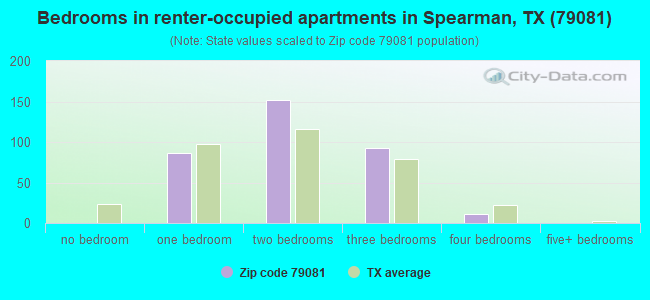
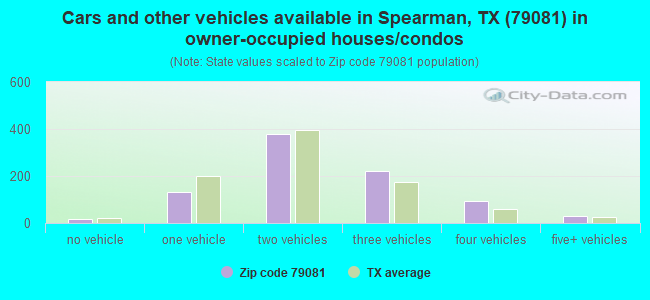
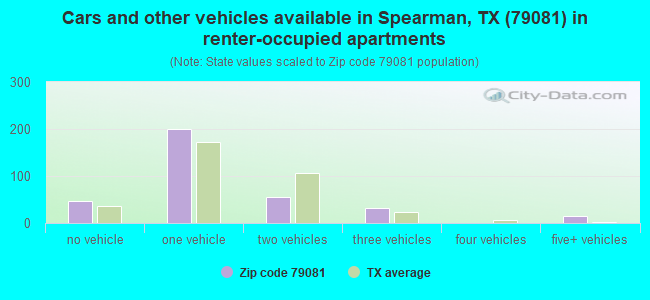
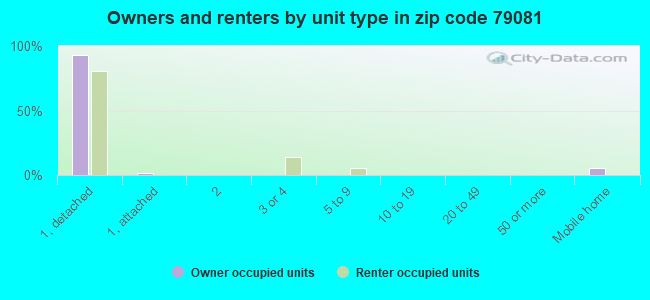
Houses and condos: 1,612 Renter-occupied apartments: 348
% of renters here:
28%
State:
38%
March 2022 cost of living index in zip code 79081: 75.7 (low, U.S. average is 100)
Land area: 643.5 sq. mi. Water area: 0.4 sq. mi.
Population density: 5 people per square mile
(very low).
OSM Map
General Map
Google Map
MSN Map
OSM Map
General Map
Google Map
MSN Map
OSM Map
General Map
Google Map
MSN Map
OSM Map
General Map
Google Map
MSN Map
Please wait while loading the map...
Real estate property taxes paid for housing units in 2022:
This zip code:
1.8% ($1,995)
Texas:
1.5% ($4,050)
Median real estate property taxes paid for housing units with mortgages in 2022: $2,788 (1.7%) Median real estate property taxes paid for housing units with no mortgage in 2022: $1,864 (1.8%)
Business Search- 14 Million verified businesses
Males: 1,813
(54.2%)
Females: 1,530
(45.8%)
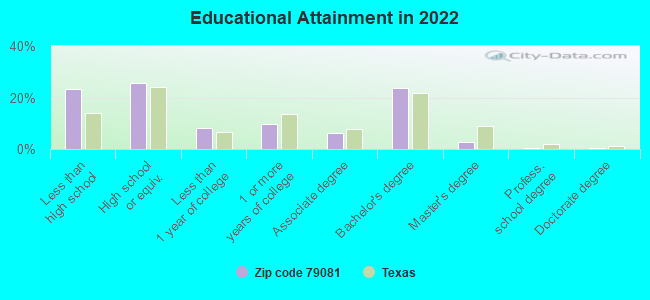
For population 25 years and over in 79081:
High school or higher: 75.6%
Bachelor's degree or higher: 26.9%
Graduate or professional degree: 3.7%
Unemployed: 4.0%
Mean travel time to work (commute): 19.9 minutes
For population 15 years and over in 79081:
Never married: 25.4%
Now married: 59.7%
Separated: 1.9%
Widowed: 7.2%
Divorced: 5.8%
Zip code 79081 compared to state average:
Median house value significantly below state average.
Black race population percentage significantly below state average.
Length of stay since moving in above state average.
Estimated median house/condo value in 2022: $108,309
79081:
$108,309
Texas:
$275,400
According to our research of Texas and other state lists, there were 7 registered sex offenders living in 79081 zip code as of May 28, 2024. The ratio of all residents to sex offenders in zip code 79081 is 605 to 1. The ratio of registered sex offenders to all residents in this zip code is lower than the state average.
Median resident age:
This zip code:
35.8 years
Texas median age:
35.6 years
Average household size:
This zip code:
2.7 people
Texas:
2.6 people
Averages for the 2020 tax year for zip code 79081, filed in 2021:
Average Adjusted Gross Income (AGI) in 2020: $65,691 (Individual Income Tax Returns)
Here:
$65,691
State:
$77,054
Salary/wage: $48,812 (reported on 83.8% of returns)
Here:
$48,812
State:
$62,766
(% of AGI for various income ranges: 1350.9% for AGIs below $25k, 4143.2% for AGIs $25k-50k, 7373.8% for AGIs $50k-75k, 10826.7% for AGIs $75k-100k, 15734.0% for AGIs $100k-200k)
Taxable interest for individuals: $2,340 (reported on 27.0% of returns)
This zip code:
$2,340
Texas:
$2,665
(% of AGI for various income ranges: 14.8% for AGIs below $25k, 26.5% for AGIs $25k-50k, 53.8% for AGIs $50k-75k, 68.9% for AGIs $75k-100k, 362.0% for AGIs $100k-200k)
Ordinary dividends: $3,756 (reported on 12.2% of returns)
Here:
$3,756
State:
$10,044
(% of AGI for various income ranges: 16.7% for AGIs below $25k, 72.5% for AGIs $50k-75k, 160.0% for AGIs $100k-200k)
Net capital gain/loss in AGI: +$57,559 (reported on 11.5% of returns)
Here:
+$57,559
State:
+$39,590
(% of AGI for various income ranges: 5.2% for AGIs below $25k, 100.6% for AGIs $50k-75k, 594.0% for AGIs $100k-200k)
Profit/loss from business: +$9,927 (reported on 22.3% of returns)
Here:
+$9,927
State:
+$10,888
(% of AGI for various income ranges: 173.9% for AGIs below $25k, 94.5% for AGIs $25k-50k, 266.2% for AGIs $50k-75k, 246.7% for AGIs $75k-100k, 1158.0% for AGIs $100k-200k)
Taxable individual retirement arrangement distribution: $13,844 (reported on 6.1% of returns)
79081:
$13,844
Texas:
$24,740
(% of AGI for various income ranges: 85.8% for AGIs below $25k, 248.1% for AGIs $50k-75k, 566.0% for AGIs $100k-200k)
Total itemized deductions: $34,750 (reported on 4.1% of returns)
Here:
$34,750
State:
$40,428
(% of AGI for various income ranges: 269.0% for AGIs $25k-50k, 1251.0% for AGIs $100k-200k)
Charity contributions: $17,725 (reported on 2.7% of returns)
Here:
$17,725
State:
$18,201
(% of AGI for various income ranges: 709.0% for AGIs $100k-200k)
Taxes paid: $4,650 (reported on 4.1% of returns)
79081:
$4,650
State:
$7,821
(% of AGI for various income ranges: 24.8% for AGIs $25k-50k, 202.0% for AGIs $100k-200k)
Earned income credit: $2,642 (reported on 17.6% of returns)
Here:
$2,642
State:
$2,584
(% of AGI for various income ranges: 118.8% for AGIs below $25k, 95.2% for AGIs $25k-50k)
Percentage of individuals using paid preparers for their 2020 taxes: 88.5%
Here:
89%
State:
92%
(% for various income ranges: 84.8% for AGIs below $25k, 87.8% for AGIs $25k-50k, 91.3% for AGIs $50k-75k, 92.9% for AGIs $75k-100k, 94.4% for AGIs $100k-200k, 83.3% for AGIs over 200k)
Averages for the 2012 tax year for zip code 79081, filed in 2013:
Average Adjusted Gross Income (AGI) in 2012: $65,466 (Individual Income Tax Returns)
Here:
$65,466
State:
$65,384
Salary/wage: $45,984 (reported on 85.3% of returns)
Here:
$45,984
State:
$52,524
(% of AGI for various income ranges: 79.7% for AGIs below $25k, 84.7% for AGIs $25k-50k, 82.3% for AGIs $50k-75k, 79.1% for AGIs $75k-100k, 66.4% for AGIs $100k-200k, 20.3% for AGIs over 200k)
Taxable interest for individuals: $1,531 (reported on 32.7% of returns)
This zip code:
$1,531
Texas:
$2,372
(% of AGI for various income ranges: 1.2% for AGIs below $25k, 0.3% for AGIs $25k-50k, 0.4% for AGIs $50k-75k, 0.6% for AGIs $75k-100k, 0.5% for AGIs $100k-200k, 1.3% for AGIs over 200k)
Ordinary dividends: $16,183 (reported on 11.5% of returns)
Here:
$16,183
State:
$9,721
(% of AGI for various income ranges: 2.3% for AGIs below $25k, 0.1% for AGIs $50k-75k, 0.3% for AGIs $75k-100k, 0.5% for AGIs $100k-200k, 8.3% for AGIs over 200k)
Net capital gain/loss in AGI: +$40,218 (reported on 10.9% of returns)
Here:
+$40,218
State:
+$35,319
(% of AGI for various income ranges: 0.2% for AGIs $25k-50k, 0.9% for AGIs $75k-100k, 2.4% for AGIs $100k-200k, 19.9% for AGIs over 200k)
Profit/loss from business: +$16,233 (reported on 21.2% of returns)
Here:
+$16,233
State:
+$13,732
(% of AGI for various income ranges: 11.2% for AGIs below $25k, 4.5% for AGIs $25k-50k, 5.0% for AGIs $50k-75k, 3.6% for AGIs $75k-100k, 5.7% for AGIs $100k-200k, 4.9% for AGIs over 200k)
Taxable individual retirement arrangement distribution: $12,036 (reported on 7.1% of returns)
79081:
$12,036
Texas:
$19,511
(% of AGI for various income ranges: 2.4% for AGIs below $25k, 3.2% for AGIs $25k-50k, 1.8% for AGIs $75k-100k, 2.3% for AGIs $100k-200k)
Total itemized deductions: $25,086 (15% of AGI, reported on 14.1% of returns)
Here:
$25,086
State:
$24,724
Here:
15.0% of AGI
State:
15.9% of AGI
(% of AGI for various income ranges: 5.3% for AGIs below $25k, 3.0% for AGIs $25k-50k, 4.4% for AGIs $50k-75k, 6.0% for AGIs $75k-100k, 7.7% for AGIs $100k-200k, 5.2% for AGIs over 200k)
Charity contributions: $12,506 (reported on 10.3% of returns)
Here:
$12,506
State:
$6,808
(% of AGI for various income ranges: 1.3% for AGIs $25k-50k, 1.2% for AGIs $75k-100k, 2.8% for AGIs $100k-200k, 3.4% for AGIs over 200k)
Taxes paid: $3,919 (reported on 13.5% of returns)
79081:
$3,919
State:
$6,921
(% of AGI for various income ranges: 1.4% for AGIs below $25k, 0.5% for AGIs $50k-75k, 0.7% for AGIs $75k-100k, 1.1% for AGIs $100k-200k, 1.1% for AGIs over 200k)
Earned income credit: $2,376 (reported on 16.0% of returns)
Here:
$2,376
State:
$2,570
(% of AGI for various income ranges: 6.7% for AGIs below $25k, 1.2% for AGIs $25k-50k)
Percentage of individuals using paid preparers for their 2012 taxes: 64.7%
Here:
65%
State:
51%
(% for various income ranges: 56.6% for AGIs below $25k, 67.6% for AGIs $25k-50k, 65.4% for AGIs $50k-75k, 64.7% for AGIs $75k-100k, 68.8% for AGIs $100k-200k, 100.0% for AGIs over 200k)
Averages for the 2004 tax year for zip code 79081, filed in 2005:
Average Adjusted Gross Income (AGI) in 2004: $35,570 (Individual Income Tax Returns)
Here:
$35,570
State:
$47,881
Salary/wage: $31,799 (reported on 79.7% of returns)
Here:
$31,799
State:
$41,947
(% of AGI for various income ranges: 75.6% for AGIs $10k-25k, 82.0% for AGIs $25k-50k, 72.4% for AGIs $50k-75k, 70.4% for AGIs $75k-100k, 38.2% for AGIs over 100k)
Taxable interest for individuals: $2,819 (reported on 43.6% of returns)
This zip code:
$2,819
Texas:
$2,255
(% of AGI for various income ranges: 3.2% for AGIs $10k-25k, 1.6% for AGIs $25k-50k, 2.5% for AGIs $50k-75k, 2.6% for AGIs $75k-100k, 5.4% for AGIs over 100k)
Taxable dividends: $2,320 (reported on 17.0% of returns)
Here:
$2,320
State:
$4,261
(% of AGI for various income ranges: 0.9% for AGIs $10k-25k, 0.3% for AGIs $25k-50k, 1.1% for AGIs $50k-75k, 0.6% for AGIs $75k-100k, 2.0% for AGIs over 100k)
Net capital gain/loss: +$6,178 (reported on 15.0% of returns)
Here:
+$6,178
State:
+$16,110
(% of AGI for various income ranges: -0.5% for AGIs $10k-25k, 0.3% for AGIs $25k-50k, 2.5% for AGIs $50k-75k, 0.7% for AGIs $75k-100k, 5.9% for AGIs over 100k)
Profit/loss from business: +$9,116 (reported on 21.4% of returns)
Here:
+$9,116
State:
+$11,013
(% of AGI for various income ranges: 4.4% for AGIs $10k-25k, 3.2% for AGIs $25k-50k, 2.8% for AGIs $50k-75k, 2.3% for AGIs $75k-100k, 10.3% for AGIs over 100k)
IRA payment deduction: $3,656 (reported on 2.3% of returns)
79081:
$3,656
Texas:
$3,120
Total itemized deductions: $17,480 (24% of AGI, reported on 14.1% of returns)
Here:
$17,480
State:
$19,631
Here:
23.9% of AGI
State:
18.9% of AGI
(% of AGI for various income ranges: 8.5% for AGIs $10k-25k, 5.7% for AGIs $25k-50k, 7.0% for AGIs $50k-75k, 5.5% for AGIs $75k-100k, 7.4% for AGIs over 100k)
Charity contributions deductions: $6,869 (9% of AGI, reported on 11.3% of returns)
Here:
$6,869
State:
$4,753
Here:
8.7% of AGI
State:
4.2% of AGI
(% of AGI for various income ranges: 1.3% for AGIs $10k-25k, 0.8% for AGIs $25k-50k, 1.8% for AGIs $50k-75k, 2.0% for AGIs $75k-100k, 4.2% for AGIs over 100k)
Total tax: $5,650 (reported on 68.5% of returns)
79081:
$5,650
State:
$9,058
(% of AGI for various income ranges: 3.7% for AGIs $10k-25k, 5.7% for AGIs $25k-50k, 8.9% for AGIs $50k-75k, 11.1% for AGIs $75k-100k, 19.5% for AGIs over 100k)
Earned income credit: $1,935 (reported on 19.5% of returns)
Here:
$1,935
State:
$2,024
Percentage of individuals using paid preparers for their 2004 taxes: 64.4%
Here:
64%
State:
57%
(% for various income ranges: 62.1% for AGIs below $10k, 60.8% for AGIs $10k-25k, 61.0% for AGIs $25k-50k, 66.1% for AGIs $50k-75k, 77.9% for AGIs $75k-100k, 87.7% for AGIs over 100k)
Household received Food Stamps/SNAP in the past 12 months: 83 Household did not receive Food Stamps/SNAP in the past 12 months: 1,137
Women who had a birth in the past 12 months: 4 (4 now married, 0 unmarried) Women who did not have a birth in the past 12 months: 610 (420 now married, 185 unmarried)
Housing units in zip code 79081 with a mortgage: 301 Median monthly owner costs for units with a mortgage: $1,545 Median monthly owner costs for units without a mortgage: $535
Residents with income below the poverty level in 2022:
This zip code:
9.2%
Whole state:
14.0%
Residents with income below 50% of the poverty level in 2022:
This zip code:
5.5%
Whole state:
7.4%
Median number of rooms in houses and condos:
Here:
6.1
State:
6.3
Median number of rooms in apartments:
Here:
4.5
State:
4.0
Notable locations in this zip code not listed on our city pages
Notable locations in zip code 79081: Hansford Camp (A), Stinnett Station (B), Spearman Golf Course (C), Spearman Fire Department (D), Stationmasters House Museum (E), Hansford and Spearman Emergency Medical Service (F). Display/hide their locations on the map
Churches in zip code 79081 include: Faith Lutheran Church (A), Catholic Church Sacred Heart (B), First Baptist Church Primera Mission Bautista (C), First Baptist Church (D), Fellowship Baptist Church (E). Display/hide their locations on the map
In group quarters: 76 (-1 institutionalized population)
Size of family households: 309 2-persons, 94 3-persons, 291 4-persons, 77 5-persons, 19 6-persons
Size of nonfamily households: 398 1-person, 15 2-persons, 11 3-persons
751 married couples with children.
109 single-parent households (10 men, 99 women).
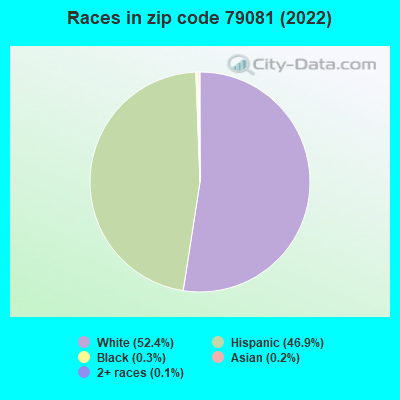
71.0% of residents of 79081 zip code speak English at home.
28.1% of residents speak Spanish at home (57% very well, 18% well, 25% not well).
Foreign born population: 501 (15.0%) (37.1% of them are naturalized citizens)
This zip code:
15.0%
Whole state:
17.2%
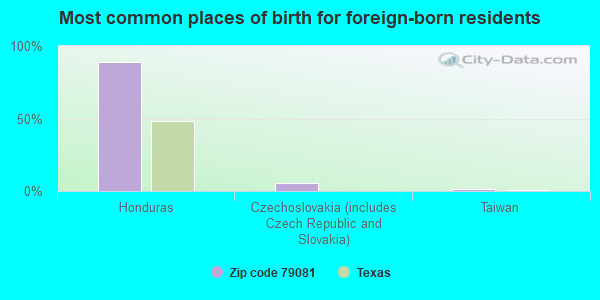
89%Honduras
5%Czechoslovakia (includes Czech Republic and Slovakia)
1%Taiwan
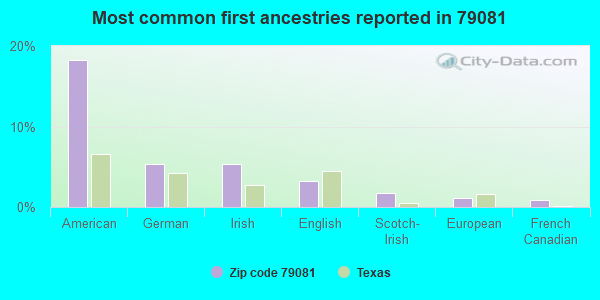
18%American
5%German
5%Irish
3%English
2%Scotch-Irish
1%European
1%French Canadian
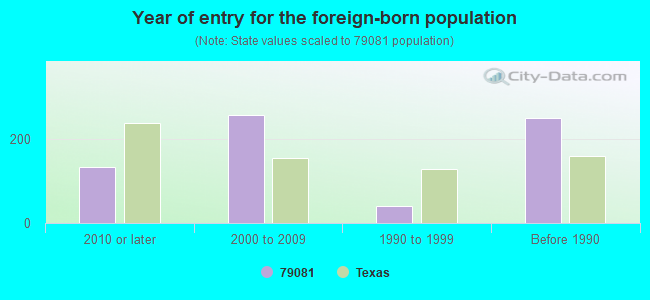
Year of entry for the foreign-born population
1332010 or later
2562000 to 2009
411990 to 1999
250Before 1990
Facilities with environmental interests located in this zip code:
AGCO OF SPEARMAN, INC. (9 M S OF SPEARMAN ON FM 760 in SPEARMAN, TX)
ENFORCEMENT/COMPLIANCE ACTIVITY (Integrated Compliance Information System) - ICIS-06-2002-0312, FORMAL ENFORCEMENT ACTION (Integrated Compliance Information System) - ICIS-06-2002-0312, FORMAL ENFORCEMENT ACTION Business SIC classification: CHEMICALS AND CHEMICAL PREPARATIONS
ATTEBURY GRAIN INCORPORATED BERNSTEIN (12 MILES N OF GRAVER TX ON HWY 207 in SPEARMAN, TX)
AIR MINOR (AIRS/AFS) (Integrated Compliance Information System) - ICIS-06-2002-3525, FORMAL ENFORCEMENT ACTION Business SIC classification: FLOUR AND OTHER GRAIN MILL PRODUCTS; GRAIN AND FIELD BEANS Alternative names: ATTEBURY GRAIN, INC., ATTEBURY GRAIN, INC.
Housing units lacking complete plumbing facilities: 14.4% Housing units lacking complete kitchen facilities: 9.6%
55.2%Utility gas
42.6%Electricity
2.2%Bottled, tank, or LP gas
Population in 1990: 3,626.
Place of birth for U.S.-born residents:
This state: 1,813
Northeast: 48
Midwest: 126
South: 322
West: 333
62% of the 79081 zip code residents lived in the same house 5 years ago. Out of people who lived in different houses, 48% lived in this county. Out of people who lived in different counties, 50% lived in Texas.
94% of the 79081 zip code residents lived in the same house 1 year ago. Out of people who lived in different houses, 20% moved from this county. Out of people who lived in different houses, 76% moved from different county within same state. Out of people who lived in different houses, 10% moved from different state.
Private vs. public school enrollment:
Students in private schools in grades 1 to 8 (elementary and middle school): 32
Here:
6.8%
Texas:
8.8%
Students in private schools in grades 9 to 12 (high school): 61
Here:
23.3%
Texas:
8.0%
Students in private undergraduate colleges: 20
Here:
17.2%
Texas:
16.2%
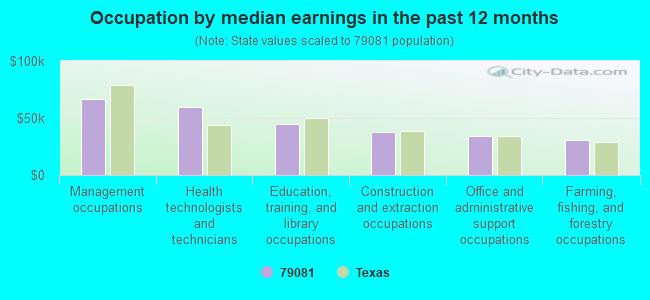
Occupation by median earnings in the past 12 months ($)
67,082Management occupations
59,588Health technologists and technicians
45,057Education, training, and library occupations
37,588Construction and extraction occupations
34,074Office and administrative support occupations
30,970Farming, fishing, and forestry occupations
Companies with federal contracts located in this zip code:
WATLEY ENTERPRISES, INC. (HWY 15 in SPEARMAN, TX; small business) 10 employees, $760000 revenue. : $0 in 2 contractsin 1999
$550,000 with Bureau of Land Management for Seeds and Nursery Stock. Signed on 1999-12-15. Completion date: 2000-01-15.
-$550,000, same as above.Signed on 1999-12-15. Completion date: 2000-01-15.
Top industries in this zip code by the number of employees in 2005:
Health Care and Social Assistance: General Medical and Surgical Hospitals (100-249 employees: 1 establishment)
Finance and Insurance: Commercial Banking (20-49: 2, 5-9: 1)
Wholesale Trade: Farm and Garden Machinery and Equipment Merchant Wholesalers (20-49: 1, 10-19: 1, 5-9: 1, 1-4: 1)
Accommodation and Food Services: Limited-Service Restaurants (20-49: 1, 5-9: 1)
Finance and Insurance: Insurance Agencies and Brokerages (5-9: 3, 1-4: 4)
Construction: Site Preparation Contractors (10-19: 1, 5-9: 1, 1-4: 1)
Mining: Support Activities for Oil and Gas Operations (10-19: 1, 5-9: 1, 1-4: 1)
People in group quarters in 2010:
57 people in nursing facilities/skilled-nursing facilities
3 people in local jails and other municipal confinement facilities
People in group quarters in 2000:
76 people in wards in general hospitals for patients who have no usual home elsewhere
9 people in other group homes
Fatal accident statistics in 2014:
Fatal accident count: 2
Vehicles involved in fatal accidents: 3
Fatal accidents caused by drunken drivers: 0
Fatalities: 3
Persons involved in fatal accidents: 4
Pedestrians involved in fatal accidents: 0
Fatal accident statistics in 2013:
Fatal accident count: 1
Vehicles involved in fatal accidents: 1
Fatal accidents caused by drunken drivers: 1
Fatalities: 1
Persons involved in fatal accidents: 1
Pedestrians involved in fatal accidents: 0
2002 - 2018 National Fire Incident Reporting System (NFIRS) incidents
According to the data from the years 2002 - 2018 the average number of fire incidents per year is 33. The highest number of reported fires - 62 took place in 2006, and the least - 8 in 2007. The data has a growing trend.
When looking into fire subcategories, the most reports belonged to: Outside Fires (69.1%), and Other (11.8%).
Fire incident types reported to NFIRS in Zip Code 79081


 Nearest zip codes: 79093, 79033, 79040, 73944, 79062, 79070.
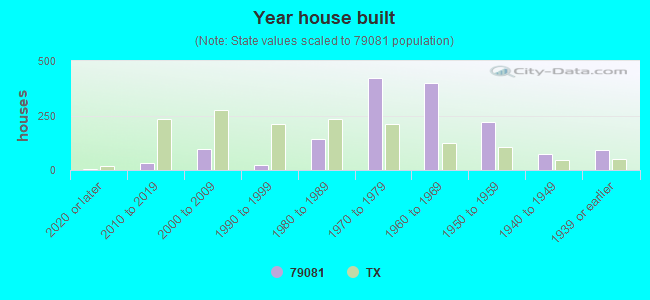


 According to the data from the years 2002 - 2018 the average number of fire incidents per year is 33. The highest number of reported fires - 62 took place in 2006, and the least - 8 in 2007. The data has a growing trend.
 When looking into fire subcategories, the most reports belonged to: Outside Fires (69.1%), and Other (11.8%).