Estimated zip code population in 2022: 3,236 Zip code population in 2010: 3,833 Zip code population in 2000: 4,639
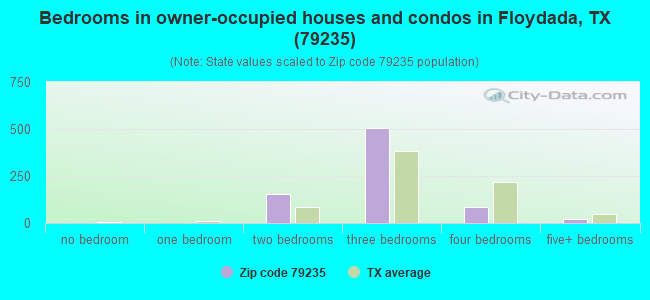
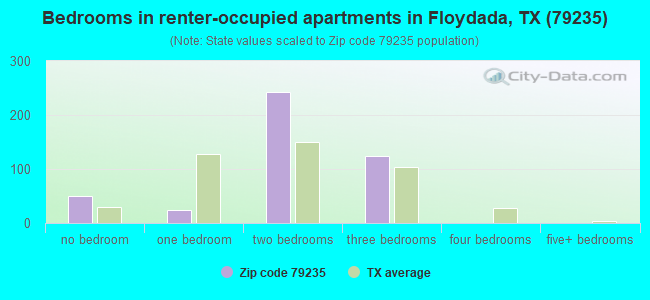
Houses and condos: 1,643 Renter-occupied apartments: 439
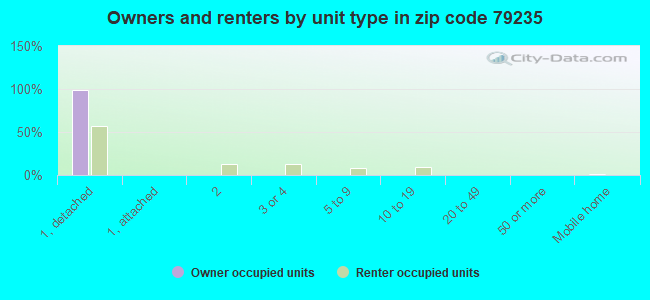
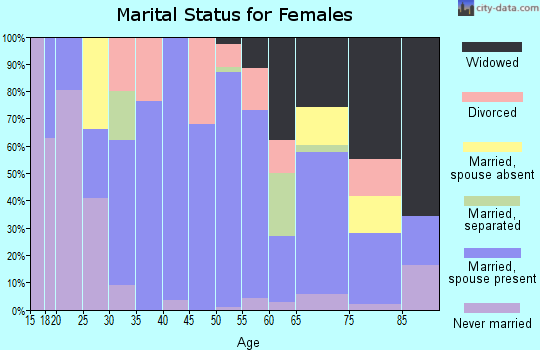
% of renters here:
36%
State:
38%
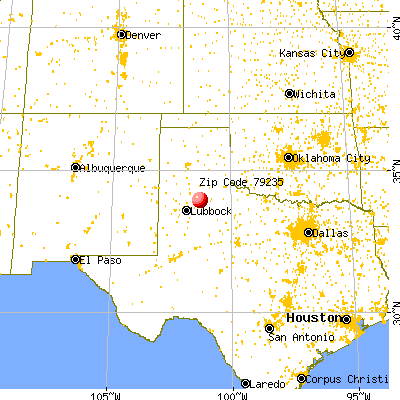
March 2022 cost of living index in zip code 79235: 74.7 (low, U.S. average is 100)
Land area: 576.1 sq. mi. Water area: 0.1 sq. mi.
Population density: 6 people per square mile
(very low).
OSM Map
General Map
Google Map
MSN Map
OSM Map
General Map
Google Map
MSN Map
OSM Map
General Map
Google Map
MSN Map
OSM Map
General Map
Google Map
MSN Map
Please wait while loading the map...
Real estate property taxes paid for housing units in 2022:
This zip code:
1.2% ($1,298)
Texas:
1.5% ($4,050)
Median real estate property taxes paid for housing units with mortgages in 2022: $1,996 (1.8%) Median real estate property taxes paid for housing units with no mortgage in 2022: $1,172 (1.2%)
Averages for the 2020 tax year for zip code 79235, filed in 2021:
Average Adjusted Gross Income (AGI) in 2020: $58,067 (Individual Income Tax Returns)
Here:
$58,067
State:
$77,054
Salary/wage: $38,334 (reported on 83.8% of returns)
Here:
$38,334
State:
$62,766
(% of AGI for various income ranges: 1215.6% for AGIs below $25k, 3869.7% for AGIs $25k-50k, 6718.6% for AGIs $50k-75k, 12604.0% for AGIs $75k-100k, 16895.0% for AGIs $100k-200k)
Taxable interest for individuals: $1,917 (reported on 28.9% of returns)
This zip code:
$1,917
Texas:
$2,665
(% of AGI for various income ranges: 5.9% for AGIs below $25k, 32.2% for AGIs $25k-50k, 60.7% for AGIs $50k-75k, 98.0% for AGIs $75k-100k, 168.3% for AGIs $100k-200k)
Ordinary dividends: $5,747 (reported on 10.6% of returns)
Here:
$5,747
State:
$10,044
(% of AGI for various income ranges: 25.6% for AGIs $25k-50k, 85.0% for AGIs $50k-75k, 383.3% for AGIs $100k-200k)
Net capital gain/loss in AGI: +$18,641 (reported on 12.0% of returns)
Here:
+$18,641
State:
+$39,590
(% of AGI for various income ranges: 12.2% for AGIs $25k-50k, 110.0% for AGIs $50k-75k, 1076.7% for AGIs $100k-200k)
Profit/loss from business: +$5,041 (reported on 15.5% of returns)
Here:
+$5,041
State:
+$10,888
(% of AGI for various income ranges: 59.3% for AGIs below $25k, 32.5% for AGIs $25k-50k, 52.9% for AGIs $50k-75k, 142.0% for AGIs $75k-100k, 1028.3% for AGIs $100k-200k)
Taxable individual retirement arrangement distribution: $12,660 (reported on 7.0% of returns)
79235:
$12,660
Texas:
$24,740
(% of AGI for various income ranges: 119.7% for AGIs $25k-50k, 287.1% for AGIs $50k-75k, 801.7% for AGIs $100k-200k)
Total itemized deductions: $39,700 (reported on 3.5% of returns)
Here:
$39,700
State:
$40,428
(% of AGI for various income ranges: 202.2% for AGIs $25k-50k, 2230.0% for AGIs $100k-200k)
Charity contributions: $22,375 (reported on 2.8% of returns)
Here:
$22,375
State:
$18,201
(% of AGI for various income ranges: 1491.7% for AGIs $100k-200k)
Taxes paid: $4,240 (reported on 3.5% of returns)
79235:
$4,240
State:
$7,821
(% of AGI for various income ranges: 16.2% for AGIs $25k-50k, 266.7% for AGIs $100k-200k)
Earned income credit: $2,858 (reported on 28.2% of returns)
Here:
$2,858
State:
$2,584
(% of AGI for various income ranges: 176.1% for AGIs below $25k, 131.6% for AGIs $25k-50k)
Percentage of individuals using paid preparers for their 2020 taxes: 94.4%
Here:
94%
State:
92%
(% for various income ranges: 92.2% for AGIs below $25k, 95.2% for AGIs $25k-50k, 95.0% for AGIs $50k-75k, 100.0% for AGIs $75k-100k, 92.9% for AGIs $100k-200k, 100.0% for AGIs over 200k)
Averages for the 2012 tax year for zip code 79235, filed in 2013:
Average Adjusted Gross Income (AGI) in 2012: $45,951 (Individual Income Tax Returns)
Here:
$45,951
State:
$65,384
Salary/wage: $31,973 (reported on 83.4% of returns)
Here:
$31,973
State:
$52,524
(% of AGI for various income ranges: 82.4% for AGIs below $25k, 84.0% for AGIs $25k-50k, 70.0% for AGIs $50k-75k, 56.3% for AGIs $75k-100k, 39.6% for AGIs $100k-200k, 18.4% for AGIs over 200k)
Taxable interest for individuals: $1,293 (reported on 30.5% of returns)
This zip code:
$1,293
Texas:
$2,372
(% of AGI for various income ranges: 1.0% for AGIs below $25k, 0.4% for AGIs $25k-50k, 0.9% for AGIs $50k-75k, 0.5% for AGIs $75k-100k, 0.9% for AGIs $100k-200k, 1.4% for AGIs over 200k)
Ordinary dividends: $2,159 (reported on 11.3% of returns)
Here:
$2,159
State:
$9,721
(% of AGI for various income ranges: 0.3% for AGIs below $25k, 0.2% for AGIs $25k-50k, 1.0% for AGIs $50k-75k, 0.7% for AGIs $100k-200k, 0.7% for AGIs over 200k)
Net capital gain/loss in AGI: +$5,369 (reported on 10.6% of returns)
Here:
+$5,369
State:
+$35,319
(% of AGI for various income ranges: 1.2% for AGIs $50k-75k, 4.8% for AGIs $100k-200k)
Profit/loss from business: +$10,358 (reported on 15.9% of returns)
Here:
+$10,358
State:
+$13,732
(% of AGI for various income ranges: 4.7% for AGIs below $25k, 1.2% for AGIs $25k-50k, 2.5% for AGIs $50k-75k, 5.0% for AGIs $75k-100k, 8.1% for AGIs $100k-200k)
Taxable individual retirement arrangement distribution: $8,254 (reported on 8.6% of returns)
79235:
$8,254
Texas:
$19,511
(% of AGI for various income ranges: 2.1% for AGIs below $25k, 0.9% for AGIs $25k-50k, 1.5% for AGIs $50k-75k, 4.3% for AGIs $75k-100k, 1.6% for AGIs $100k-200k)
Total itemized deductions: $22,800 (22% of AGI, reported on 10.6% of returns)
Here:
$22,800
State:
$24,724
Here:
22.1% of AGI
State:
15.9% of AGI
(% of AGI for various income ranges: 5.3% for AGIs $25k-50k, 4.8% for AGIs $50k-75k, 6.6% for AGIs $75k-100k, 11.7% for AGIs $100k-200k)
Charity contributions: $10,715 (reported on 8.6% of returns)
Here:
$10,715
State:
$6,808
(% of AGI for various income ranges: 1.0% for AGIs $25k-50k, 1.8% for AGIs $50k-75k, 6.7% for AGIs $100k-200k)
Taxes paid: $3,560 (reported on 9.9% of returns)
79235:
$3,560
State:
$6,921
(% of AGI for various income ranges: 0.6% for AGIs $25k-50k, 0.7% for AGIs $50k-75k, 0.9% for AGIs $75k-100k, 1.9% for AGIs $100k-200k)
Earned income credit: $2,738 (reported on 29.8% of returns)
Here:
$2,738
State:
$2,570
(% of AGI for various income ranges: 10.6% for AGIs below $25k, 2.4% for AGIs $25k-50k)
Percentage of individuals using paid preparers for their 2012 taxes: 72.2%
Here:
72%
State:
51%
(% for various income ranges: 64.1% for AGIs below $25k, 69.8% for AGIs $25k-50k, 80.0% for AGIs $50k-75k, 88.9% for AGIs $75k-100k, 90.9% for AGIs $100k-200k, 100.0% for AGIs over 200k)
Averages for the 2004 tax year for zip code 79235, filed in 2005:
Average Adjusted Gross Income (AGI) in 2004: $30,047 (Individual Income Tax Returns)
Here:
$30,047
State:
$47,881
Salary/wage: $23,844 (reported on 82.2% of returns)
Here:
$23,844
State:
$41,947
(% of AGI for various income ranges: 175.6% for AGIs below $10k, 79.6% for AGIs $10k-25k, 77.3% for AGIs $25k-50k, 68.6% for AGIs $50k-75k, 53.7% for AGIs $75k-100k, 28.3% for AGIs over 100k)
Taxable interest for individuals: $2,386 (reported on 33.7% of returns)
This zip code:
$2,386
Texas:
$2,255
(% of AGI for various income ranges: 8.5% for AGIs below $10k, 2.1% for AGIs $10k-25k, 1.9% for AGIs $25k-50k, 1.7% for AGIs $50k-75k, 2.9% for AGIs $75k-100k, 4.5% for AGIs over 100k)
Taxable dividends: $2,271 (reported on 13.0% of returns)
Here:
$2,271
State:
$4,261
(% of AGI for various income ranges: 3.3% for AGIs below $10k, 0.4% for AGIs $10k-25k, 0.6% for AGIs $25k-50k, 1.1% for AGIs $50k-75k, 1.8% for AGIs $75k-100k, 1.2% for AGIs over 100k)
Net capital gain/loss: +$773 (reported on 11.4% of returns)
Here:
+$773
State:
+$16,110
(% of AGI for various income ranges: -2.3% for AGIs below $10k, -0.2% for AGIs $10k-25k, 0.0% for AGIs $25k-50k, 0.4% for AGIs $50k-75k, -0.3% for AGIs $75k-100k, 1.6% for AGIs over 100k)
Profit/loss from business: +$9,489 (reported on 15.4% of returns)
Here:
+$9,489
State:
+$11,013
(% of AGI for various income ranges: 17.3% for AGIs below $10k, 4.1% for AGIs $10k-25k, 4.2% for AGIs $25k-50k, 2.4% for AGIs $50k-75k, 5.4% for AGIs $75k-100k, 7.3% for AGIs over 100k)
Profit/loss from farming: +$14,628 (reported on 11.2% of returns)
Here:
+$14,628
State:
-$9,403
(% of AGI for various income ranges: -50.4% for AGIs below $10k, -0.8% for AGIs $10k-25k, 1.5% for AGIs $25k-50k, 3.0% for AGIs $50k-75k, 9.7% for AGIs $75k-100k, 22.2% for AGIs over 100k)
IRA payment deduction: $3,677 (reported on 3.8% of returns)
79235:
$3,677
Texas:
$3,120
(% of AGI for various income ranges: 0.4% for AGIs $25k-50k, 0.4% for AGIs $50k-75k, 1.0% for AGIs $75k-100k, 0.8% for AGIs over 100k)
Total itemized deductions: $17,500 (27% of AGI, reported on 10.0% of returns)
Here:
$17,500
State:
$19,631
Here:
27.0% of AGI
State:
18.9% of AGI
(% of AGI for various income ranges: 16.0% for AGIs below $10k, 4.1% for AGIs $10k-25k, 5.3% for AGIs $25k-50k, 5.1% for AGIs $50k-75k, 6.4% for AGIs $75k-100k, 7.5% for AGIs over 100k)
Charity contributions deductions: $8,121 (12% of AGI, reported on 8.2% of returns)
Here:
$8,121
State:
$4,753
Here:
11.8% of AGI
State:
4.2% of AGI
(% of AGI for various income ranges: 1.9% for AGIs below $10k, 0.5% for AGIs $10k-25k, 1.3% for AGIs $25k-50k, 1.4% for AGIs $50k-75k, 3.0% for AGIs $75k-100k, 5.3% for AGIs over 100k)
Total tax: $4,832 (reported on 61.1% of returns)
79235:
$4,832
State:
$9,058
(% of AGI for various income ranges: 5.5% for AGIs below $10k, 3.0% for AGIs $10k-25k, 5.9% for AGIs $25k-50k, 9.6% for AGIs $50k-75k, 13.3% for AGIs $75k-100k, 19.9% for AGIs over 100k)
Earned income credit: $2,162 (reported on 33.2% of returns)
Here:
$2,162
State:
$2,024
Percentage of individuals using paid preparers for their 2004 taxes: 75.0%
Here:
75%
State:
57%
(% for various income ranges: 74.1% for AGIs below $10k, 75.8% for AGIs $10k-25k, 72.7% for AGIs $25k-50k, 72.6% for AGIs $50k-75k, 77.1% for AGIs $75k-100k, 91.0% for AGIs over 100k)
Household received Food Stamps/SNAP in the past 12 months: 338 Household did not receive Food Stamps/SNAP in the past 12 months: 876
Women who had a birth in the past 12 months: 87 (7 now married, 77 unmarried) Women who did not have a birth in the past 12 months: 640 (326 now married, 312 unmarried)
Housing units in zip code 79235 with a mortgage: 242 Median monthly owner costs for units with a mortgage: $1,094 Median monthly owner costs for units without a mortgage: $455
Residents with income below the poverty level in 2022:
This zip code:
21.1%
Whole state:
14.0%
Residents with income below 50% of the poverty level in 2022:
This zip code:
11.8%
Whole state:
7.4%
Median number of rooms in houses and condos:
Here:
6.0
State:
6.3
Median number of rooms in apartments:
Here:
4.4
State:
4.0
Notable locations in this zip code not listed on our city pages
Notable locations in zip code 79235: Cedar Hill Cotton Gin (A), Chimney Windmill (B), Harmony Community Center (C), Montgomery Ranch (D), Mott Camp (E), South Windmill (F), West Windmill (G), Floydada Country Club (H), Boggy Windmill (I), Bois d'Arc Windmill (J), Floyd County Courthouse (K), Floydada City Fire Department (L), Floyd County Historical Museum (M), Floydada Emergency Medical Services (N). Display/hide their locations on the map
Churches in zip code 79235 include: Church of Christ - City Park (A), Mount Zion Baptist Church (B), First Baptist Church (C), Bible Baptist Church (D), Bethany Baptist Mission Church (E), Pansy Church (F), Carrs Chapel (G). Display/hide their locations on the map
Parks in zip code 79235 include: Annie M Taylor Park (1), Eagles Hall Park (2), Napoleon Park (3), Floydada Park (4), County Memorial Park (5). Display/hide their locations on the map
Size of family households: 340 2-persons, 243 3-persons, 127 4-persons, 80 5-persons, 42 6-persons, 19 7-or-more-persons
Size of nonfamily households: 328 1-person, 22 2-persons
577 married couples with children.
362 single-parent households (16 men, 346 women).
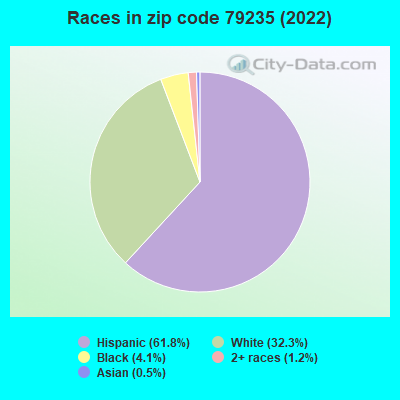
56.2% of residents of 79235 zip code speak English at home.
42.1% of residents speak Spanish at home (67% very well, 14% well, 11% not well, 8% not at all).
0.8% of residents speak other Indo-European language at home (100% very well).
0.6% of residents speak Asian or Pacific Island language at home (100% very well).
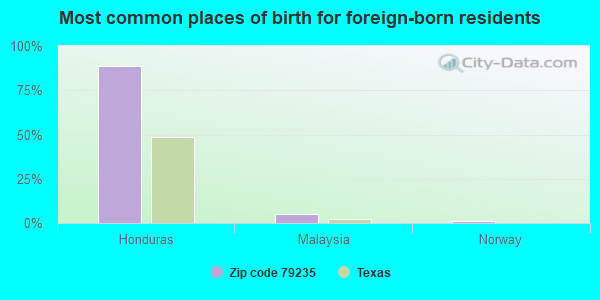
Foreign born population: 296 (9.1%) (12.3% of them are naturalized citizens)
This zip code:
9.1%
Whole state:
17.2%
89%Honduras
5%Malaysia
1%Norway
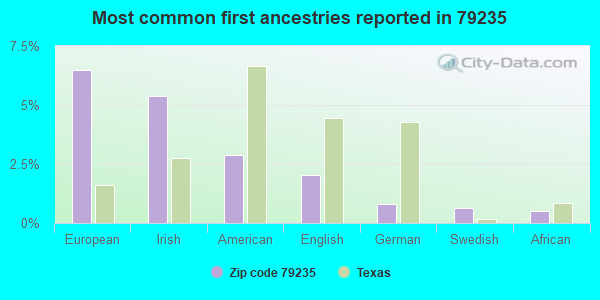
6%European
5%Irish
3%American
2%English
1%German
1%Swedish
1%African
Year of entry for the foreign-born population
1542010 or later
962000 to 2009
601990 to 1999
63Before 1990
Facilities with environmental interests located in this zip code:
A B DUNCAN ELEMENTARY SCHOOL (1011 SOUTH EIGHTH in FLOYDADA, TX)
(Geographic Names Information System) (National Center for Education Statistics) - STATE ID-077901101 Organizations: FLOYDADA ISD (SCHOOL DISTRICT)
Housing units lacking complete plumbing facilities: 7.3% Housing units lacking complete kitchen facilities: 14.8%
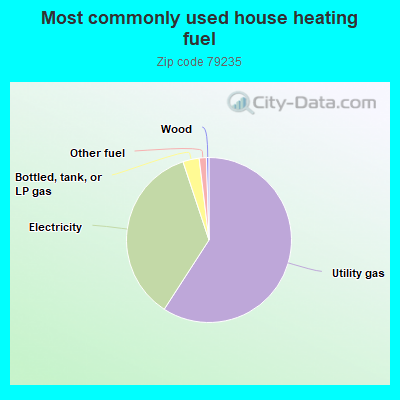
59.2%Utility gas
35.8%Electricity
3.2%Bottled, tank, or LP gas
1.4%Other fuel
0.5%Wood
Population in 1990: 5,075.
Place of birth for U.S.-born residents:
This state: 2,558
Northeast: 19
Midwest: 16
South: 128
West: 123
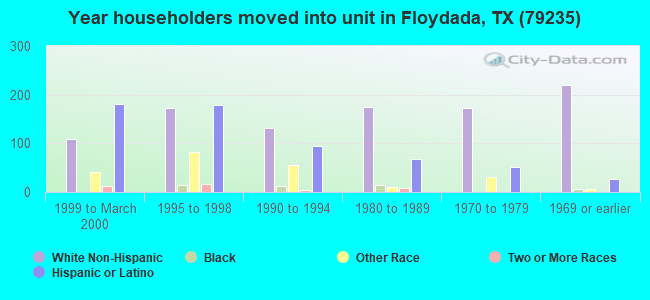
63% of the 79235 zip code residents lived in the same house 5 years ago. Out of people who lived in different houses, 64% lived in this county. Out of people who lived in different counties, 50% lived in Texas.
93% of the 79235 zip code residents lived in the same house 1 year ago. Out of people who lived in different houses, 22% moved from this county. Out of people who lived in different houses, 82% moved from different county within same state.
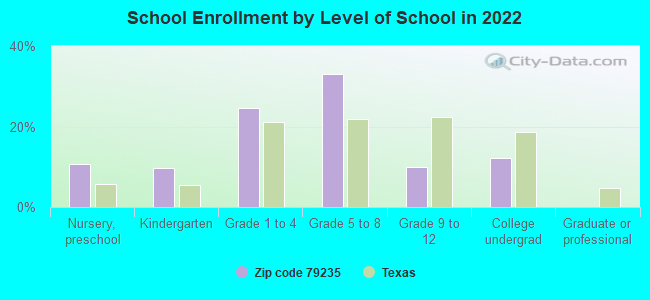
Private vs. public school enrollment:
Students in private schools in grades 1 to 8 (elementary and middle school): 122
Here:
23.8%
Texas:
8.8%
Students in private schools in grades 9 to 12 (high school): 23
Here:
26.6%
Texas:
8.0%
Students in private undergraduate colleges: 5
Here:
5.4%
Texas:
16.2%
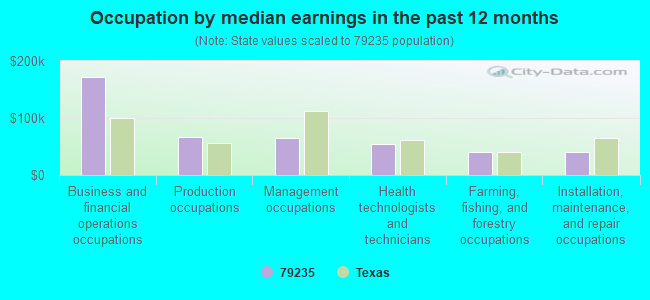
Occupation by median earnings in the past 12 months ($)
171,224Business and financial operations occupations
66,166Production occupations
64,325Management occupations
54,589Health technologists and technicians
40,653Farming, fishing, and forestry occupations
39,852Installation, maintenance, and repair occupations
Top industries in this zip code by the number of employees in 2005:
Utilities: Electric Power Distribution (20-49 employees: 1 establishment, 1-4 employees: 1 establishment)
Wholesale Trade: Grain and Field Bean Merchant Wholesalers (20-49: 1, 1-4: 1)
Wholesale Trade: Wholesale Trade Agents and Brokers (20-49: 1)
Health Care and Social Assistance: Nursing Care Facilities (20-49: 1)
Wholesale Trade: Farm and Garden Machinery and Equipment Merchant Wholesalers (10-19: 1, 5-9: 2)
Other Services (except Public Administration): Religious Organizations (10-19: 1, 5-9: 1, 1-4: 2)
Health Care and Social Assistance: Child Day Care Services (10-19: 1, 5-9: 1, 1-4: 1)
People in group quarters in 2000:
88 people in nursing homes
11 people in local jails and other confinement facilities (including police lockups)
Fatal accident statistics in 2014:
Fatal accident count: 1
Vehicles involved in fatal accidents: 3
Fatal accidents caused by drunken drivers: 0
Fatalities: 2
Persons involved in fatal accidents: 4
Pedestrians involved in fatal accidents: 0
Fatal accident statistics in 2011:
Fatal accident count: 1
Vehicles involved in fatal accidents: 3
Fatal accidents caused by drunken drivers: 0
Fatalities: 1
Persons involved in fatal accidents: 3
Pedestrians involved in fatal accidents: 0
2002 - 2016 National Fire Incident Reporting System (NFIRS) incidents
Based on the data from the years 2002 - 2016 the average number of fire incidents per year is 38. The highest number of reported fire incidents - 68 took place in 2011, and the least - 3 in 2015. The data has a growing trend.
When looking into fire subcategories, the most incidents belonged to: Outside Fires (70.5%), and Structure Fires (13.6%).
Fire incident types reported to NFIRS in Zip Code 79235


+$14,628
-$9,403
(% of AGI for various income ranges: -50.4% for AGIs below $10k, -0.8% for AGIs $10k-25k, 1.5% for AGIs $25k-50k, 3.0% for AGIs $50k-75k, 9.7% for AGIs $75k-100k, 22.2% for AGIs over 100k) Nearest zip codes: 79231, 79241, 79258, 79243, 79322, 79250.


 Based on the data from the years 2002 - 2016 the average number of fire incidents per year is 38. The highest number of reported fire incidents - 68 took place in 2011, and the least - 3 in 2015. The data has a growing trend.
 When looking into fire subcategories, the most incidents belonged to: Outside Fires (70.5%), and Structure Fires (13.6%).