Estimated zip code population in 2022: 4
Zip code population in 2010: 61
Zip code population in 2000: 86
March 2022 cost of living index in zip code 79324: 78.7
(low, U.S. average is 100)
Land area: 70.9
sq. mi.
Water area: 0.0
sq. mi.
| Population density: 0.056 people per square mile | | (very low). |
![Age and Sex of Residents in zip code 79324]()
- OSM Map
- General Map
- Google Map
- MSN Map
- OSM Map
- General Map
- Google Map
- MSN Map
- OSM Map
- General Map
- Google Map
- MSN Map
- OSM Map
- General Map
- Google Map
- MSN Map
Please wait while loading the map...
Business Search - 14 Million verified businesses
| Males: 0 |  (0.0%) (0.0%) |
| Females: 4 |  (100.0%) (100.0%) |
For population 25 years and over in 79324:
- High school or higher: 98.1%
- Bachelor's degree or higher: 0.0%
- Graduate or professional degree: 0.0%
For population 15 years and over in 79324:
- Never married: 0.0%
- Now married: 0.0%
- Separated: 0.0%
- Widowed: 100.0%
- Divorced: 0.0%
Zip code 79324 compared to state average:
- Median household income significantly below state average.
- Median house value significantly below state average.
- Black race population percentage significantly below state average.
- Hispanic race population percentage significantly below state average.
- Median age significantly below state average.
- Foreign-born population percentage significantly below state average.
- Renting percentage significantly below state average.
- Length of stay since moving in significantly above state average.
- House age above state average.
- Number of college students significantly below state average.
- Percentage of population with a bachelor's degree or higher significantly below state average.
Data:
100%
rural population.
Averages for the 2004 tax year for zip code 79324, filed in 2005:
Average Adjusted Gross Income (AGI) in 2004: $19,690 (Individual Income Tax Returns)
| Here: | $19,690 |
| State: | $47,881 |
Salary/wage: $18,000 (reported on 79.3% of returns)
| Here: | $18,000 |
| State: | $41,947 |
Total tax: $1,308 (reported on 44.8% of returns)
Earned income credit: $1,900 (reported on 34.5% of returns)
Percentage of individuals using paid preparers for their 2004 taxes: 82.8%
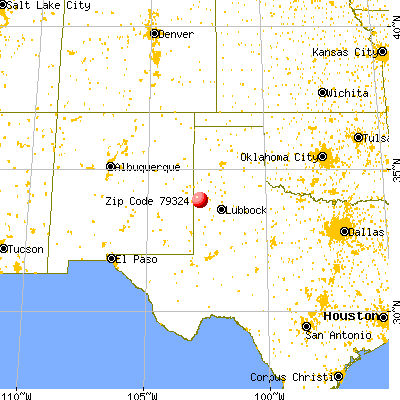
![79324 map]() Nearest zip codes: 79353
Nearest zip codes: 79353,
79344,
79346,
79371,
79312,
79347.
Percentage of family households:| This zip code: | 0.0% |
| Texas: | 50.5% |
Percentage of households with unmarried partners:| This zip code: | 0.0% |
| Texas: | 48.7% |
No gay or lesbian households reported
Household received Food Stamps/SNAP in the past 12 months: 0
Household did not receive Food Stamps/SNAP in the past 12 months: 4

- Year house built (houses)
- 02020 or later
- 02010 to 2019
- 02000 to 2009
- 01990 to 1999
- 01980 to 1989
- 91970 to 1979
- 41960 to 1969
- 41950 to 1959
- 01940 to 1949
- 01939 or earlier
![Zip code 79324 satellite photo by USGS]()
- Bedrooms in owner-occupied houses and condos in 79324
- 0no bedroom
- 01 bedroom
- 02 bedrooms
- 43 bedrooms
- 04 bedrooms
- 05+ bedrooms
- Cars and other vehicles available in 79324 in owner-occupied houses/condos
- 0no vehicle
- 41 vehicle
- 02 vehicles
- 03 vehicles
- 04 vehicles
- 05+ vehicles
Estimated median house (or condo) value in 2022 for:
- White Non-Hispanic householders: $275,400
- Some other race householders: $144,642
- Hispanic or Latino householders: $144,642
Mean price in 2022:
Detached houses: $1,183,797| Here: | $1,183,797 |
| State: | $369,058 |
Housing units in structures:
Household type by relationship:
Households: 4
- Male householders: 0 (0 living alone), Female householders: 4 (4 living alone)
0 spouses (0 opposite-sex spouses), 0 unmarried partners, (0 opposite-sex unmarried partners), 0 children (0 natural, 0 adopted, 0 stepchildren), 0 grandchildren, 0 brothers or sisters, 0 parents, 0 foster children, 0 other relatives, 0 non-relatives
Size of nonfamily households: 4 1-person
All residents speak English at home
Foreign born population: 0 (0.0%)
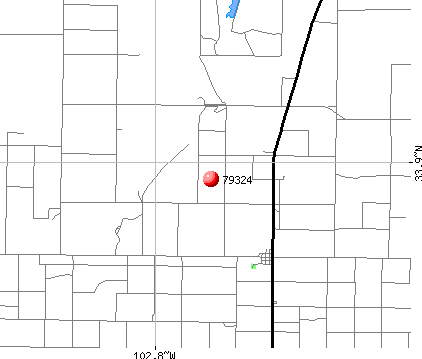
![Zip code 79324 topographic map]()
Population in 1990: 53. Population change in the 1990s: +33 (+62.3%).
Place of birth for U.S.-born residents:
57% of the 79324 zip code residents lived in the same house 5 years ago.
Out of people who lived in different houses, 19% lived in this county.
100% of the 79324 zip code residents lived in the same house 1 year ago.
Fatal accident statistics in 2013:
- Fatal accident count: 1
- Vehicles involved in fatal accidents: 1
- Fatal accidents caused by drunken drivers: 1
- Fatalities: 1
- Persons involved in fatal accidents: 2
- Pedestrians involved in fatal accidents: 0
 100% rural population.


 Nearest zip codes: 79353, 79344, 79346, 79371, 79312, 79347.


