Estimated zip code population in 2022: 2,437 Zip code population in 2010: 2,319 Zip code population in 2000: 2,303
Houses and condos: 928 Renter-occupied apartments: 263
% of renters here:
34%
State:
38%
March 2022 cost of living index in zip code 79325: 79.1 (low, U.S. average is 100)
Land area: 178.3 sq. mi. Water area: 0.8 sq. mi.
Population density: 14 people per square mile
(very low).
OSM Map
General Map
Google Map
MSN Map
OSM Map
General Map
Google Map
MSN Map
OSM Map
General Map
Google Map
MSN Map
OSM Map
General Map
Google Map
MSN Map
Please wait while loading the map...
Real estate property taxes paid for housing units in 2022:
This zip code:
1.3% ($2,166)
Texas:
1.5% ($4,050)
Median real estate property taxes paid for housing units with mortgages in 2022: $2,723 (1.4%) Median real estate property taxes paid for housing units with no mortgage in 2022: $1,706 (1.4%)
Business Search- 14 Million verified businesses
Males: 1,110
(45.5%)
Females: 1,327
(54.5%)
For population 25 years and over in 79325:
High school or higher: 81.4%
Bachelor's degree or higher: 22.6%
Graduate or professional degree: 4.4%
Unemployed: 1.3%
Mean travel time to work (commute): 18.6 minutes
For population 15 years and over in 79325:
Never married: 20.5%
Now married: 63.6%
Separated: 0.7%
Widowed: 6.6%
Divorced: 8.6%
Zip code 79325 compared to state average:
Median house value below state average.
Unemployed percentage significantly below state average.
Black race population percentage significantly below state average.
Length of stay since moving in significantly above state average.
House age above state average.
Number of college students below state average.
Percentage of population with a bachelor's degree or higher below state average.
Estimated median house/condo value in 2022: $167,439
79325:
$167,439
Texas:
$275,400
According to our research of Texas and other state lists, there were 5 registered sex offenders living in 79325 zip code as of May 28, 2024. The ratio of all residents to sex offenders in zip code 79325 is 500 to 1. The ratio of registered sex offenders to all residents in this zip code is near the state average.
Median resident age:
This zip code:
31.9 years
Texas median age:
35.6 years
Average household size:
This zip code:
3.1 people
Texas:
2.6 people
Averages for the 2020 tax year for zip code 79325, filed in 2021:
Average Adjusted Gross Income (AGI) in 2020: $68,016 (Individual Income Tax Returns)
Here:
$68,016
State:
$77,054
Salary/wage: $50,055 (reported on 85.2% of returns)
Here:
$50,055
State:
$62,766
(% of AGI for various income ranges: 1568.3% for AGIs below $25k, 4400.0% for AGIs $25k-50k, 6799.0% for AGIs $50k-75k, 9136.7% for AGIs $75k-100k, 15406.7% for AGIs $100k-200k)
Taxable interest for individuals: $1,735 (reported on 26.1% of returns)
This zip code:
$1,735
Texas:
$2,665
(% of AGI for various income ranges: 21.7% for AGIs below $25k, 35.9% for AGIs $25k-50k, 77.0% for AGIs $50k-75k, 71.7% for AGIs $75k-100k, 120.0% for AGIs $100k-200k)
Ordinary dividends: $3,592 (reported on 13.6% of returns)
Here:
$3,592
State:
$10,044
(% of AGI for various income ranges: 16.1% for AGIs below $25k, 68.0% for AGIs $50k-75k, 113.3% for AGIs $75k-100k, 443.3% for AGIs $100k-200k)
Net capital gain/loss in AGI: +$13,457 (reported on 15.9% of returns)
Here:
+$13,457
State:
+$39,590
(% of AGI for various income ranges: 35.3% for AGIs $25k-50k, 323.3% for AGIs $75k-100k, 743.3% for AGIs $100k-200k)
Profit/loss from business: +$7,679 (reported on 15.9% of returns)
Here:
+$7,679
State:
+$10,888
(% of AGI for various income ranges: 110.0% for AGIs below $25k, 202.4% for AGIs $25k-50k, 352.0% for AGIs $50k-75k, 301.7% for AGIs $100k-200k)
Taxable individual retirement arrangement distribution: $17,940 (reported on 5.7% of returns)
79325:
$17,940
Texas:
$24,740
(% of AGI for various income ranges: 897.0% for AGIs $50k-75k)
Total itemized deductions: $36,175 (reported on 4.5% of returns)
Here:
$36,175
State:
$40,428
(% of AGI for various income ranges: 397.6% for AGIs $25k-50k)
Charity contributions: $16,333 (reported on 3.4% of returns)
Here:
$16,333
State:
$18,201
(% of AGI for various income ranges: 816.7% for AGIs $100k-200k)
Taxes paid: $5,400 (reported on 4.5% of returns)
79325:
$5,400
State:
$7,821
(% of AGI for various income ranges: 45.6% for AGIs below $25k)
Earned income credit: $2,567 (reported on 17.0% of returns)
Here:
$2,567
State:
$2,584
(% of AGI for various income ranges: 117.2% for AGIs below $25k, 102.4% for AGIs $25k-50k)
Percentage of individuals using paid preparers for their 2020 taxes: 90.9%
Here:
91%
State:
92%
(% for various income ranges: 92.3% for AGIs below $25k, 87.5% for AGIs $25k-50k, 86.7% for AGIs $50k-75k, 88.9% for AGIs $75k-100k, 100.0% for AGIs $100k-200k, 100.0% for AGIs over 200k)
Averages for the 2012 tax year for zip code 79325, filed in 2013:
Average Adjusted Gross Income (AGI) in 2012: $50,544 (Individual Income Tax Returns)
Here:
$50,544
State:
$65,384
Salary/wage: $39,249 (reported on 83.3% of returns)
Here:
$39,249
State:
$52,524
(% of AGI for various income ranges: 78.6% for AGIs below $25k, 83.9% for AGIs $25k-50k, 74.9% for AGIs $50k-75k, 75.5% for AGIs $75k-100k, 87.5% for AGIs $100k-200k)
Taxable interest for individuals: $1,721 (reported on 26.7% of returns)
This zip code:
$1,721
Texas:
$2,372
(% of AGI for various income ranges: 1.6% for AGIs below $25k, 0.5% for AGIs $25k-50k, 0.8% for AGIs $50k-75k, 0.3% for AGIs $75k-100k, 2.6% for AGIs $100k-200k)
Ordinary dividends: $3,392 (reported on 14.4% of returns)
Here:
$3,392
State:
$9,721
(% of AGI for various income ranges: 0.8% for AGIs below $25k, 0.5% for AGIs $25k-50k, 0.9% for AGIs $50k-75k, 3.5% for AGIs $100k-200k)
Net capital gain/loss in AGI: +$16,425 (reported on 13.3% of returns)
Here:
+$16,425
State:
+$35,319
(% of AGI for various income ranges: 0.2% for AGIs below $25k, 0.9% for AGIs $50k-75k, 22.9% for AGIs $100k-200k)
Profit/loss from business: +$8,269 (reported on 14.4% of returns)
Here:
+$8,269
State:
+$13,732
(% of AGI for various income ranges: 4.3% for AGIs below $25k, 5.3% for AGIs $25k-50k, 2.7% for AGIs $50k-75k, 1.9% for AGIs $100k-200k)
Taxable individual retirement arrangement distribution: $8,350 (reported on 6.7% of returns)
79325:
$8,350
Texas:
$19,511
Total itemized deductions: $19,529 (19% of AGI, reported on 18.9% of returns)
Here:
$19,529
State:
$24,724
Here:
19.3% of AGI
State:
15.9% of AGI
(% of AGI for various income ranges: 6.5% for AGIs $25k-50k, 7.4% for AGIs $50k-75k, 9.4% for AGIs $75k-100k, 18.2% for AGIs $100k-200k)
Charity contributions: $9,300 (reported on 14.4% of returns)
Here:
$9,300
State:
$6,808
(% of AGI for various income ranges: 1.8% for AGIs $25k-50k, 2.3% for AGIs $50k-75k, 3.7% for AGIs $75k-100k, 7.5% for AGIs $100k-200k)
Taxes paid: $3,494 (reported on 18.9% of returns)
79325:
$3,494
State:
$6,921
(% of AGI for various income ranges: 0.8% for AGIs $25k-50k, 1.0% for AGIs $50k-75k, 1.4% for AGIs $75k-100k, 4.3% for AGIs $100k-200k)
Earned income credit: $2,389 (reported on 21.1% of returns)
Here:
$2,389
State:
$2,570
(% of AGI for various income ranges: 7.3% for AGIs below $25k, 1.5% for AGIs $25k-50k)
Percentage of individuals using paid preparers for their 2012 taxes: 63.3%
Here:
63%
State:
51%
(% for various income ranges: 54.5% for AGIs below $25k, 64.3% for AGIs $25k-50k, 64.3% for AGIs $50k-75k, 71.4% for AGIs $75k-100k, 83.3% for AGIs $100k-200k, 100.0% for AGIs over 200k)
Averages for the 2004 tax year for zip code 79325, filed in 2005:
Average Adjusted Gross Income (AGI) in 2004: $34,141 (Individual Income Tax Returns)
Here:
$34,141
State:
$47,881
Salary/wage: $29,585 (reported on 79.0% of returns)
Here:
$29,585
State:
$41,947
(% of AGI for various income ranges: 80.8% for AGIs $10k-25k, 85.2% for AGIs $25k-50k, 74.4% for AGIs $50k-75k, 62.2% for AGIs $75k-100k, 30.9% for AGIs over 100k)
Taxable interest for individuals: $3,087 (reported on 37.9% of returns)
This zip code:
$3,087
Texas:
$2,255
(% of AGI for various income ranges: 4.3% for AGIs $10k-25k, 2.4% for AGIs $25k-50k, 2.2% for AGIs $50k-75k, 2.1% for AGIs $75k-100k, 3.7% for AGIs over 100k)
Taxable dividends: $5,707 (reported on 17.2% of returns)
Here:
$5,707
State:
$4,261
(% of AGI for various income ranges: 1.0% for AGIs $10k-25k, 0.6% for AGIs $25k-50k, 0.7% for AGIs $50k-75k, 0.7% for AGIs $75k-100k, 8.0% for AGIs over 100k)
Net capital gain/loss: +$9,026 (reported on 16.9% of returns)
Here:
+$9,026
State:
+$16,110
(% of AGI for various income ranges: -0.3% for AGIs $10k-25k, -0.2% for AGIs $25k-50k, 3.3% for AGIs $50k-75k, 2.7% for AGIs $75k-100k, 13.3% for AGIs over 100k)
Profit/loss from business: +$4,027 (reported on 16.0% of returns)
Here:
+$4,027
State:
+$11,013
(% of AGI for various income ranges: 2.6% for AGIs $10k-25k, 1.9% for AGIs $25k-50k, 4.1% for AGIs $50k-75k, 0.2% for AGIs over 100k)
IRA payment deduction: $3,200 (reported on 2.7% of returns)
79325:
$3,200
Texas:
$3,120
Total itemized deductions: $16,527 (21% of AGI, reported on 14.2% of returns)
Here:
$16,527
State:
$19,631
Here:
21.2% of AGI
State:
18.9% of AGI
(% of AGI for various income ranges: 3.4% for AGIs $10k-25k, 5.7% for AGIs $25k-50k, 6.9% for AGIs $50k-75k, 11.2% for AGIs $75k-100k, 6.0% for AGIs over 100k)
Charity contributions deductions: $5,712 (7% of AGI, reported on 11.4% of returns)
Here:
$5,712
State:
$4,753
Here:
6.5% of AGI
State:
4.2% of AGI
(% of AGI for various income ranges: 1.2% for AGIs $25k-50k, 1.8% for AGIs $50k-75k, 4.3% for AGIs $75k-100k, 2.4% for AGIs over 100k)
Total tax: $5,829 (reported on 62.8% of returns)
79325:
$5,829
State:
$9,058
(% of AGI for various income ranges: 3.8% for AGIs $10k-25k, 4.9% for AGIs $25k-50k, 8.3% for AGIs $50k-75k, 10.3% for AGIs $75k-100k, 21.0% for AGIs over 100k)
Earned income credit: $1,903 (reported on 21.4% of returns)
Here:
$1,903
State:
$2,024
Percentage of individuals using paid preparers for their 2004 taxes: 71.2%
Here:
71%
State:
57%
(% for various income ranges: 66.1% for AGIs below $10k, 74.2% for AGIs $10k-25k, 70.6% for AGIs $25k-50k, 71.2% for AGIs $50k-75k, 68.4% for AGIs $75k-100k, 90.5% for AGIs over 100k)
Household received Food Stamps/SNAP in the past 12 months: 50 Household did not receive Food Stamps/SNAP in the past 12 months: 713
Women who had a birth in the past 12 months: 36 (36 now married, 0 unmarried) Women who did not have a birth in the past 12 months: 504 (265 now married, 237 unmarried)
Housing units in zip code 79325 with a mortgage: 159 (19 second mortgage, 21 both second mortgage and home equity loan) Median monthly owner costs for units with a mortgage: $1,788 Median monthly owner costs for units without a mortgage: $491
Residents with income below the poverty level in 2022:
This zip code:
9.3%
Whole state:
14.0%
Residents with income below 50% of the poverty level in 2022:
This zip code:
7.1%
Whole state:
7.4%
Median number of rooms in houses and condos:
Here:
5.8
State:
6.3
Median number of rooms in apartments:
Here:
4.8
State:
4.0
Notable locations in this zip code not listed on our city pages
Notable locations in zip code 79325: Oklahoma Lane (A), Oklahoma Lane Community Center (B), Farwell Volunteer Fire Department (C), Farwell Emergency Medical Services (D). Display/hide their locations on the map
In group quarters: 33 (-1 institutionalized population)
Size of family households: 250 2-persons, 134 3-persons, 105 4-persons, 102 5-persons, 7 6-persons, 14 7-or-more-persons
Size of nonfamily households: 147 1-person
694 married couples with children.
110 single-parent households (22 men, 88 women).
62.2% of residents of 79325 zip code speak English at home.
36.5% of residents speak Spanish at home (69% very well, 8% well, 16% not well, 7% not at all).
0.4% of residents speak other Indo-European language at home (56% very well, 44% well).
Foreign born population: 381 (15.6%) (33.2% of them are naturalized citizens)
This zip code:
15.6%
Whole state:
17.2%
96%Honduras
5%English
5%German
4%American
3%Scottish
2%Irish
1%Scotch-Irish
1%Czech
Year of entry for the foreign-born population
2102010 or later
82000 to 2009
451990 to 1999
140Before 1990
Housing units lacking complete plumbing facilities: 6.8% Housing units lacking complete kitchen facilities: 5.1%
54.0%Utility gas
41.7%Electricity
3.6%Other fuel
0.8%Bottled, tank, or LP gas
Population in 1990: 2,270. Population change in the 1990s: +33 (+1.5%).
Place of birth for U.S.-born residents:
This state: 960
Northeast: 27
Midwest: 122
South: 137
West: 849
59% of the 79325 zip code residents lived in the same house 5 years ago. Out of people who lived in different houses, 44% lived in this county. Out of people who lived in different counties, 50% lived in Texas.
92% of the 79325 zip code residents lived in the same house 1 year ago. Out of people who lived in different houses, 24% moved from this county. Out of people who lived in different houses, 7% moved from different county within same state. Out of people who lived in different houses, 61% moved from different state. Out of people who lived in different houses, 16% moved from abroad.
Private vs. public school enrollment:
Students in private schools in grades 1 to 8 (elementary and middle school): 17
Here:
4.8%
Texas:
8.8%
Students in private schools in grades 9 to 12 (high school):
Here:
0.0%
Texas:
8.0%
Students in private undergraduate colleges:
Here:
0.0%
Texas:
16.2%
Occupation by median earnings in the past 12 months ($)
59,535Sales and related occupations
56,256Production occupations
56,062Management occupations
55,400Construction and extraction occupations
54,415Education, training, and library occupations
46,267Transportation occupations
Companies with federal contracts located in this zip code:
TOP OF TEXAS APPLES INC (715 FM 292 in FARWELL, TX; small business) : $361,851 in 13 contractsfrom 2004 to 2005
Contracts for Fruits and Vegetables by Defense Logistics Agency Signed by year:2000: $0; 2001: $0; 2002: $0; 2003: $0; 2004: $33,787; 2005: $328,064; 2006: $0.
Biggest contracts:
$66,308 with Defense Logistics Agency for Fruits and Vegetables. Signed on 2005-10-19. Completion date: 2005-10-19.
$61,050, same as above.Signed on 2005-09-29. Completion date: 2005-09-29.
$40,898, same as above.Signed on 2005-09-29. Completion date: 2005-09-29.
$37,620, same as above.Signed on 2005-10-04. Completion date: 2005-10-04.
Top industries in this zip code by the number of employees in 2005:

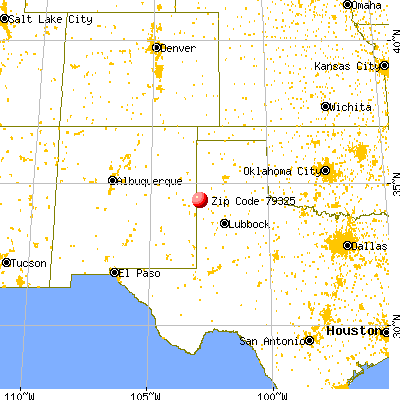


 Nearest zip codes: 79009, 88135, 79347, 79035, 88101, 79053.


 : $361,851 in 13 contracts from 2004 to 2005


