Estimated zip code population in 2022: 6,884 Zip code population in 2010: 7,230 Zip code population in 2000: 7,339
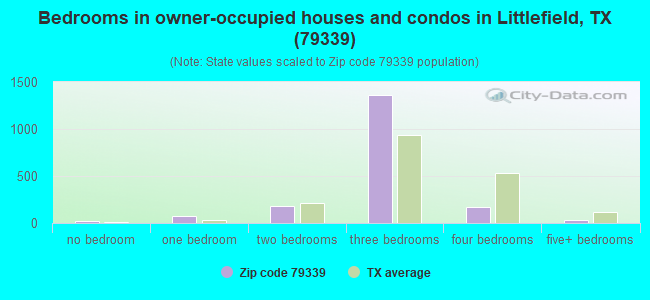
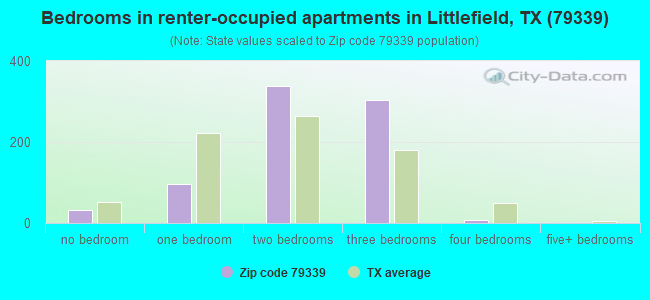
Houses and condos: 3,190 Renter-occupied apartments: 786
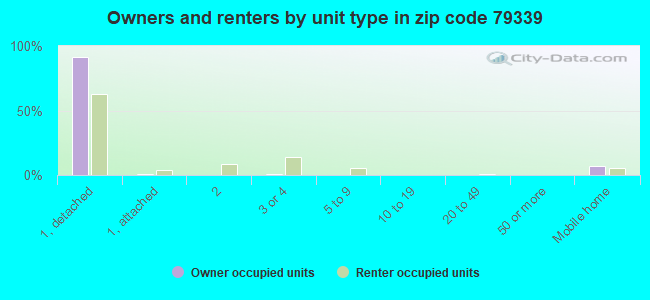
% of renters here:
30%
State:
38%
March 2022 cost of living index in zip code 79339: 75.7 (low, U.S. average is 100)
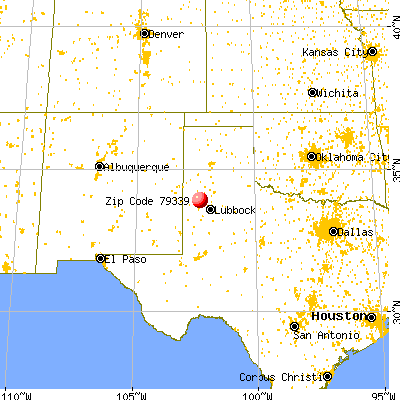
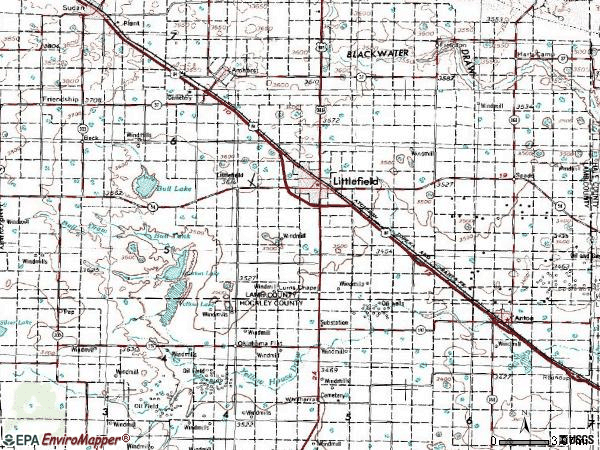
Land area: 277.3 sq. mi. Water area: 0.0 sq. mi.
Population density: 25 people per square mile
(very low).
OSM Map
General Map
Google Map
MSN Map
OSM Map
General Map
Google Map
MSN Map
OSM Map
General Map
Google Map
MSN Map
OSM Map
General Map
Google Map
MSN Map
Please wait while loading the map...
Real estate property taxes paid for housing units in 2022:
This zip code:
1.0% ($885)
Texas:
1.5% ($4,050)
Median real estate property taxes paid for housing units with mortgages in 2022: $1,775 (1.2%) Median real estate property taxes paid for housing units with no mortgage in 2022: $606 (0.8%)
Business Search- 14 Million verified businesses
Males: 3,359
(48.8%)
Females: 3,524
(51.2%)
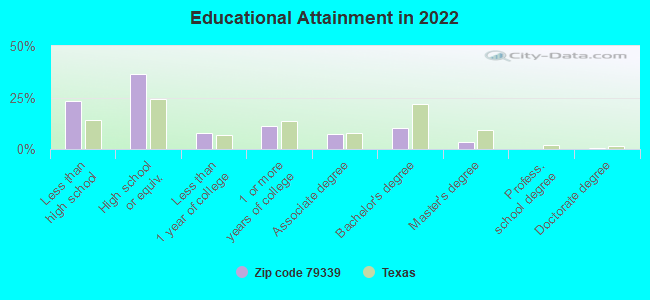
For population 25 years and over in 79339:
High school or higher: 75.2%
Bachelor's degree or higher: 14.0%
Graduate or professional degree: 4.0%
Unemployed: 2.7%
Mean travel time to work (commute): 16.7 minutes
For population 15 years and over in 79339:
Never married: 33.8%
Now married: 47.8%
Separated: 2.7%
Widowed: 7.4%
Divorced: 8.3%
Zip code 79339 compared to state average:
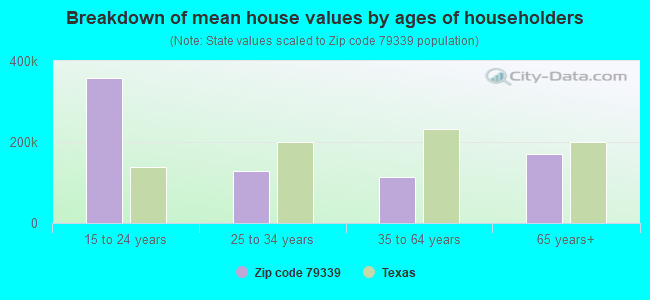
Median house value significantly below state average.
Black race population percentage significantly below state average.
Foreign-born population percentage below state average.
Length of stay since moving in significantly above state average.
House age above state average.
Number of college students below state average.
Percentage of population with a bachelor's degree or higher significantly below state average.
Averages for the 2020 tax year for zip code 79339, filed in 2021:
Average Adjusted Gross Income (AGI) in 2020: $48,499 (Individual Income Tax Returns)
Here:
$48,499
State:
$77,054
Salary/wage: $40,688 (reported on 84.7% of returns)
Here:
$40,688
State:
$62,766
(% of AGI for various income ranges: 1239.8% for AGIs below $25k, 3794.7% for AGIs $25k-50k, 6741.4% for AGIs $50k-75k, 10126.0% for AGIs $75k-100k, 16440.8% for AGIs $100k-200k)
Taxable interest for individuals: $1,493 (reported on 18.8% of returns)
This zip code:
$1,493
Texas:
$2,665
(% of AGI for various income ranges: 8.4% for AGIs below $25k, 27.9% for AGIs $25k-50k, 29.7% for AGIs $50k-75k, 35.3% for AGIs $75k-100k, 165.4% for AGIs $100k-200k)
Ordinary dividends: $2,533 (reported on 7.3% of returns)
Here:
$2,533
State:
$10,044
(% of AGI for various income ranges: 7.5% for AGIs below $25k, 15.2% for AGIs $25k-50k, 31.0% for AGIs $50k-75k, 60.0% for AGIs $75k-100k, 143.8% for AGIs $100k-200k)
Net capital gain/loss in AGI: +$18,313 (reported on 8.0% of returns)
Here:
+$18,313
State:
+$39,590
(% of AGI for various income ranges: 0.1% for AGIs below $25k, 17.0% for AGIs $25k-50k, 57.6% for AGIs $50k-75k, 90.0% for AGIs $75k-100k, 436.9% for AGIs $100k-200k)
Profit/loss from business: +$9,835 (reported on 12.9% of returns)
Here:
+$9,835
State:
+$10,888
(% of AGI for various income ranges: 73.7% for AGIs below $25k, 88.6% for AGIs $25k-50k, 201.7% for AGIs $50k-75k, 108.0% for AGIs $75k-100k, 1281.5% for AGIs $100k-200k)
Taxable individual retirement arrangement distribution: $13,725 (reported on 5.6% of returns)
79339:
$13,725
Texas:
$24,740
(% of AGI for various income ranges: 26.1% for AGIs below $25k, 50.8% for AGIs $25k-50k, 108.3% for AGIs $50k-75k, 232.0% for AGIs $75k-100k, 747.7% for AGIs $100k-200k)
Total itemized deductions: $34,920 (reported on 1.7% of returns)
Here:
$34,920
State:
$40,428
(% of AGI for various income ranges: 1343.1% for AGIs $100k-200k)
Charity contributions: $16,200 (reported on 1.4% of returns)
Here:
$16,200
State:
$18,201
(% of AGI for various income ranges: 498.5% for AGIs $100k-200k)
Taxes paid: $5,380 (reported on 1.7% of returns)
79339:
$5,380
State:
$7,821
(% of AGI for various income ranges: 206.9% for AGIs $100k-200k)
Earned income credit: $2,552 (reported on 25.4% of returns)
Here:
$2,552
State:
$2,584
(% of AGI for various income ranges: 134.3% for AGIs below $25k, 105.3% for AGIs $25k-50k)
Percentage of individuals using paid preparers for their 2020 taxes: 91.6%
Here:
92%
State:
92%
(% for various income ranges: 87.7% for AGIs below $25k, 93.9% for AGIs $25k-50k, 95.0% for AGIs $50k-75k, 91.3% for AGIs $75k-100k, 95.7% for AGIs $100k-200k, 100.0% for AGIs over 200k)
Averages for the 2012 tax year for zip code 79339, filed in 2013:
Average Adjusted Gross Income (AGI) in 2012: $39,514 (Individual Income Tax Returns)
Here:
$39,514
State:
$65,384
Salary/wage: $32,807 (reported on 86.0% of returns)
Here:
$32,807
State:
$52,524
(% of AGI for various income ranges: 80.4% for AGIs below $25k, 82.8% for AGIs $25k-50k, 78.0% for AGIs $50k-75k, 75.5% for AGIs $75k-100k, 69.2% for AGIs $100k-200k, 27.8% for AGIs over 200k)
Taxable interest for individuals: $1,284 (reported on 22.0% of returns)
This zip code:
$1,284
Texas:
$2,372
(% of AGI for various income ranges: 0.6% for AGIs below $25k, 0.4% for AGIs $25k-50k, 0.9% for AGIs $50k-75k, 1.2% for AGIs $75k-100k, 0.8% for AGIs $100k-200k, 0.7% for AGIs over 200k)
Ordinary dividends: $2,500 (reported on 8.4% of returns)
Here:
$2,500
State:
$9,721
(% of AGI for various income ranges: 0.4% for AGIs below $25k, 0.3% for AGIs $25k-50k, 0.3% for AGIs $50k-75k, 0.6% for AGIs $75k-100k, 0.7% for AGIs $100k-200k, 1.2% for AGIs over 200k)
Net capital gain/loss in AGI: +$13,256 (reported on 6.3% of returns)
Here:
+$13,256
State:
+$35,319
(% of AGI for various income ranges: 0.2% for AGIs $25k-50k, 1.2% for AGIs $100k-200k, 14.9% for AGIs over 200k)
Profit/loss from business: +$13,356 (reported on 12.6% of returns)
Here:
+$13,356
State:
+$13,732
(% of AGI for various income ranges: 7.4% for AGIs below $25k, 2.8% for AGIs $25k-50k, 1.2% for AGIs $50k-75k, 5.4% for AGIs $75k-100k, 8.6% for AGIs $100k-200k)
Taxable individual retirement arrangement distribution: $9,406 (reported on 6.3% of returns)
79339:
$9,406
Texas:
$19,511
(% of AGI for various income ranges: 1.3% for AGIs below $25k, 2.0% for AGIs $25k-50k, 3.0% for AGIs $50k-75k, 1.9% for AGIs $100k-200k)
Total itemized deductions: $19,984 (20% of AGI, reported on 8.7% of returns)
Here:
$19,984
State:
$24,724
Here:
20.0% of AGI
State:
15.9% of AGI
(% of AGI for various income ranges: 2.5% for AGIs below $25k, 3.4% for AGIs $25k-50k, 5.0% for AGIs $50k-75k, 6.1% for AGIs $75k-100k, 5.4% for AGIs $100k-200k, 5.1% for AGIs over 200k)
Charity contributions: $6,545 (reported on 7.0% of returns)
Here:
$6,545
State:
$6,808
(% of AGI for various income ranges: 0.3% for AGIs below $25k, 0.6% for AGIs $25k-50k, 0.9% for AGIs $50k-75k, 1.5% for AGIs $75k-100k, 1.7% for AGIs $100k-200k, 2.5% for AGIs over 200k)
Taxes paid: $3,750 (reported on 8.4% of returns)
79339:
$3,750
State:
$6,921
(% of AGI for various income ranges: 0.3% for AGIs below $25k, 0.5% for AGIs $25k-50k, 0.8% for AGIs $50k-75k, 1.1% for AGIs $75k-100k, 1.4% for AGIs $100k-200k, 1.0% for AGIs over 200k)
Earned income credit: $2,655 (reported on 33.6% of returns)
Here:
$2,655
State:
$2,570
(% of AGI for various income ranges: 10.8% for AGIs below $25k, 2.1% for AGIs $25k-50k)
Percentage of individuals using paid preparers for their 2012 taxes: 58.0%
Here:
58%
State:
51%
(% for various income ranges: 55.1% for AGIs below $25k, 58.5% for AGIs $25k-50k, 55.2% for AGIs $50k-75k, 66.7% for AGIs $75k-100k, 73.3% for AGIs $100k-200k, 75.0% for AGIs over 200k)
Averages for the 2004 tax year for zip code 79339, filed in 2005:
Average Adjusted Gross Income (AGI) in 2004: $29,195 (Individual Income Tax Returns)
Here:
$29,195
State:
$47,881
Salary/wage: $25,996 (reported on 86.3% of returns)
Here:
$25,996
State:
$41,947
(% of AGI for various income ranges: 124.8% for AGIs below $10k, 84.5% for AGIs $10k-25k, 81.7% for AGIs $25k-50k, 78.4% for AGIs $50k-75k, 80.0% for AGIs $75k-100k, 47.8% for AGIs over 100k)
Taxable interest for individuals: $2,150 (reported on 29.3% of returns)
This zip code:
$2,150
Texas:
$2,255
(% of AGI for various income ranges: 7.8% for AGIs below $10k, 1.6% for AGIs $10k-25k, 1.8% for AGIs $25k-50k, 1.1% for AGIs $50k-75k, 1.9% for AGIs $75k-100k, 3.7% for AGIs over 100k)
Taxable dividends: $1,652 (reported on 10.7% of returns)
Here:
$1,652
State:
$4,261
(% of AGI for various income ranges: 1.2% for AGIs below $10k, 0.5% for AGIs $10k-25k, 0.6% for AGIs $25k-50k, 0.4% for AGIs $50k-75k, 0.7% for AGIs $75k-100k, 0.7% for AGIs over 100k)
Net capital gain/loss: +$3,285 (reported on 7.9% of returns)
Here:
+$3,285
State:
+$16,110
(% of AGI for various income ranges: -0.4% for AGIs below $10k, -0.2% for AGIs $10k-25k, 0.8% for AGIs $25k-50k, 0.3% for AGIs $50k-75k, -0.3% for AGIs $75k-100k, 3.8% for AGIs over 100k)
Profit/loss from business: +$7,548 (reported on 14.0% of returns)
Here:
+$7,548
State:
+$11,013
(% of AGI for various income ranges: 1.7% for AGIs below $10k, 3.5% for AGIs $10k-25k, 2.6% for AGIs $25k-50k, 2.6% for AGIs $50k-75k, 0.3% for AGIs $75k-100k, 8.9% for AGIs over 100k)
Profit/loss from farming: +$1,483 (reported on 4.9% of returns)
Here:
+$1,483
State:
-$9,403
(% of AGI for various income ranges: -13.1% for AGIs below $10k, -0.3% for AGIs $10k-25k, -1.0% for AGIs $25k-50k, -0.5% for AGIs $50k-75k, -1.7% for AGIs $75k-100k, 7.5% for AGIs over 100k)
IRA payment deduction: $2,923 (reported on 1.7% of returns)
79339:
$2,923
Texas:
$3,120
Total itemized deductions: $16,208 (24% of AGI, reported on 7.7% of returns)
Here:
$16,208
State:
$19,631
Here:
23.6% of AGI
State:
18.9% of AGI
(% of AGI for various income ranges: 7.9% for AGIs below $10k, 2.6% for AGIs $10k-25k, 3.4% for AGIs $25k-50k, 4.9% for AGIs $50k-75k, 6.0% for AGIs $75k-100k, 5.3% for AGIs over 100k)
Charity contributions deductions: $5,484 (8% of AGI, reported on 6.3% of returns)
Here:
$5,484
State:
$4,753
Here:
7.6% of AGI
State:
4.2% of AGI
(% of AGI for various income ranges: 0.7% for AGIs below $10k, 0.5% for AGIs $10k-25k, 0.7% for AGIs $25k-50k, 1.2% for AGIs $50k-75k, 1.7% for AGIs $75k-100k, 2.4% for AGIs over 100k)
Total tax: $4,347 (reported on 60.5% of returns)
79339:
$4,347
State:
$9,058
(% of AGI for various income ranges: 3.4% for AGIs below $10k, 3.3% for AGIs $10k-25k, 5.5% for AGIs $25k-50k, 8.7% for AGIs $50k-75k, 11.7% for AGIs $75k-100k, 20.7% for AGIs over 100k)
Earned income credit: $1,916 (reported on 32.2% of returns)
Here:
$1,916
State:
$2,024
Percentage of individuals using paid preparers for their 2004 taxes: 69.7%
Here:
70%
State:
57%
(% for various income ranges: 62.7% for AGIs below $10k, 72.6% for AGIs $10k-25k, 72.2% for AGIs $25k-50k, 69.0% for AGIs $50k-75k, 68.1% for AGIs $75k-100k, 84.8% for AGIs over 100k)
Household received Food Stamps/SNAP in the past 12 months: 547 Household did not receive Food Stamps/SNAP in the past 12 months: 2,103
Women who had a birth in the past 12 months: 69 (35 now married, 32 unmarried) Women who did not have a birth in the past 12 months: 1,348 (491 now married, 859 unmarried)
Housing units in zip code 79339 with a mortgage: 585 Median monthly owner costs for units with a mortgage: $1,061 Median monthly owner costs for units without a mortgage: $390
Residents with income below the poverty level in 2022:
This zip code:
16.9%
Whole state:
14.0%
Residents with income below 50% of the poverty level in 2022:
This zip code:
7.8%
Whole state:
7.4%
Median number of rooms in houses and condos:
Here:
5.8
State:
6.3
Median number of rooms in apartments:
Here:
4.7
State:
4.0
Notable locations in this zip code not listed on our city pages
Notable locations in zip code 79339: Double Windmills (A), East Windmill (B), Hart Camp (C), Hester Ranch (D), Rye Straw Windmill (E), South Pasture Windmill (F), South Twomile Windmill (G), Yellow House Ranch (H), Littlefield Country Club (I), Bull Draw Windmill (J), Lamb County Courthouse (K), Littlefield Fire Department (L), City of Littlefield Emergency Medical Services (M). Display/hide their locations on the map
Churches in zip code 79339 include: Emmanuel Church (A), New Life Fellowship Church (B), Nazarene Church (C), Church of Christ -- Crescent Park (D), Parkview Baptist Church (E), New Jerusalem Baptist Church (F), First Baptist Church (G), New Covenant Assembly of God Church (H). Display/hide their locations on the map
In group quarters: 87 (-1 institutionalized population)
Size of family households: 664 2-persons, 397 3-persons, 395 4-persons, 187 5-persons, 57 6-persons, 16 7-or-more-persons
Size of nonfamily households: 917 1-person
815 married couples with children.
763 single-parent households (207 men, 556 women).
62.4% of residents of 79339 zip code speak English at home.
37.4% of residents speak Spanish at home (76% very well, 6% well, 16% not well, 2% not at all).
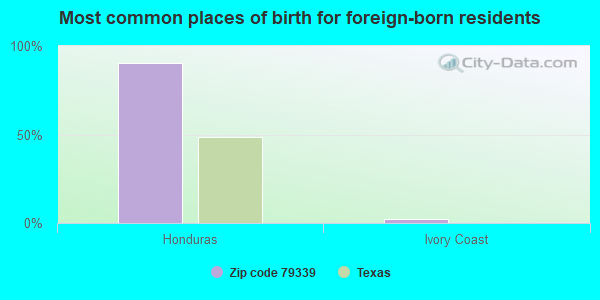
Foreign born population: 547 (7.9%) (17.9% of them are naturalized citizens)
This zip code:
7.9%
Whole state:
17.2%
91%Honduras
2%Ivory Coast
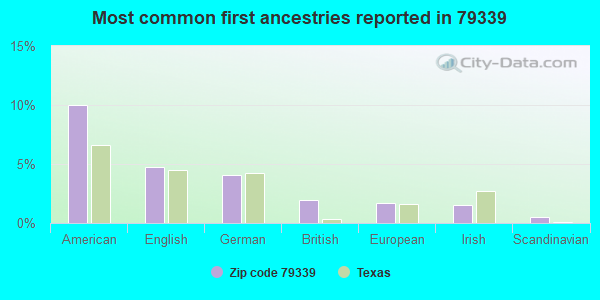
10%American
5%English
4%German
2%British
2%European
2%Irish
1%Scandinavian
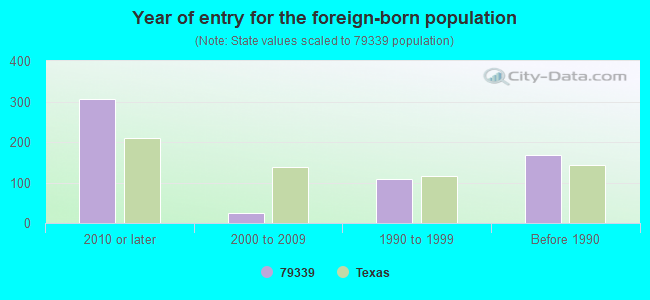
Year of entry for the foreign-born population
3062010 or later
242000 to 2009
1091990 to 1999
168Before 1990
Facilities with environmental interests located in this zip code:
ARMS EQUIPMENT COMPANY (HGHWAY 84 in LITTLEFIELD, TX)
(Resource Conservation and Recovery Act (tracking hazardous waste))
AMERICAN COTTON GROWERS (HIGHWAY 54 EAST in LITTLEFIELD, TX)
Conditionally Exempt Small Quantity Generators, less than 100 kg/month of hazardous waste (Resource Conservation and Recovery Act (tracking hazardous waste)) TRI REPORTER (Tracking of toxic chemicals releasing facilities) Business SIC classification: BROADWOVEN FABRIC MILLS, COTTON Organizations: PLAINS COTTON COOPERATIVE ASSOCIATION (CONTACT/OPERATOR)
Alternative names: PLAINS COTTON COOP ASSN MILL
AMERICAN PLANT FOOD CORP. (LITTLEFIELD BRANCH E. LOOP 430 in LITTLEFIELD, TX)
TRI REPORTER (Tracking of toxic chemicals releasing facilities) Business SIC classification: FERTILIZERS, MIXING ONLY
Housing units lacking complete plumbing facilities: 13.7% Housing units lacking complete kitchen facilities: 10.9%
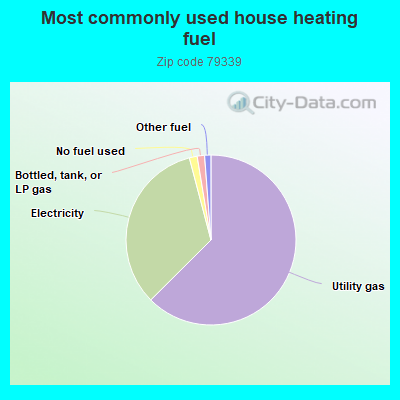
62.6%Utility gas
33.4%Electricity
1.5%No fuel used
1.4%Bottled, tank, or LP gas
1.2%Other fuel
Population in 1990: 7,766.
Place of birth for U.S.-born residents:
This state: 5,647
Midwest: 25
South: 98
West: 481
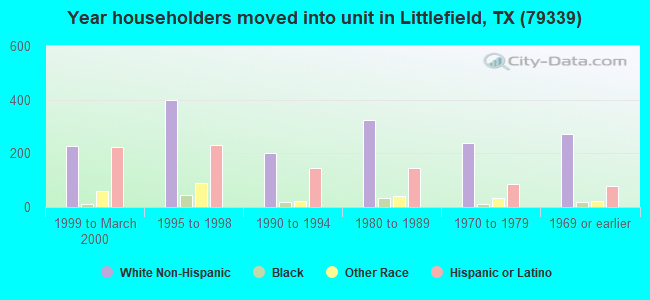
63% of the 79339 zip code residents lived in the same house 5 years ago. Out of people who lived in different houses, 62% lived in this county. Out of people who lived in different counties, 50% lived in Texas.
87% of the 79339 zip code residents lived in the same house 1 year ago. Out of people who lived in different houses, 45% moved from this county. Out of people who lived in different houses, 38% moved from different county within same state. Out of people who lived in different houses, 15% moved from different state. Out of people who lived in different houses, 2% moved from abroad.
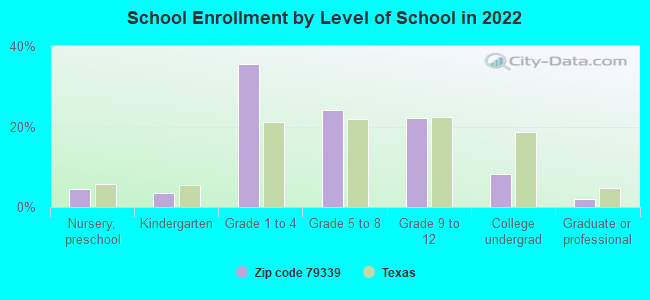
Private vs. public school enrollment:
Students in private schools in grades 1 to 8 (elementary and middle school): 65
Here:
6.9%
Texas:
8.8%
Students in private schools in grades 9 to 12 (high school): 39
Here:
11.2%
Texas:
8.0%
Students in private undergraduate colleges:
Here:
0.0%
Texas:
16.2%
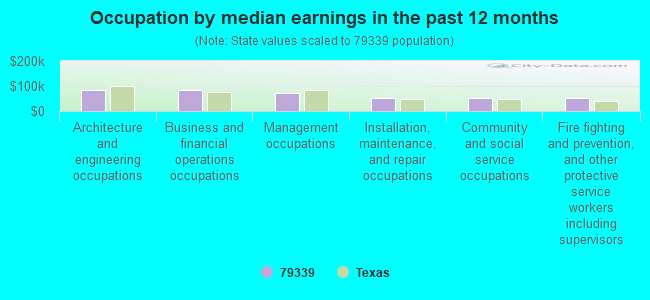
Occupation by median earnings in the past 12 months ($)
85,739Architecture and engineering occupations
82,994Business and financial operations occupations
71,338Management occupations
53,953Installation, maintenance, and repair occupations
51,924Community and social service occupations
50,792Fire fighting and prevention, and other protective service workers including supervisors
Top industries in this zip code by the number of employees in 2005:
Health Care and Social Assistance: General Medical and Surgical Hospitals (100-249 employees: 1 establishment)
Health Care and Social Assistance: Nursing Care Facilities (50-99: 2)
Finance and Insurance: Commercial Banking (20-49: 2, 5-9: 3)
Administrative and Support and Waste Management and Remediation Services: Facilities Support Services (50-99: 1)
Accommodation and Food Services: Full-Service Restaurants (10-19: 2, 5-9: 2)
People in group quarters in 2010:
40 people in local jails and other municipal confinement facilities
40 people in nursing facilities/skilled-nursing facilities
People in group quarters in 2000:
137 people in nursing homes
51 people in local jails and other confinement facilities (including police lockups)
Fatal accident statistics in 2013:
Fatal accident count: 1
Vehicles involved in fatal accidents: 2
Fatal accidents caused by drunken drivers: 0
Fatalities: 2
Persons involved in fatal accidents: 3
Pedestrians involved in fatal accidents: 0
Fatal accident statistics in 2012:
Fatal accident count: 1
Vehicles involved in fatal accidents: 2
Fatal accidents caused by drunken drivers: 1
Fatalities: 1
Persons involved in fatal accidents: 2
Pedestrians involved in fatal accidents: 0
2002 - 2018 National Fire Incident Reporting System (NFIRS) incidents
According to the data from the years 2002 - 2018 the average number of fire incidents per year is 75. The highest number of reported fires - 99 took place in 2008, and the least - 40 in 2004. The data has a rising trend.
When looking into fire subcategories, the most reports belonged to: Outside Fires (65.7%), and Structure Fires (20.0%).
Fire incident types reported to NFIRS in Zip Code 79339


+$1,483
-$9,403
(% of AGI for various income ranges: -13.1% for AGIs below $10k, -0.3% for AGIs $10k-25k, -1.0% for AGIs $25k-50k, -0.5% for AGIs $50k-75k, -1.7% for AGIs $75k-100k, 7.5% for AGIs over 100k) Nearest zip codes: 79380, 79312, 79313, 79369, 79326, 79353.


 According to the data from the years 2002 - 2018 the average number of fire incidents per year is 75. The highest number of reported fires - 99 took place in 2008, and the least - 40 in 2004. The data has a rising trend.
 When looking into fire subcategories, the most reports belonged to: Outside Fires (65.7%), and Structure Fires (20.0%).