Estimated zip code population in 2022: 1,101 Zip code population in 2010: 1,096 Zip code population in 2000: 1,459
Houses and condos: 542 Renter-occupied apartments: 11
% of renters here:
2%
State:
38%
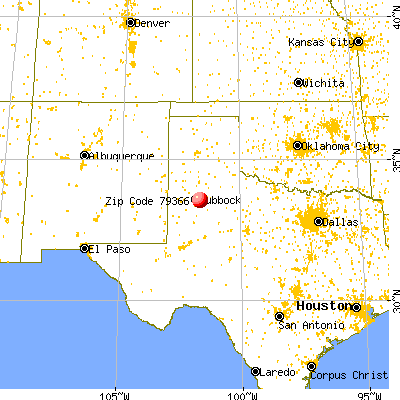
March 2022 cost of living index in zip code 79366: 77.5 (low, U.S. average is 100)
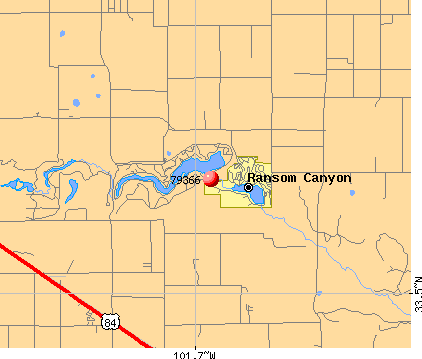
Land area: 0.8 sq. mi. Water area: 0.2 sq. mi.
Population density: 1,354 people per square mile
(low).
OSM Map
General Map
Google Map
MSN Map
OSM Map
General Map
Google Map
MSN Map
OSM Map
General Map
Google Map
MSN Map
OSM Map
General Map
Google Map
MSN Map
Please wait while loading the map...
Real estate property taxes paid for housing units in 2022:
This zip code:
1.4% ($5,176)
Texas:
1.5% ($4,050)
Median real estate property taxes paid for housing units with mortgages in 2022: $5,968 (1.6%) Median real estate property taxes paid for housing units with no mortgage in 2022: $5,158 (1.4%)
Business Search- 14 Million verified businesses
Males: 527
(47.9%)
Females: 573
(52.1%)
For population 25 years and over in 79366:
High school or higher: 99.3%
Bachelor's degree or higher: 50.5%
Graduate or professional degree: 25.4%
Unemployed: 1.8%
Mean travel time to work (commute): 25.5 minutes
For population 15 years and over in 79366:
Never married: 16.5%
Now married: 69.6%
Separated: 0.5%
Widowed: 6.9%
Divorced: 6.5%
Zip code 79366 compared to state average:
Median household income above state average.
Unemployed percentage below state average.
Black race population percentage significantly below state average.
Hispanic race population percentage below state average.
Median age significantly above state average.
Foreign-born population percentage significantly below state average.
Renting percentage significantly below state average.
Length of stay since moving in significantly above state average.
Number of rooms per house above state average.
Number of college students below state average.
Percentage of population with a bachelor's degree or higher above state average.
Estimated median house/condo value in 2022: $363,806
79366:
$363,806
Texas:
$275,400
According to our research of Texas and other state lists, there was 1 registered sex offender living in 79366 zip code as of May 28, 2024. The ratio of all residents to sex offenders in zip code 79366 is 1,344 to 1. The ratio of registered sex offenders to all residents in this zip code is much lower than the state average.
Median resident age:
This zip code:
55.0 years
Texas median age:
35.6 years
Average household size:
This zip code:
2.3 people
Texas:
2.6 people
Averages for the 2020 tax year for zip code 79366, filed in 2021:
Average Adjusted Gross Income (AGI) in 2020: $112,033 (Individual Income Tax Returns)
Here:
$112,033
State:
$77,054
Salary/wage: $90,846 (reported on 74.5% of returns)
Here:
$90,846
State:
$62,766
(% of AGI for various income ranges: 1052.9% for AGIs below $25k, 3091.7% for AGIs $25k-50k, 6740.0% for AGIs $50k-75k, 9785.0% for AGIs $75k-100k, 18187.1% for AGIs $100k-200k, 76570.0% for AGIs over 200k)
Taxable interest for individuals: $3,638 (reported on 52.7% of returns)
This zip code:
$3,638
Texas:
$2,665
(% of AGI for various income ranges: 24.3% for AGIs below $25k, 48.3% for AGIs $25k-50k, 55.0% for AGIs $50k-75k, 192.5% for AGIs $75k-100k, 502.9% for AGIs $100k-200k, 2790.0% for AGIs over 200k)
Ordinary dividends: $7,444 (reported on 29.1% of returns)
Here:
$7,444
State:
$10,044
(% of AGI for various income ranges: 157.1% for AGIs below $25k, 350.0% for AGIs $50k-75k, 732.9% for AGIs $100k-200k, 2140.0% for AGIs over 200k)
Net capital gain/loss in AGI: +$12,938 (reported on 29.1% of returns)
Here:
+$12,938
State:
+$39,590
(% of AGI for various income ranges: 36.7% for AGIs $25k-50k, 232.5% for AGIs $75k-100k, 1177.1% for AGIs $100k-200k, 5655.0% for AGIs over 200k)
Profit/loss from business: +$10,650 (reported on 21.8% of returns)
Here:
+$10,650
State:
+$10,888
(% of AGI for various income ranges: 291.4% for AGIs below $25k, 437.5% for AGIs $50k-75k, 697.1% for AGIs $100k-200k, 2055.0% for AGIs over 200k)
Taxable individual retirement arrangement distribution: $17,920 (reported on 18.2% of returns)
79366:
$17,920
Texas:
$24,740
(% of AGI for various income ranges: 372.9% for AGIs below $25k, 1315.0% for AGIs $50k-75k, 1435.7% for AGIs $100k-200k)
Total itemized deductions: $31,529 (reported on 12.7% of returns)
Here:
$31,529
State:
$40,428
(% of AGI for various income ranges: 784.3% for AGIs below $25k, 1080.0% for AGIs $100k-200k, 4510.0% for AGIs over 200k)
Charity contributions: $13,233 (reported on 10.9% of returns)
Here:
$13,233
State:
$18,201
(% of AGI for various income ranges: 1134.3% for AGIs $100k-200k)
Taxes paid: $7,943 (reported on 12.7% of returns)
79366:
$7,943
State:
$7,821
(% of AGI for various income ranges: 192.9% for AGIs below $25k, 300.0% for AGIs $100k-200k, 1055.0% for AGIs over 200k)
Earned income credit: $1,900 (reported on 5.5% of returns)
Here:
$1,900
State:
$2,584
(% of AGI for various income ranges: 81.4% for AGIs below $25k)
Percentage of individuals using paid preparers for their 2020 taxes: 87.3%
Here:
87%
State:
92%
(% for various income ranges: 81.8% for AGIs below $25k, 87.5% for AGIs $25k-50k, 85.7% for AGIs $50k-75k, 85.7% for AGIs $75k-100k, 86.7% for AGIs $100k-200k, 100.0% for AGIs over 200k)
Averages for the 2012 tax year for zip code 79366, filed in 2013:
Average Adjusted Gross Income (AGI) in 2012: $126,616 (Individual Income Tax Returns)
Here:
$126,616
State:
$65,384
Salary/wage: $82,710 (reported on 79.6% of returns)
Here:
$82,710
State:
$52,524
(% of AGI for various income ranges: 66.1% for AGIs below $25k, 64.5% for AGIs $25k-50k, 66.1% for AGIs $50k-75k, 69.2% for AGIs $75k-100k, 64.3% for AGIs $100k-200k, 38.4% for AGIs over 200k)
Taxable interest for individuals: $3,821 (reported on 57.1% of returns)
This zip code:
$3,821
Texas:
$2,372
(% of AGI for various income ranges: 1.1% for AGIs below $25k, 4.2% for AGIs $25k-50k, 1.4% for AGIs $50k-75k, 0.7% for AGIs $75k-100k, 2.2% for AGIs $100k-200k, 1.5% for AGIs over 200k)
Ordinary dividends: $4,453 (reported on 34.7% of returns)
Here:
$4,453
State:
$9,721
(% of AGI for various income ranges: 4.8% for AGIs $25k-50k, 1.5% for AGIs $75k-100k, 1.6% for AGIs $100k-200k, 0.9% for AGIs over 200k)
Net capital gain/loss in AGI: +$4,727 (reported on 30.6% of returns)
Here:
+$4,727
State:
+$35,319
(% of AGI for various income ranges: 0.2% for AGIs $100k-200k, 2.2% for AGIs over 200k)
Profit/loss from business: +$10,309 (reported on 22.4% of returns)
Here:
+$10,309
State:
+$13,732
(% of AGI for various income ranges: 9.8% for AGIs below $25k, 4.9% for AGIs $50k-75k, 3.4% for AGIs $75k-100k, 3.6% for AGIs $100k-200k)
Taxable individual retirement arrangement distribution: $19,811 (reported on 18.4% of returns)
79366:
$19,811
Texas:
$19,511
(% of AGI for various income ranges: 9.9% for AGIs below $25k, 13.1% for AGIs $50k-75k, 6.6% for AGIs $100k-200k)
Total itemized deductions: $26,396 (14% of AGI, reported on 49.0% of returns)
Here:
$26,396
State:
$24,724
Here:
13.6% of AGI
State:
15.9% of AGI
(% of AGI for various income ranges: 47.7% for AGIs below $25k, 17.1% for AGIs $50k-75k, 14.7% for AGIs $75k-100k, 10.5% for AGIs $100k-200k, 7.7% for AGIs over 200k)
Charity contributions: $7,495 (reported on 42.9% of returns)
Here:
$7,495
State:
$6,808
(% of AGI for various income ranges: 6.0% for AGIs below $25k, 2.7% for AGIs $50k-75k, 2.9% for AGIs $75k-100k, 2.5% for AGIs $100k-200k, 2.6% for AGIs over 200k)
Taxes paid: $7,992 (reported on 49.0% of returns)
79366:
$7,992
State:
$6,921
(% of AGI for various income ranges: 15.7% for AGIs below $25k, 5.1% for AGIs $50k-75k, 4.7% for AGIs $75k-100k, 3.5% for AGIs $100k-200k, 2.0% for AGIs over 200k)
Earned income credit: $1,600 (reported on 6.1% of returns)
Here:
$1,600
State:
$2,570
(% of AGI for various income ranges: 3.8% for AGIs below $25k)
Percentage of individuals using paid preparers for their 2012 taxes: 61.2%
Here:
61%
State:
51%
(% for various income ranges: 60.0% for AGIs below $25k, 50.0% for AGIs $25k-50k, 66.7% for AGIs $50k-75k, 57.1% for AGIs $75k-100k, 66.7% for AGIs $100k-200k, 66.7% for AGIs over 200k)
Averages for the 2004 tax year for zip code 79366, filed in 2005:
Average Adjusted Gross Income (AGI) in 2004: $92,490 (Individual Income Tax Returns)
Here:
$92,490
State:
$47,881
Salary/wage: $72,443 (reported on 80.5% of returns)
Here:
$72,443
State:
$41,947
(% of AGI for various income ranges: 56.0% for AGIs $10k-25k, 72.0% for AGIs $25k-50k, 71.4% for AGIs $50k-75k, 77.9% for AGIs $75k-100k, 57.2% for AGIs over 100k)
Taxable interest for individuals: $2,520 (reported on 67.6% of returns)
This zip code:
$2,520
Texas:
$2,255
(% of AGI for various income ranges: 9.7% for AGIs $10k-25k, 3.1% for AGIs $25k-50k, 4.2% for AGIs $50k-75k, 0.7% for AGIs $75k-100k, 1.1% for AGIs over 100k)
Taxable dividends: $4,098 (reported on 44.4% of returns)
Here:
$4,098
State:
$4,261
(% of AGI for various income ranges: 4.5% for AGIs $10k-25k, 1.8% for AGIs $25k-50k, 1.7% for AGIs $50k-75k, 0.9% for AGIs $75k-100k, 2.2% for AGIs over 100k)
Net capital gain/loss: +$1,612 (reported on 36.8% of returns)
Here:
+$1,612
State:
+$16,110
(% of AGI for various income ranges: -2.0% for AGIs $10k-25k, -0.8% for AGIs $25k-50k, 0.6% for AGIs $50k-75k, -0.6% for AGIs $75k-100k, 1.3% for AGIs over 100k)
Profit/loss from business: +$6,658 (reported on 26.9% of returns)
Here:
+$6,658
State:
+$11,013
(% of AGI for various income ranges: 6.3% for AGIs $10k-25k, 2.9% for AGIs $25k-50k, 0.4% for AGIs $50k-75k, -0.1% for AGIs $75k-100k, 2.3% for AGIs over 100k)
Profit/loss from farming: +$3,583 (reported on 2.8% of returns)
Here:
+$3,583
State:
-$9,403
IRA payment deduction: $3,583 (reported on 2.8% of returns)
79366:
$3,583
Texas:
$3,120
Total itemized deductions: $19,625 (18% of AGI, reported on 58.2% of returns)
Here:
$19,625
State:
$19,631
Here:
18.0% of AGI
State:
18.9% of AGI
(% of AGI for various income ranges: 31.7% for AGIs $10k-25k, 18.2% for AGIs $25k-50k, 17.1% for AGIs $50k-75k, 13.7% for AGIs $75k-100k, 9.4% for AGIs over 100k)
Charity contributions deductions: $5,500 (5% of AGI, reported on 49.7% of returns)
Here:
$5,500
State:
$4,753
Here:
4.7% of AGI
State:
4.2% of AGI
(% of AGI for various income ranges: 3.5% for AGIs $10k-25k, 2.1% for AGIs $25k-50k, 3.2% for AGIs $50k-75k, 2.2% for AGIs $75k-100k, 3.2% for AGIs over 100k)
Total tax: $17,015 (reported on 89.7% of returns)
79366:
$17,015
State:
$9,058
(% of AGI for various income ranges: 5.3% for AGIs $10k-25k, 7.7% for AGIs $25k-50k, 8.0% for AGIs $50k-75k, 11.2% for AGIs $75k-100k, 20.9% for AGIs over 100k)
Earned income credit: $1,875 (reported on 3.7% of returns)
Here:
$1,875
State:
$2,024
Percentage of individuals using paid preparers for their 2004 taxes: 58.9%
Here:
59%
State:
57%
(% for various income ranges: 67.1% for AGIs $10k-25k, 55.1% for AGIs $25k-50k, 61.8% for AGIs $50k-75k, 58.6% for AGIs $75k-100k, 60.8% for AGIs over 100k)
Likely homosexual households (counted as self-reported same-sex unmarried-partner households)
Lesbian couples: 1.4% of all households
Gay men: 0.0% of all households
Household received Food Stamps/SNAP in the past 12 months: 15 Household did not receive Food Stamps/SNAP in the past 12 months: 459
Women who had a birth in the past 12 months: 2 (2 now married, 0 unmarried) Women who did not have a birth in the past 12 months: 162 (104 now married, 57 unmarried)
Housing units in zip code 79366 with a mortgage: 215 (13 second mortgage, 10 both second mortgage and home equity loan) Median monthly owner costs for units with a mortgage: $2,332 Median monthly owner costs for units without a mortgage: $1,055
Residents with income below the poverty level in 2022:
This zip code:
3.0%
Whole state:
14.0%
Residents with income below 50% of the poverty level in 2022:
This zip code:
0.8%
Whole state:
7.4%
Median number of rooms in houses and condos:
Here:
6.7
State:
6.3
Notable locations in this zip code not listed on our city pages
Size of family households: 220 2-persons, 28 3-persons, 80 4-persons, 18 5-persons, 2 6-persons, 3 7-or-more-persons
Size of nonfamily households: 111 1-person, 12 2-persons
154 married couples with children.
0 single-parent households ().
88.5% of residents of 79366 zip code speak English at home.
8.5% of residents speak Spanish at home (100% very well).
2.0% of residents speak other Indo-European language at home (100% very well).
1.0% of residents speak Asian or Pacific Island language at home (100% very well).
0.7% of residents speak other language at home (38% very well, 62% well).
Foreign born population: 50 (4.6%) (43.4% of them are naturalized citizens)
This zip code:
4.6%
Whole state:
17.2%
24%France
14%Malaysia
10%Saudi Arabia
10%Honduras
23%English
19%German
17%American
8%European
2%Dutch
2%Irish
1%Eastern European
Year of entry for the foreign-born population
142010 or later
232000 to 2009
01990 to 1999
18Before 1990
83.9%Utility gas
16.2%Electricity
Population in 1990: 1,248. Population change in the 1990s: +211 (+16.9%).
Place of birth for U.S.-born residents:
This state: 783
Northeast: 36
Midwest: 50
South: 53
West: 118
53% of the 79366 zip code residents lived in the same house 5 years ago. Out of people who lived in different houses, 63% lived in this county. Out of people who lived in different counties, 50% lived in Texas.
93% of the 79366 zip code residents lived in the same house 1 year ago. Out of people who lived in different houses, 66% moved from this county. Out of people who lived in different houses, 24% moved from different county within same state. Out of people who lived in different houses, 7% moved from different state.
Private vs. public school enrollment:
Students in private schools in grades 1 to 8 (elementary and middle school): 15
Here:
21.6%
Texas:
8.8%
Students in private schools in grades 9 to 12 (high school): 20
Here:
30.6%
Texas:
8.0%
Students in private undergraduate colleges: 3
Here:
21.5%
Texas:
16.2%
Occupation by median earnings in the past 12 months ($)
182,826Health diagnosing and treating practitioners and other technical occupations
150,333Architecture and engineering occupations
105,992Life, physical, and social science occupations
87,896Management occupations
78,800Community and social service occupations
75,314Transportation occupations
Companies with federal contracts located in this zip code:
ronald j. kendall & associates (48 South Lakeshore Drive in Ramson Canyon, TX)
$45,800 with Offices, Boards and Divisions (includes Attorney General, Deputy Attorney General, etc.) for Expert Witness. Signed on 2004-07-01. Completion date: 2006-06-30.
Top industries in this zip code by the number of employees in 2005:
Arts, Entertainment, and Recreation: Theater Companies and Dinner Theaters (5-9 employees: 1 establishment)
Real Estate and Rental and Leasing: Nonresidential Property Managers (5-9: 1)
Real Estate and Rental and Leasing: Offices of Real Estate Agents and Brokers (1-4: 3)
Health Care and Social Assistance: Offices of Physicians (except Mental Health Specialists) (1-4: 1)
Construction: Masonry Contractors (1-4: 1)
Professional, Scientific, and Technical Services: Environmental Consulting Services (1-4: 1)
Health Care and Social Assistance: Diagnostic Imaging Centers (1-4: 1)
Educational Services: Educational Support Services (1-4: 1)
Educational Services: Professional and Management Development Training (1-4: 1)
Finance and Insurance: Other Activities Related to Credit Intermediation (1-4: 1)
Home Mortgage Disclosure Act Aggregated Statistics For Year 2009 (Based on 2 partial tracts)
A) FHA, FSA/RHS & VA Home Purchase Loans
B) Conventional Home Purchase Loans
C) Refinancings
F) Non-occupant Loans on < 5 Family Dwellings (A B C & D)
Number
Average Value
Number
Average Value
Number
Average Value
Number
Average Value
LOANS ORIGINATED
1
$200,590
2
$135,445
3
$174,503
1
$63,550
APPLICATIONS APPROVED, NOT ACCEPTED
0
$0
0
$0
0
$0
0
$0
APPLICATIONS DENIED
0
$0
0
$0
1
$188,270
0
$0
APPLICATIONS WITHDRAWN
0
$0
0
$0
1
$110,360
0
$0
FILES CLOSED FOR INCOMPLETENESS
0
$0
0
$0
0
$0
0
$0
Aggregated Statistics For Year 2008 (Based on 2 partial tracts)
A) FHA, FSA/RHS & VA Home Purchase Loans
B) Conventional Home Purchase Loans
C) Refinancings
D) Home Improvement Loans
F) Non-occupant Loans on < 5 Family Dwellings (A B C & D)
Number
Average Value
Number
Average Value
Number
Average Value
Number
Average Value
Number
Average Value
LOANS ORIGINATED
1
$118,100
2
$180,000
2
$159,275
1
$18,470
1
$63,550
APPLICATIONS APPROVED, NOT ACCEPTED
0
$0
0
$0
0
$0
0
$0
0
$0
APPLICATIONS DENIED
0
$0
0
$0
1
$107,910
1
$32,310
0
$0
APPLICATIONS WITHDRAWN
0
$0
0
$0
1
$128,230
0
$0
0
$0
FILES CLOSED FOR INCOMPLETENESS
0
$0
0
$0
0
$0
0
$0
0
$0
Aggregated Statistics For Year 2007 (Based on 2 partial tracts)
A) FHA, FSA/RHS & VA Home Purchase Loans
B) Conventional Home Purchase Loans
C) Refinancings
D) Home Improvement Loans
F) Non-occupant Loans on < 5 Family Dwellings (A B C & D)
Number
Average Value
Number
Average Value
Number
Average Value
Number
Average Value
Number
Average Value
LOANS ORIGINATED
1
$86,850
3
$134,630
2
$133,590
1
$42,770
1
$95,260
APPLICATIONS APPROVED, NOT ACCEPTED
0
$0
0
$0
0
$0
0
$0
0
$0
APPLICATIONS DENIED
0
$0
1
$73,420
2
$133,425
1
$29,920
0
$0
APPLICATIONS WITHDRAWN
0
$0
0
$0
2
$116,245
0
$0
0
$0
FILES CLOSED FOR INCOMPLETENESS
0
$0
0
$0
0
$0
0
$0
0
$0
Aggregated Statistics For Year 2006 (Based on 2 partial tracts)
A) FHA, FSA/RHS & VA Home Purchase Loans
B) Conventional Home Purchase Loans
C) Refinancings
D) Home Improvement Loans
Number
Average Value
Number
Average Value
Number
Average Value
Number
Average Value
LOANS ORIGINATED
1
$72,160
4
$108,238
2
$128,760
0
$0
APPLICATIONS APPROVED, NOT ACCEPTED
0
$0
1
$80,230
0
$0
0
$0
APPLICATIONS DENIED
0
$0
1
$56,530
2
$123,430
1
$45,880
APPLICATIONS WITHDRAWN
0
$0
0
$0
2
$91,420
0
$0
FILES CLOSED FOR INCOMPLETENESS
0
$0
0
$0
0
$0
0
$0
Aggregated Statistics For Year 2005 (Based on 2 partial tracts)
B) Conventional Home Purchase Loans
C) Refinancings
D) Home Improvement Loans
Number
Average Value
Number
Average Value
Number
Average Value
LOANS ORIGINATED
3
$128,073
2
$155,140
1
$27,540
APPLICATIONS APPROVED, NOT ACCEPTED
1
$35,420
1
$41,440
0
$0
APPLICATIONS DENIED
1
$52,700
2
$101,980
1
$12,250
APPLICATIONS WITHDRAWN
0
$0
1
$211,640
0
$0
FILES CLOSED FOR INCOMPLETENESS
0
$0
1
$179,070
0
$0
Aggregated Statistics For Year 2004 (Based on 2 partial tracts)
B) Conventional Home Purchase Loans
C) Refinancings
D) Home Improvement Loans
F) Non-occupant Loans on < 5 Family Dwellings (A B C & D)
Number
Average Value
Number
Average Value
Number
Average Value
Number
Average Value
LOANS ORIGINATED
5
$96,016
4
$113,152
0
$0
1
$117,040
APPLICATIONS APPROVED, NOT ACCEPTED
0
$0
0
$0
0
$0
0
$0
APPLICATIONS DENIED
1
$36,540
2
$122,405
1
$34,160
0
$0
APPLICATIONS WITHDRAWN
0
$0
1
$114,460
0
$0
0
$0
FILES CLOSED FOR INCOMPLETENESS
0
$0
1
$66,070
0
$0
0
$0
Aggregated Statistics For Year 2002 (Based on 2 partial tracts)
B) Conventional Home Purchase Loans
C) Refinancings
Number
Average Value
Number
Average Value
LOANS ORIGINATED
1
$104,330
1
$139,420
APPLICATIONS APPROVED, NOT ACCEPTED
0
$0
0
$0
APPLICATIONS DENIED
0
$0
0
$0
APPLICATIONS WITHDRAWN
0
$0
0
$0
FILES CLOSED FOR INCOMPLETENESS
0
$0
0
$0
Aggregated Statistics For Year 2001 (Based on 2 partial tracts)
B) Conventional Home Purchase Loans
C) Refinancings
Number
Average Value
Number
Average Value
LOANS ORIGINATED
1
$100,360
1
$76,530
APPLICATIONS APPROVED, NOT ACCEPTED
0
$0
0
$0
APPLICATIONS DENIED
0
$0
0
$0
APPLICATIONS WITHDRAWN
0
$0
0
$0
FILES CLOSED FOR INCOMPLETENESS
0
$0
0
$0
Aggregated Statistics For Year 2000 (Based on 2 partial tracts)


+$3,583
-$9,403
 Nearest zip codes: 79364, 79404, 79403, 79412, 79401, 79411.


