Estimated zip code population in 2022: 28,544 Zip code population in 2010: 22,885 Zip code population in 2000: 18,107
Houses and condos: 13,094 Renter-occupied apartments: 5,679
% of renters here:
46%
State:
38%
March 2022 cost of living index in zip code 79606: 83.4 (less than average, U.S. average is 100)
Land area: 62.5 sq. mi. Water area: 0.2 sq. mi.
Population density: 457 people per square mile
(low).
OSM Map
General Map
Google Map
MSN Map
OSM Map
General Map
Google Map
MSN Map
OSM Map
General Map
Google Map
MSN Map
OSM Map
General Map
Google Map
MSN Map
Please wait while loading the map...
Real estate property taxes paid for housing units in 2022:
This zip code:
1.6% ($4,325)
Texas:
1.5% ($4,050)
Median real estate property taxes paid for housing units with mortgages in 2022: $4,591 (1.6%) Median real estate property taxes paid for housing units with no mortgage in 2022: $3,706 (1.4%)
Estimated median house/condo value in 2022: $276,210
79606:
$276,210
Texas:
$275,400
According to our research of Texas and other state lists, there were 39 registered sex offenders living in 79606 zip code as of May 28, 2024. The ratio of all residents to sex offenders in zip code 79606 is 615 to 1. The ratio of registered sex offenders to all residents in this zip code is lower than the state average.
Median resident age:
This zip code:
33.6 years
Texas median age:
35.6 years
Average household size:
This zip code:
2.3 people
Texas:
2.6 people
Averages for the 2020 tax year for zip code 79606, filed in 2021:
Average Adjusted Gross Income (AGI) in 2020: $76,298 (Individual Income Tax Returns)
Here:
$76,298
State:
$77,054
Salary/wage: $59,639 (reported on 83.0% of returns)
Here:
$59,639
State:
$62,766
(% of AGI for various income ranges: 1288.8% for AGIs below $25k, 3445.5% for AGIs $25k-50k, 5764.7% for AGIs $50k-75k, 8843.2% for AGIs $75k-100k, 16554.2% for AGIs $100k-200k, 76166.5% for AGIs over 200k)
Taxable interest for individuals: $1,850 (reported on 28.0% of returns)
This zip code:
$1,850
Texas:
$2,665
(% of AGI for various income ranges: 12.0% for AGIs below $25k, 17.2% for AGIs $25k-50k, 43.2% for AGIs $50k-75k, 92.1% for AGIs $75k-100k, 149.7% for AGIs $100k-200k, 1447.1% for AGIs over 200k)
Ordinary dividends: $11,170 (reported on 19.9% of returns)
Here:
$11,170
State:
$10,044
(% of AGI for various income ranges: 20.9% for AGIs below $25k, 39.1% for AGIs $25k-50k, 107.9% for AGIs $50k-75k, 146.8% for AGIs $75k-100k, 493.2% for AGIs $100k-200k, 10507.6% for AGIs over 200k)
Net capital gain/loss in AGI: +$20,841 (reported on 19.4% of returns)
Here:
+$20,841
State:
+$39,590
(% of AGI for various income ranges: 14.8% for AGIs below $25k, 26.8% for AGIs $25k-50k, 132.0% for AGIs $50k-75k, 174.2% for AGIs $75k-100k, 541.4% for AGIs $100k-200k, 23975.3% for AGIs over 200k)
Profit/loss from business: +$16,128 (reported on 15.5% of returns)
Here:
+$16,128
State:
+$10,888
(% of AGI for various income ranges: 55.8% for AGIs below $25k, 78.0% for AGIs $25k-50k, 153.6% for AGIs $50k-75k, 275.6% for AGIs $75k-100k, 686.0% for AGIs $100k-200k, 8810.0% for AGIs over 200k)
Taxable individual retirement arrangement distribution: $18,989 (reported on 9.1% of returns)
79606:
$18,989
Texas:
$24,740
(% of AGI for various income ranges: 53.4% for AGIs below $25k, 79.5% for AGIs $25k-50k, 198.0% for AGIs $50k-75k, 270.5% for AGIs $75k-100k, 537.6% for AGIs $100k-200k, 3769.4% for AGIs over 200k)
Self-employed (Keogh) retirement plans: $28,867 (reported on 0.5% of returns)
79606:
$28,867
Texas:
$29,298
(% of AGI for various income ranges: 35.3% for AGIs $100k-200k, 761.2% for AGIs over 200k)
Total itemized deductions: $39,924 (reported on 7.3% of returns)
Here:
$39,924
State:
$40,428
(% of AGI for various income ranges: 31.1% for AGIs below $25k, 79.3% for AGIs $25k-50k, 202.0% for AGIs $50k-75k, 423.2% for AGIs $75k-100k, 910.6% for AGIs $100k-200k, 9372.9% for AGIs over 200k)
Charity contributions: $20,084 (reported on 6.1% of returns)
Here:
$20,084
State:
$18,201
(% of AGI for various income ranges: 3.3% for AGIs below $25k, 17.1% for AGIs $25k-50k, 36.7% for AGIs $50k-75k, 103.5% for AGIs $75k-100k, 340.1% for AGIs $100k-200k, 5588.2% for AGIs over 200k)
Taxes paid: $6,788 (reported on 7.1% of returns)
79606:
$6,788
State:
$7,821
(% of AGI for various income ranges: 5.0% for AGIs below $25k, 14.1% for AGIs $25k-50k, 41.1% for AGIs $50k-75k, 76.6% for AGIs $75k-100k, 170.2% for AGIs $100k-200k, 1311.8% for AGIs over 200k)
Earned income credit: $2,206 (reported on 12.8% of returns)
Here:
$2,206
State:
$2,584
(% of AGI for various income ranges: 74.8% for AGIs below $25k, 53.6% for AGIs $25k-50k, 1.5% for AGIs $50k-75k)
Percentage of individuals using paid preparers for their 2020 taxes: 94.8%
Here:
95%
State:
92%
(% for various income ranges: 94.4% for AGIs below $25k, 95.7% for AGIs $25k-50k, 94.6% for AGIs $50k-75k, 93.8% for AGIs $75k-100k, 94.9% for AGIs $100k-200k, 95.1% for AGIs over 200k)
Averages for the 2012 tax year for zip code 79606, filed in 2013:
Average Adjusted Gross Income (AGI) in 2012: $65,022 (Individual Income Tax Returns)
Here:
$65,022
State:
$65,384
Salary/wage: $50,182 (reported on 84.2% of returns)
Here:
$50,182
State:
$52,524
(% of AGI for various income ranges: 81.8% for AGIs below $25k, 78.9% for AGIs $25k-50k, 75.7% for AGIs $50k-75k, 73.4% for AGIs $75k-100k, 69.0% for AGIs $100k-200k, 40.6% for AGIs over 200k)
Taxable interest for individuals: $1,904 (reported on 35.4% of returns)
This zip code:
$1,904
Texas:
$2,372
(% of AGI for various income ranges: 1.2% for AGIs below $25k, 0.7% for AGIs $25k-50k, 0.9% for AGIs $50k-75k, 0.7% for AGIs $75k-100k, 0.8% for AGIs $100k-200k, 1.6% for AGIs over 200k)
Ordinary dividends: $10,128 (reported on 20.5% of returns)
Here:
$10,128
State:
$9,721
(% of AGI for various income ranges: 1.8% for AGIs below $25k, 1.3% for AGIs $25k-50k, 1.3% for AGIs $50k-75k, 1.4% for AGIs $75k-100k, 1.8% for AGIs $100k-200k, 7.7% for AGIs over 200k)
Net capital gain/loss in AGI: +$14,146 (reported on 16.7% of returns)
Here:
+$14,146
State:
+$35,319
(% of AGI for various income ranges: 0.3% for AGIs $25k-50k, 0.3% for AGIs $50k-75k, 0.9% for AGIs $75k-100k, 1.4% for AGIs $100k-200k, 11.2% for AGIs over 200k)
Profit/loss from business: +$18,673 (reported on 16.1% of returns)
Here:
+$18,673
State:
+$13,732
(% of AGI for various income ranges: 3.9% for AGIs below $25k, 2.9% for AGIs $25k-50k, 2.5% for AGIs $50k-75k, 3.1% for AGIs $75k-100k, 4.4% for AGIs $100k-200k, 7.7% for AGIs over 200k)
Taxable individual retirement arrangement distribution: $15,750 (reported on 10.4% of returns)
79606:
$15,750
Texas:
$19,511
(% of AGI for various income ranges: 2.6% for AGIs below $25k, 2.3% for AGIs $25k-50k, 2.1% for AGIs $50k-75k, 2.7% for AGIs $75k-100k, 3.0% for AGIs $100k-200k, 2.3% for AGIs over 200k)
Self-employment retirement plans: $21,111 (reported on 0.8% of returns)
79606:
$21,111
Texas:
$23,938
Total itemized deductions: $23,446 (17% of AGI, reported on 25.0% of returns)
Here:
$23,446
State:
$24,724
Here:
17.2% of AGI
State:
15.9% of AGI
(% of AGI for various income ranges: 6.0% for AGIs below $25k, 7.1% for AGIs $25k-50k, 8.2% for AGIs $50k-75k, 9.6% for AGIs $75k-100k, 10.1% for AGIs $100k-200k, 9.8% for AGIs over 200k)
Charity contributions: $7,955 (reported on 19.9% of returns)
Here:
$7,955
State:
$6,808
(% of AGI for various income ranges: 0.7% for AGIs below $25k, 1.2% for AGIs $25k-50k, 1.5% for AGIs $50k-75k, 2.3% for AGIs $75k-100k, 3.0% for AGIs $100k-200k, 3.6% for AGIs over 200k)
Taxes paid: $5,605 (reported on 24.5% of returns)
79606:
$5,605
State:
$6,921
(% of AGI for various income ranges: 1.1% for AGIs below $25k, 1.5% for AGIs $25k-50k, 2.1% for AGIs $50k-75k, 2.2% for AGIs $75k-100k, 2.8% for AGIs $100k-200k, 2.0% for AGIs over 200k)
Earned income credit: $2,118 (reported on 15.1% of returns)
Here:
$2,118
State:
$2,570
(% of AGI for various income ranges: 5.0% for AGIs below $25k, 1.1% for AGIs $25k-50k)
Percentage of individuals using paid preparers for their 2012 taxes: 48.9%
Here:
49%
State:
51%
(% for various income ranges: 42.9% for AGIs below $25k, 44.7% for AGIs $25k-50k, 50.0% for AGIs $50k-75k, 51.7% for AGIs $75k-100k, 59.4% for AGIs $100k-200k, 85.4% for AGIs over 200k)
Averages for the 2004 tax year for zip code 79606, filed in 2005:
Average Adjusted Gross Income (AGI) in 2004: $49,198 (Individual Income Tax Returns)
Here:
$49,198
State:
$47,881
Salary/wage: $42,244 (reported on 84.9% of returns)
Here:
$42,244
State:
$41,947
(% of AGI for various income ranges: 140.4% for AGIs below $10k, 81.8% for AGIs $10k-25k, 80.7% for AGIs $25k-50k, 78.7% for AGIs $50k-75k, 77.2% for AGIs $75k-100k, 60.2% for AGIs over 100k)
Taxable interest for individuals: $2,183 (reported on 46.9% of returns)
This zip code:
$2,183
Texas:
$2,255
(% of AGI for various income ranges: 11.9% for AGIs below $10k, 2.5% for AGIs $10k-25k, 1.9% for AGIs $25k-50k, 1.4% for AGIs $50k-75k, 1.7% for AGIs $75k-100k, 2.4% for AGIs over 100k)
Taxable dividends: $3,278 (reported on 25.4% of returns)
Here:
$3,278
State:
$4,261
(% of AGI for various income ranges: 6.8% for AGIs below $10k, 1.3% for AGIs $10k-25k, 1.0% for AGIs $25k-50k, 1.0% for AGIs $50k-75k, 1.3% for AGIs $75k-100k, 2.6% for AGIs over 100k)
Net capital gain/loss: +$4,605 (reported on 21.3% of returns)
Here:
+$4,605
State:
+$16,110
(% of AGI for various income ranges: -3.3% for AGIs below $10k, -0.4% for AGIs $10k-25k, 0.5% for AGIs $25k-50k, 0.5% for AGIs $50k-75k, 1.4% for AGIs $75k-100k, 4.5% for AGIs over 100k)
Profit/loss from business: +$17,562 (reported on 15.1% of returns)
Here:
+$17,562
State:
+$11,013
(% of AGI for various income ranges: 2.3% for AGIs below $10k, 2.5% for AGIs $10k-25k, 2.6% for AGIs $25k-50k, 2.7% for AGIs $50k-75k, 3.1% for AGIs $75k-100k, 10.0% for AGIs over 100k)
IRA payment deduction: $3,107 (reported on 3.0% of returns)
79606:
$3,107
Texas:
$3,120
(% of AGI for various income ranges: 0.2% for AGIs $10k-25k, 0.3% for AGIs $25k-50k, 0.2% for AGIs $50k-75k, 0.2% for AGIs $75k-100k, 0.1% for AGIs over 100k)
Self-employed pension: $14,947 (reported on 1.2% of returns)
Here:
$14,947
Texas:
$16,401
(% of AGI for various income ranges: 0.2% for AGIs $50k-75k, 0.2% for AGIs $75k-100k, 0.8% for AGIs over 100k)
Total itemized deductions: $17,333 (19% of AGI, reported on 28.0% of returns)
Here:
$17,333
State:
$19,631
Here:
19.0% of AGI
State:
18.9% of AGI
(% of AGI for various income ranges: 19.1% for AGIs below $10k, 6.7% for AGIs $10k-25k, 8.9% for AGIs $25k-50k, 10.6% for AGIs $50k-75k, 12.1% for AGIs $75k-100k, 9.5% for AGIs over 100k)
Charity contributions deductions: $5,321 (6% of AGI, reported on 24.5% of returns)
Here:
$5,321
State:
$4,753
Here:
5.5% of AGI
State:
4.2% of AGI
(% of AGI for various income ranges: 1.2% for AGIs below $10k, 1.0% for AGIs $10k-25k, 1.6% for AGIs $25k-50k, 2.4% for AGIs $50k-75k, 3.2% for AGIs $75k-100k, 3.5% for AGIs over 100k)
Total tax: $8,055 (reported on 76.2% of returns)
79606:
$8,055
State:
$9,058
(% of AGI for various income ranges: 4.0% for AGIs below $10k, 4.0% for AGIs $10k-25k, 6.2% for AGIs $25k-50k, 8.4% for AGIs $50k-75k, 10.6% for AGIs $75k-100k, 20.8% for AGIs over 100k)
Earned income credit: $1,715 (reported on 12.9% of returns)
Here:
$1,715
State:
$2,024
Percentage of individuals using paid preparers for their 2004 taxes: 58.7%
Here:
59%
State:
57%
(% for various income ranges: 52.3% for AGIs below $10k, 61.6% for AGIs $10k-25k, 59.0% for AGIs $25k-50k, 56.0% for AGIs $50k-75k, 57.6% for AGIs $75k-100k, 67.4% for AGIs over 100k)
Likely homosexual households (counted as self-reported same-sex unmarried-partner households)
Lesbian couples: 0.1% of all households
Gay men: 0.0% of all households
Household received Food Stamps/SNAP in the past 12 months: 918 Household did not receive Food Stamps/SNAP in the past 12 months: 11,408
Women who had a birth in the past 12 months: 505 (196 now married, 300 unmarried) Women who did not have a birth in the past 12 months: 6,629 (3,069 now married, 3,554 unmarried)
Housing units in zip code 79606 with a mortgage: 4,215 (151 second mortgage, 36 home equity loan, 121 both second mortgage and home equity loan) Houses without a mortgage: 109
Median monthly owner costs for units with a mortgage: $1,803 Median monthly owner costs for units without a mortgage: $752
Residents with income below the poverty level in 2022:
This zip code:
7.9%
Whole state:
14.0%
Residents with income below 50% of the poverty level in 2022:
This zip code:
4.4%
Whole state:
7.4%
Median number of rooms in houses and condos:
Here:
6.7
State:
6.3
Median number of rooms in apartments:
Here:
3.9
State:
4.0
Notable locations in this zip code not listed on our city pages
Notable locations in zip code 79606: Lake Abilene Filter Plant (A), Abilene Fire Department Station 8 (B), View Volunteer Fire Department (C). Display/hide their locations on the map
Churches in zip code 79606 include: Holy Family Catholic Church (A), Wyndrock Baptist Church (B), Ridgemont Baptist Church (C), Beltway Park Baptist Church (D), Oakridge Church of Christ (E), Church of Christ - Wylie (F), Wylie United Methodist Church (G). Display/hide their locations on the map
4,503 married couples with children.
1,720 single-parent households (616 men, 1,104 women).
86.9% of residents of 79606 zip code speak English at home.
8.6% of residents speak Spanish at home (89% very well, 8% well, 2% not well, 2% not at all).
1.9% of residents speak other Indo-European language at home (76% very well, 24% well).
2.2% of residents speak Asian or Pacific Island language at home (66% very well, 30% well, 4% not well).
0.6% of residents speak other language at home (57% very well, 38% well, 2% not well, 3% not at all).
Foreign born population: 2,142 (7.5%) (48.6% of them are naturalized citizens)
Facilities with environmental interests located in this zip code:
ABILENE REGIONAL MEDICAL CENTER (6250 US HIGHWAY 83 AT ANTIL in ABILENE, TX)
(Resource Conservation and Recovery Act (tracking hazardous waste)) Alternative names: HUMANA HOSPITAL ABILENE
ABILENE TIRE & SERVICE (5190 BUFFALO GAP ROAD in ABILENE, TX)
AIR MINOR (AIRS/AFS) Business SIC classification: GENERAL AUTOMOTIVE REPAIR SHOPS
AFCO NO 10103 (4580 BUFFALO GAP RD in ABILENE, TX)
Conditionally Exempt Small Quantity Generators, less than 100 kg/month of hazardous waste (Resource Conservation and Recovery Act (tracking hazardous waste)) - notification Organizations: MICOR ENERGY LLC DBA AFCO (CONTACT/OWNER)
Housing units lacking complete plumbing facilities: 0.5% Housing units lacking complete kitchen facilities: 0.9%
70.4%Electricity
27.4%Utility gas
1.1%Bottled, tank, or LP gas
0.5%Other fuel
Population in 1990: 17,332. Population change in the 1990s: +775 (+4.5%).
Place of birth for U.S.-born residents:
This state: 17,564
Northeast: 1,137
Midwest: 1,715
South: 3,013
West: 2,587
42% of the 79606 zip code residents lived in the same house 5 years ago. Out of people who lived in different houses, 42% lived in this county. Out of people who lived in different counties, 50% lived in Texas.
85% of the 79606 zip code residents lived in the same house 1 year ago. Out of people who lived in different houses, 53% moved from this county. Out of people who lived in different houses, 20% moved from different county within same state. Out of people who lived in different houses, 22% moved from different state. Out of people who lived in different houses, 5% moved from abroad.
Private vs. public school enrollment:
Students in private schools in grades 1 to 8 (elementary and middle school): 289
Here:
9.8%
Texas:
8.8%
Students in private schools in grades 9 to 12 (high school): 105
Here:
6.8%
Texas:
8.0%
Students in private undergraduate colleges: 714
Here:
47.8%
Texas:
16.2%
Occupation by median earnings in the past 12 months ($)
77,320Management occupations
72,326Health diagnosing and treating practitioners and other technical occupations
69,566Computer and mathematical occupations
65,473Installation, maintenance, and repair occupations
62,815Life, physical, and social science occupations
60,432Architecture and engineering occupations
Companies with biggest federal contracts located in this zip code (ABILENE, TX):
HAWKINS BUILDERS, INC (2 VILLAGE DRIVE, STE 210; small business) : $19,721,485 in 47 contractsfrom 1999 to 2006
Contracts for Maintenance, Repair or Alteration of Real Property -- Airport Runways, Maintenance, Repair or Alteration of Real Property -- Highways, Roads, Streets, Bridges, and Railways (includes resurfacing), Maintenance, Repair or Alteration of Real Property -- Airport Service Roads, Maintenance, Repair or Alteration of Real Property -- Other Industrial Buildings, and moreby Air Force Signed by year:2000: $4,181,319; 2001: $4,337,555; 2002: $2,003,911; 2003: $4,802,106; 2004: $2,204,380; 2005: $1,645,599; 2006: $549,999.
Biggest contracts:
$2,300,000 with Air Force for Maintenance, Repair or Alteration of Real Property -- Airport Runways. Signed on 2001-04-11. Completion date: 2001-05-21.
$2,039,388 with Air Force for Maintenance, Repair or Alteration of Real Property -- Highways, Roads, Streets, Bridges, and Railways (includes resurfacing). Signed on 2003-08-20. Completion date: 2003-08-20.
$1,724,400 with Air Force for Maintenance, Repair or Alteration of Real Property -- Airport Runways. Signed on 2001-09-30. Completion date: 2001-09-30.
$1,100,000 with Air Force for Maintenance, Repair or Alteration of Real Property -- Airport Service Roads. Signed on 2000-09-29. Completion date: 2000-11-06.
WTA INC (ONE VILLAGE DRIVE, SUITE 5; small business) : $559,395 in 17 contractsfrom 2000 to 2004
Contracts for Other Architect and Engineering Services, Architect - Engineer Services (including landscaping, interior layout, and designing), Industrial Buildings, Construction of Structures and Facilities -- Other Airfield Structures by Air Force Signed by year:2000: $309,807; 2001: -$3,394; 2002: $33,136; 2003: $0; 2004: $219,846; 2005: $0; 2006: $0.
Biggest contracts:
$219,846 with Air Force for Other Architect and Engineering Services. Signed on 2004-01-28. Completion date: 2004-06-30.
$125,836, same as above.Signed on 2000-08-14. Completion date: 2001-05-31.
$72,146, same as above.Signed on 2000-09-19. Completion date: 2001-05-15.
$52,197, same as above.Signed on 2002-09-13. Completion date: 2003-04-15.
MICHAEL R. ROCHIN (23 AUGUSTA DRIVE; small business) : $478,527 in 8 contractsfrom 1999 to 2004
Contracts for Anesthesiology Services, Other Medical Services, Medical and Surgical Instruments, Equipment, and Supplies by Army Signed by year:2000: $285,360; 2001: $44,160; 2002: $11,800; 2003: $0; 2004: -$3,593; 2005: $0; 2006: $0.
Biggest contracts:
$144,560 with Army for Anesthesiology Services. Signed on 2000-10-25. Completion date: 2001-09-30.
$140,800, same as above.Signed on 2000-04-28. Completion date: 2000-09-30.
$140,800 with Army for Other Medical Services. Signed on 1999-10-01. Completion date: 2000-09-30.
$110,880 with Army for Anesthesiology Services. Signed on 2001-10-31. Completion date: 2002-09-30.
WTA INC (ONE VILLAGE DRIVE, SUITE 5; small business) : $389,598 in 5 contractsfrom 2005 to 2006
Contracts for Other Architect and Engineering Services, Hospital Buildings by Air Force, Department of Veterans Affairs Signed by year:2000: $0; 2001: $0; 2002: $0; 2003: $0; 2004: $0; 2005: $120,434; 2006: $269,164.
Biggest contracts:
$160,664 with Air Force for Other Architect and Engineering Services. Signed on 2006-06-19. Completion date: 2006-12-15.
$108,500, same as above.Signed on 2006-04-25. Completion date: 2006-12-15.
$73,760, same as above.Signed on 2005-08-29. Completion date: 2006-03-15.
$46,674 with Department of Veterans Affairs for Hospital Buildings. Signed on 2005-05-16. Completion date: 2005-08-31.
ORISON CORPORATION (17 WINDMILL CIRCLE; small business) : $265,620 in 14 contractsfrom 2003 to 2006
Contracts for Miscellaneous Chemical Specialties, Food Cooking, Baking, and Serving Equipment by Navy, Air Force, Defense Logistics Agency, Army, and others Signed by year:2000: $0; 2001: $0; 2002: $0; 2003: $43,819; 2004: $72,247; 2005: $138,246; 2006: $11,308.
Biggest contracts:
$57,000 with Navy for Miscellaneous Chemical Specialties. Signed on 2005-01-25. Completion date: 2005-03-31.
$41,280 with Air Force for Miscellaneous Chemical Specialties. Taking place in MD. Signed on 2005-11-02. Completion date: 2006-09-30.
$32,749 with Defense Logistics Agency for Miscellaneous Chemical Specialties. Signed on 2003-10-15. Completion date: 2003-11-14.
$25,472, same as above.Signed on 2004-01-15. Completion date: 2004-01-29.
ATLANTIS POOL PLASTERING INC (8225 BUFFALO GAP RD; small business) : $140,627 in 4 contractsfrom 2001 to 2003
$89,627 with Air Force for Maintenance, Repair or Alteration of Real Property -- Recreation Facilities (Non-Building). Signed on 2003-04-01. Completion date: 2003-05-16.
$53,000, same as above.Signed on 2001-04-26. Completion date: 2001-05-18.
$5,000, same as above.Signed on 2003-04-24. Completion date: 2003-04-30.
-$7,000, same as above.Signed on 2001-05-14. Completion date: 2001-05-14.
ORISON MARKETING, L L C (17 WINDMILL CIRCLE; small business) : $122,468 in 17 contractsfrom 2003 to 2006
Contracts for Chemicals, Miscellaneous Maintenance and Repair Shop Specialized Equipment, Cleaning and Polishing Compounds and Preparations, Hardware, Commercial, and moreby Army, Bureau of Reclamation, Defense Logistics Agency, Transportation Security Administration, and others Signed by year:2000: $0; 2001: $0; 2002: $0; 2003: $20,164; 2004: $5,614; 2005: $71,597; 2006: $25,093.
Biggest contracts:
$29,565 with Army for Chemicals. Signed on 2005-07-15. Completion date: 2005-07-29.
$16,447, same as above.Signed on 2005-02-09. Completion date: 2005-02-17.
$16,447, same as above.Signed on 2005-07-27. Completion date: 2005-08-01.
$13,740 with Army for Miscellaneous Maintenance and Repair Shop Specialized Equipment. Signed on 2003-02-06. Completion date: 2003-02-14.
ABILENE UMPIRES ASSOCIATION (1818 MOONLIGHT DR; small business) : $70,766 in 5 contractsfrom 2004 to 2005
Contracts for Other Social Services, Other Professional Services by Air Force Signed by year:2000: $0; 2001: $0; 2002: $0; 2003: $0; 2004: $31,432; 2005: $39,334; 2006: $0.
Biggest contracts:
$31,432 with Air Force for Other Social Services. Signed on 2004-10-01. Completion date: 2005-03-31.
$22,948 with Air Force for Other Professional Services. Signed on 2005-04-05. Completion date: 2005-08-31.
$22,630 with Air Force for Other Social Services. Signed on 2005-10-01. Completion date: 2006-09-30.
$3,120, same as above.Signed on 2005-09-01. Completion date: 2005-09-30.
WST TEXAS LANDSCAPE, INC (4404 SOUTH CLACK STREET; small business)
$52,430 with Air Force for Maintenance, Repair or Alteration of Real Property -- Other Administrative Facilities and Service Buildings. Signed on 2000-08-23. Completion date: 2000-11-30.
J LANDERS SALES COMPANY (31 WINDMILL CIRCLE SUITE D)
$28,141 with Air Force for Office Furniture. Signed on 2001-04-18. Completion date: 2001-05-07.
Top industries in this zip code by the number of employees in 2005:
Health Care and Social Assistance: Services for the Elderly and Persons with Disabilities (over 1000 employees: 1 establishment, 1-4 employees: 1 establishment)
Health Care and Social Assistance: General Medical and Surgical Hospitals (500-999: 1)
Health Care and Social Assistance: Offices of Physicians (except Mental Health Specialists) (250-499: 1, 50-99: 1, 20-49: 5, 10-19: 4, 5-9: 5, 1-4: 17)
Administrative and Support and Waste Management and Remediation Services: Professional Employer Organizations (250-499: 1, 50-99: 1, 10-19: 1)
People in group quarters in 2010:
197 people in nursing facilities/skilled-nursing facilities
39 people in group homes intended for adults
4 people in residential treatment centers for adults
People in group quarters in 2000:
123 people in nursing homes
25 people in homes for the mentally retarded
4 people in religious group quarters
Fatal accident statistics in 2014:
Fatal accident count: 3
Vehicles involved in fatal accidents: 7
Fatal accidents caused by drunken drivers: 1
Fatalities: 3
Persons involved in fatal accidents: 9
Pedestrians involved in fatal accidents: 0
Fatal accident statistics in 2013:
Fatal accident count: 1
Vehicles involved in fatal accidents: 2
Fatal accidents caused by drunken drivers: 0
Fatalities: 1
Persons involved in fatal accidents: 6
Pedestrians involved in fatal accidents: 0
Home Mortgage Disclosure Act Aggregated Statistics For Year 2009 (Based on 2 full and 6 partial tracts)
A) FHA, FSA/RHS & VA Home Purchase Loans
B) Conventional Home Purchase Loans
C) Refinancings
D) Home Improvement Loans
F) Non-occupant Loans on < 5 Family Dwellings (A B C & D)
G) Loans On Manufactured Home Dwelling (A B C & D)
Number
Average Value
Number
Average Value
Number
Average Value
Number
Average Value
Number
Average Value
Number
Average Value
LOANS ORIGINATED
357
$148,535
233
$159,817
496
$150,631
77
$47,409
68
$131,695
1
$28,710
APPLICATIONS APPROVED, NOT ACCEPTED
6
$137,183
4
$130,752
35
$152,754
6
$49,725
3
$150,590
0
$0
APPLICATIONS DENIED
15
$107,350
17
$93,720
118
$135,966
23
$22,489
14
$94,061
5
$41,068
APPLICATIONS WITHDRAWN
17
$140,964
13
$201,842
97
$130,252
4
$37,005
6
$121,295
0
$0
FILES CLOSED FOR INCOMPLETENESS
4
$184,785
3
$116,197
9
$141,961
0
$0
0
$0
0
$0
Aggregated Statistics For Year 2008 (Based on 2 full and 6 partial tracts)
A) FHA, FSA/RHS & VA Home Purchase Loans
B) Conventional Home Purchase Loans
C) Refinancings
D) Home Improvement Loans
E) Loans on Dwellings For 5+ Families
F) Non-occupant Loans on < 5 Family Dwellings (A B C & D)
G) Loans On Manufactured Home Dwelling (A B C & D)
Number
Average Value
Number
Average Value
Number
Average Value
Number
Average Value
Number
Average Value
Number
Average Value
Number
Average Value
LOANS ORIGINATED
308
$140,512
309
$144,788
163
$125,797
115
$38,912
3
$2,916,693
50
$93,247
0
$0
APPLICATIONS APPROVED, NOT ACCEPTED
6
$126,265
13
$123,236
32
$116,721
14
$34,097
0
$0
2
$118,165
3
$56,637
APPLICATIONS DENIED
15
$135,699
52
$118,017
95
$124,262
60
$25,258
0
$0
17
$93,392
19
$60,611
APPLICATIONS WITHDRAWN
45
$148,768
23
$163,044
56
$119,026
16
$49,109
2
$7,587,095
9
$97,241
0
$0
FILES CLOSED FOR INCOMPLETENESS
7
$137,593
5
$30,832
10
$94,933
5
$18,714
0
$0
0
$0
0
$0
Aggregated Statistics For Year 2007 (Based on 2 full and 6 partial tracts)
A) FHA, FSA/RHS & VA Home Purchase Loans
B) Conventional Home Purchase Loans
C) Refinancings
D) Home Improvement Loans
E) Loans on Dwellings For 5+ Families
F) Non-occupant Loans on < 5 Family Dwellings (A B C & D)
G) Loans On Manufactured Home Dwelling (A B C & D)
Number
Average Value
Number
Average Value
Number
Average Value
Number
Average Value
Number
Average Value
Number
Average Value
Number
Average Value
LOANS ORIGINATED
243
$143,291
521
$130,442
201
$130,669
119
$30,176
4
$6,620,665
86
$102,004
7
$67,761
APPLICATIONS APPROVED, NOT ACCEPTED
9
$142,334
47
$95,073
27
$118,360
21
$46,610
0
$0
14
$80,323
9
$82,944
APPLICATIONS DENIED
5
$122,800
65
$111,174
161
$127,373
84
$18,529
0
$0
28
$90,281
19
$56,384
APPLICATIONS WITHDRAWN
11
$165,030
25
$129,606
115
$117,261
15
$27,785
0
$0
10
$65,475
0
$0
FILES CLOSED FOR INCOMPLETENESS
3
$119,317
9
$153,548
21
$134,612
4
$9,295
0
$0
0
$0
0
$0
Aggregated Statistics For Year 2006 (Based on 2 full and 6 partial tracts)
A) FHA, FSA/RHS & VA Home Purchase Loans
B) Conventional Home Purchase Loans
C) Refinancings
D) Home Improvement Loans
E) Loans on Dwellings For 5+ Families
F) Non-occupant Loans on < 5 Family Dwellings (A B C & D)
G) Loans On Manufactured Home Dwelling (A B C & D)
Number
Average Value
Number
Average Value
Number
Average Value
Number
Average Value
Number
Average Value
Number
Average Value
Number
Average Value
LOANS ORIGINATED
317
$137,029
567
$109,531
247
$108,397
102
$33,731
1
$2,631,860
93
$93,527
12
$49,394
APPLICATIONS APPROVED, NOT ACCEPTED
1
$203,710
55
$114,475
18
$140,132
10
$25,615
0
$0
8
$119,105
8
$66,859
APPLICATIONS DENIED
7
$168,786
102
$159,660
151
$122,718
93
$26,976
0
$0
24
$200,419
20
$64,111
APPLICATIONS WITHDRAWN
21
$101,634
61
$117,828
164
$100,147
13
$50,772
0
$0
12
$144,133
0
$0
FILES CLOSED FOR INCOMPLETENESS
0
$0
11
$107,195
50
$105,337
4
$82,920
0
$0
3
$128,610
0
$0
Aggregated Statistics For Year 2005 (Based on 2 full and 6 partial tracts)
A) FHA, FSA/RHS & VA Home Purchase Loans
B) Conventional Home Purchase Loans
C) Refinancings
D) Home Improvement Loans
E) Loans on Dwellings For 5+ Families
F) Non-occupant Loans on < 5 Family Dwellings (A B C & D)
G) Loans On Manufactured Home Dwelling (A B C & D)
Number
Average Value
Number
Average Value
Number
Average Value
Number
Average Value
Number
Average Value
Number
Average Value
Number
Average Value
LOANS ORIGINATED
306
$125,661
616
$92,281
249
$95,605
68
$32,440
1
$185,770
81
$66,932
4
$24,930
APPLICATIONS APPROVED, NOT ACCEPTED
11
$98,106
59
$76,353
55
$99,589
14
$89,554
0
$0
2
$64,005
9
$43,220
APPLICATIONS DENIED
17
$131,983
114
$84,679
263
$90,304
61
$36,011
0
$0
16
$100,086
14
$42,926
APPLICATIONS WITHDRAWN
9
$113,910
51
$101,123
145
$104,377
45
$172,384
0
$0
9
$81,547
0
$0
FILES CLOSED FOR INCOMPLETENESS
2
$238,755
14
$75,165
70
$96,455
3
$71,990
0
$0
3
$61,633
0
$0
Aggregated Statistics For Year 2004 (Based on 2 full and 6 partial tracts)
A) FHA, FSA/RHS & VA Home Purchase Loans
B) Conventional Home Purchase Loans
C) Refinancings
D) Home Improvement Loans
E) Loans on Dwellings For 5+ Families
F) Non-occupant Loans on < 5 Family Dwellings (A B C & D)
G) Loans On Manufactured Home Dwelling (A B C & D)
2002 - 2018 National Fire Incident Reporting System (NFIRS) incidents
According to the data from the years 2002 - 2018 the average number of fires per year is 72. The highest number of fires - 107 took place in 2005, and the least - 40 in 2013. The data has an increasing trend.
When looking into fire subcategories, the most reports belonged to: Outside Fires (54.4%), and Structure Fires (30.7%).
Fire incident types reported to NFIRS in Zip Code 79606

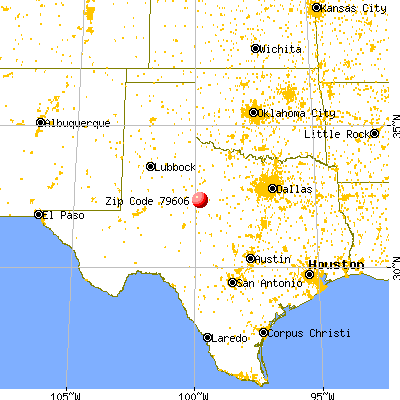


 Nearest zip codes: 79607, 79605, 79508, 79563, 79603, 79562.


 According to the data from the years 2002 - 2018 the average number of fires per year is 72. The highest number of fires - 107 took place in 2005, and the least - 40 in 2013. The data has an increasing trend.
 When looking into fire subcategories, the most reports belonged to: Outside Fires (54.4%), and Structure Fires (30.7%).