Estimated zip code population in 2022: 13,554 Zip code population in 2010: 13,208 Zip code population in 2000: 10,939
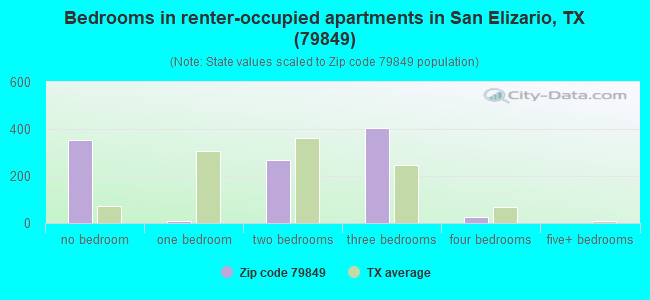
Houses and condos: 4,550 Renter-occupied apartments: 1,229
% of renters here:
30%
State:
38%
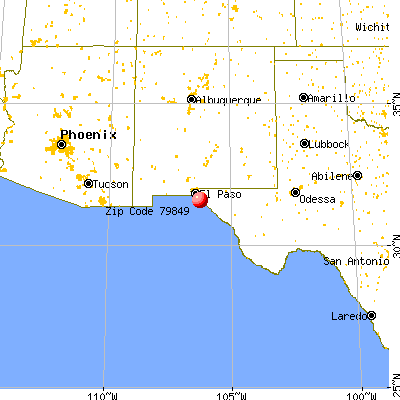
March 2022 cost of living index in zip code 79849: 80.9 (low, U.S. average is 100)
Land area: 14.0 sq. mi. Water area: 0.1 sq. mi.
Population density: 967 people per square mile
(low).
OSM Map
General Map
Google Map
MSN Map
OSM Map
General Map
Google Map
MSN Map
OSM Map
General Map
Google Map
MSN Map
OSM Map
General Map
Google Map
MSN Map
Please wait while loading the map...
Real estate property taxes paid for housing units in 2022:
This zip code:
1.3% ($1,432)
Texas:
1.5% ($4,050)
Median real estate property taxes paid for housing units with mortgages in 2022: $2,282 (2.2%) Median real estate property taxes paid for housing units with no mortgage in 2022: $1,372 (1.3%)
Business Search- 14 Million verified businesses
Males: 7,105
(52.4%)
Females: 6,449
(47.6%)
For population 25 years and over in 79849:
High school or higher: 62.0%
Bachelor's degree or higher: 7.1%
Graduate or professional degree: 1.3%
Unemployed: 3.8%
Mean travel time to work (commute): 35.6 minutes
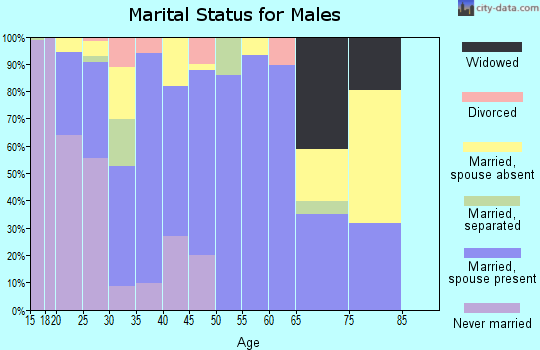
For population 15 years and over in 79849:
Never married: 36.2%
Now married: 45.9%
Separated: 4.0%
Widowed: 6.5%
Divorced: 7.4%
Zip code 79849 compared to state average:
Median household income below state average.
Median house value significantly below state average.
Black race population percentage significantly below state average.
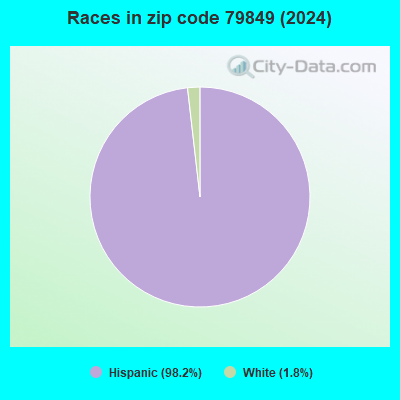
Hispanic race population percentage above state average.
Median age below state average.
Foreign-born population percentage above state average.
Length of stay since moving in significantly above state average.
House age below state average.
Percentage of population with a bachelor's degree or higher significantly below state average.
Estimated median house/condo value in 2022: $106,110
79849:
$106,110
Texas:
$275,400
According to our research of Texas and other state lists, there were 29 registered sex offenders living in 79849 zip code as of May 28, 2024. The ratio of all residents to sex offenders in zip code 79849 is 436 to 1. The ratio of registered sex offenders to all residents in this zip code is near the state average.
Median resident age:
This zip code:
28.5 years
Texas median age:
35.6 years
Average household size:
This zip code:
3.3 people
Texas:
2.6 people
Averages for the 2020 tax year for zip code 79849, filed in 2021:
Average Adjusted Gross Income (AGI) in 2020: $28,831 (Individual Income Tax Returns)
Here:
$28,831
State:
$77,054
Salary/wage: $27,897 (reported on 84.1% of returns)
Here:
$27,897
State:
$62,766
(% of AGI for various income ranges: 1093.7% for AGIs below $25k, 3312.7% for AGIs $25k-50k, 6426.7% for AGIs $50k-75k, 9820.0% for AGIs $75k-100k, 15133.3% for AGIs $100k-200k)
Taxable interest for individuals: $211 (reported on 6.3% of returns)
This zip code:
$211
Texas:
$2,665
(% of AGI for various income ranges: 0.8% for AGIs below $25k, 0.8% for AGIs $25k-50k, 6.3% for AGIs $50k-75k, 2.7% for AGIs $75k-100k, 11.1% for AGIs $100k-200k)
Ordinary dividends: $80 (reported on 0.8% of returns)
Here:
$80
State:
$10,044
(% of AGI for various income ranges: 0.8% for AGIs $50k-75k)
Net capital gain/loss in AGI: +$712 (reported on 1.3% of returns)
Here:
+$712
State:
+$39,590
(% of AGI for various income ranges: 3.6% for AGIs $25k-50k)
Profit/loss from business: +$10,506 (reported on 23.2% of returns)
Here:
+$10,506
State:
+$10,888
(% of AGI for various income ranges: 320.8% for AGIs below $25k, 255.4% for AGIs $25k-50k, 144.1% for AGIs $50k-75k, 656.4% for AGIs $75k-100k)
Taxable individual retirement arrangement distribution: $7,650 (reported on 0.7% of returns)
79849:
$7,650
Texas:
$24,740
(% of AGI for various income ranges: 19.4% for AGIs $25k-50k)
Total itemized deductions: $29,383 (reported on 1.0% of returns)
Here:
$29,383
State:
$40,428
(% of AGI for various income ranges: 345.7% for AGIs $50k-75k)
Charity contributions: $7,850 (reported on 0.7% of returns)
Here:
$7,850
State:
$18,201
(% of AGI for various income ranges: 61.6% for AGIs $50k-75k)
Taxes paid: $7,680 (reported on 0.8% of returns)
79849:
$7,680
State:
$7,821
(% of AGI for various income ranges: 75.3% for AGIs $50k-75k)
Earned income credit: $3,051 (reported on 46.2% of returns)
Here:
$3,051
State:
$2,584
(% of AGI for various income ranges: 217.1% for AGIs below $25k, 143.2% for AGIs $25k-50k, 4.5% for AGIs $50k-75k)
Percentage of individuals using paid preparers for their 2020 taxes: 91.5%
Here:
91%
State:
92%
(% for various income ranges: 91.2% for AGIs below $25k, 92.2% for AGIs $25k-50k, 91.9% for AGIs $50k-75k, 86.7% for AGIs $75k-100k, 91.7% for AGIs $100k-200k)
Averages for the 2012 tax year for zip code 79849, filed in 2013:
Average Adjusted Gross Income (AGI) in 2012: $23,236 (Individual Income Tax Returns)
Here:
$23,236
State:
$65,384
Salary/wage: $22,676 (reported on 86.1% of returns)
Here:
$22,676
State:
$52,524
(% of AGI for various income ranges: 74.3% for AGIs below $25k, 90.9% for AGIs $25k-50k, 91.2% for AGIs $50k-75k, 89.0% for AGIs $75k-100k, 86.8% for AGIs $100k-200k)
Taxable interest for individuals: $180 (reported on 3.9% of returns)
This zip code:
$180
Texas:
$2,372
(% of AGI for various income ranges: )
Ordinary dividends: $67 (reported on 0.6% of returns)
Here:
$67
State:
$9,721
Profit/loss from business: +$9,949 (reported on 24.2% of returns)
Here:
+$9,949
State:
+$13,732
(% of AGI for various income ranges: 21.2% for AGIs below $25k, 4.0% for AGIs $25k-50k, 2.6% for AGIs $50k-75k)
Taxable individual retirement arrangement distribution: $5,400 (reported on 1.0% of returns)
79849:
$5,400
Texas:
$19,511
Total itemized deductions: $17,590 (33% of AGI, reported on 5.7% of returns)
Here:
$17,590
State:
$24,724
Here:
32.7% of AGI
State:
15.9% of AGI
(% of AGI for various income ranges: 0.7% for AGIs below $25k, 5.1% for AGIs $25k-50k, 7.8% for AGIs $50k-75k, 17.2% for AGIs $75k-100k)
Charity contributions: $1,857 (reported on 2.8% of returns)
Here:
$1,857
State:
$6,808
(% of AGI for various income ranges: 0.3% for AGIs $25k-50k, 0.3% for AGIs $50k-75k, 1.2% for AGIs $75k-100k)
Taxes paid: $2,879 (reported on 5.7% of returns)
79849:
$2,879
State:
$6,921
(% of AGI for various income ranges: 0.1% for AGIs below $25k, 0.8% for AGIs $25k-50k, 1.2% for AGIs $50k-75k, 3.4% for AGIs $75k-100k)
Earned income credit: $3,227 (reported on 61.1% of returns)
Here:
$3,227
State:
$2,570
(% of AGI for various income ranges: 17.6% for AGIs below $25k, 3.9% for AGIs $25k-50k)
Percentage of individuals using paid preparers for their 2012 taxes: 74.1%
Here:
74%
State:
51%
(% for various income ranges: 74.4% for AGIs below $25k, 74.4% for AGIs $25k-50k, 69.0% for AGIs $50k-75k, 77.8% for AGIs $75k-100k, 66.7% for AGIs $100k-200k)
Averages for the 2004 tax year for zip code 79849, filed in 2005:
Average Adjusted Gross Income (AGI) in 2004: $16,882 (Individual Income Tax Returns)
Here:
$16,882
State:
$47,881
Salary/wage: $16,818 (reported on 87.2% of returns)
Here:
$16,818
State:
$41,947
(% of AGI for various income ranges: 73.8% for AGIs below $10k, 85.0% for AGIs $10k-25k, 95.2% for AGIs $25k-50k, 93.4% for AGIs $50k-75k, 59.8% for AGIs $75k-100k)
Taxable interest for individuals: $149 (reported on 5.6% of returns)
This zip code:
$149
Texas:
$2,255
(% of AGI for various income ranges: 0.1% for AGIs below $10k, 0.0% for AGIs $10k-25k, 0.0% for AGIs $25k-50k, 0.0% for AGIs $50k-75k, 0.1% for AGIs $75k-100k)
Taxable dividends: $43 (reported on 0.6% of returns)
Here:
$43
State:
$4,261
Net capital gain/loss: +$3,846 (reported on 0.3% of returns)
Here:
+$3,846
State:
+$16,110
Profit/loss from business: +$6,351 (reported on 23.3% of returns)
Here:
+$6,351
State:
+$11,013
(% of AGI for various income ranges: 23.0% for AGIs below $10k, 12.0% for AGIs $10k-25k, 1.5% for AGIs $25k-50k, -0.5% for AGIs $50k-75k)
IRA payment deduction: $636 (reported on 0.3% of returns)
79849:
$636
Texas:
$3,120
Total itemized deductions: $14,436 (40% of AGI, reported on 3.6% of returns)
Here:
$14,436
State:
$19,631
Here:
40.4% of AGI
State:
18.9% of AGI
Charity contributions deductions: $1,420 (4% of AGI, reported on 2.3% of returns)
Here:
$1,420
State:
$4,753
Here:
3.7% of AGI
State:
4.2% of AGI
Total tax: $1,355 (reported on 41.2% of returns)
79849:
$1,355
State:
$9,058
(% of AGI for various income ranges: 4.1% for AGIs below $10k, 2.7% for AGIs $10k-25k, 2.7% for AGIs $25k-50k, 6.2% for AGIs $50k-75k, 11.7% for AGIs $75k-100k)
Earned income credit: $2,597 (reported on 69.4% of returns)
Here:
$2,597
State:
$2,024
Percentage of individuals using paid preparers for their 2004 taxes: 81.1%
Here:
81%
State:
57%
(% for various income ranges: 78.1% for AGIs below $10k, 84.5% for AGIs $10k-25k, 76.2% for AGIs $25k-50k, 75.8% for AGIs $50k-75k, 83.3% for AGIs $75k-100k)
Household received Food Stamps/SNAP in the past 12 months: 1,974 Household did not receive Food Stamps/SNAP in the past 12 months: 2,168
Women who had a birth in the past 12 months: 442 (366 now married, 79 unmarried) Women who did not have a birth in the past 12 months: 2,802 (1,029 now married, 1,779 unmarried)
Housing units in zip code 79849 with a mortgage: 857 (73 second mortgage, 79 both second mortgage and home equity loan) Median monthly owner costs for units with a mortgage: $1,104 Median monthly owner costs for units without a mortgage: $399
Residents with income below the poverty level in 2022:
This zip code:
29.1%
Whole state:
14.0%
Residents with income below 50% of the poverty level in 2022:
This zip code:
16.1%
Whole state:
7.4%
Median number of rooms in houses and condos:
Here:
5.7
State:
6.3
Median number of rooms in apartments:
Here:
4.3
State:
4.0
Notable locations in this zip code not listed on our city pages
In group quarters: 3 (-1 institutionalized population)
Size of family households: 1,120 2-persons, 606 3-persons, 949 4-persons, 409 5-persons, 386 6-persons, 28 7-or-more-persons
Size of nonfamily households: 506 1-person, 5 2-persons
1,453 married couples with children.
1,199 single-parent households (239 men, 960 women).
7.6% of residents of 79849 zip code speak English at home.
91.4% of residents speak Spanish at home (46% very well, 19% well, 14% not well, 21% not at all).
0.2% of residents speak other Indo-European language at home (100% well).
Foreign born population: 4,568 (33.7%) (37.9% of them are naturalized citizens)
This zip code:
33.7%
Whole state:
17.2%
92%Honduras
1%Barbados
1%Chile
1%Bhutan
1%Brazil
0%Costa Rica
2%American
0%Irish
Year of entry for the foreign-born population
1,3302010 or later
4782000 to 2009
1,3011990 to 1999
1,621Before 1990
Facilities with environmental interests located in this zip code:
ALARCON ELEMENTARY (1050 CHICKEN RANCH RD in SAN ELIZARIO, TX)
(National Center for Education Statistics) - STATE ID-071904101 Organizations: SAN ELIZARIO ISD (SCHOOL DISTRICT)
Housing units lacking complete plumbing facilities: 2.9% Housing units lacking complete kitchen facilities: 2.3%
68.7%Utility gas
18.7%Electricity
7.5%Bottled, tank, or LP gas
2.9%Other fuel
1.9%No fuel used
Place of birth for U.S.-born residents:
This state: 7,637
Northeast: 45
Midwest: 29
South: 44
West: 987
78% of the 79849 zip code residents lived in the same house 5 years ago. Out of people who lived in different houses, 88% lived in this county. Out of people who lived in different counties, 50% lived in Texas.
91% of the 79849 zip code residents lived in the same house 1 year ago. Out of people who lived in different houses, 80% moved from this county. Out of people who lived in different houses, 9% moved from different state. Out of people who lived in different houses, 7% moved from abroad.
Private vs. public school enrollment:
Students in private schools in grades 1 to 8 (elementary and middle school): 79
Here:
3.7%
Texas:
8.8%
Students in private schools in grades 9 to 12 (high school):
Here:
0.0%
Texas:
8.0%
Students in private undergraduate colleges: 79
Here:
19.6%
Texas:
16.2%
Occupation by median earnings in the past 12 months ($)
49,772Education, training, and library occupations
49,678Transportation occupations
47,158Business and financial operations occupations
34,198Management occupations
31,665Construction and extraction occupations
26,951Office and administrative support occupations
Companies with federal contracts located in this zip code:
LOPEZ, ELEAZER (12317 ROSA RD in SAN ELIZARIO, TX; small business) : $12,420 in 2 contractsfrom 2005 to 2006
$7,390 with Department of Defense for Maintenance, Repair and Rebuilding of Equipment -- Plumbing, Heating, and Waste Disposal Equipment. Signed on 2006-02-23. Completion date: 2007-03-31.
$5,030 with Defense Commissary Agency for Maintenance, Repair and Rebuilding of Equipment -- Food Preparation and Serving Equipment. Signed on 2005-04-01. Completion date: 2006-03-31.
Top industries in this zip code by the number of employees in 2005:
Construction: All Other Specialty Trade Contractors (10-19 employees: 1 establishment)
Construction: Land Subdivision (5-9: 1, 1-4: 1)
Health Care and Social Assistance: Child and Youth Services (5-9: 1)
Administrative and Support and Waste Management and Remediation Services: All Other Support Services (5-9: 1)
Accommodation and Food Services: Hotels (except Casino Hotels) and Motels (5-9: 1)
People in group quarters in 2010:
56 people in correctional facilities intended for juveniles
Fatal accident statistics in 2013:
Fatal accident count: 1
Vehicles involved in fatal accidents: 1
Fatal accidents caused by drunken drivers: 0
Fatalities: 1
Persons involved in fatal accidents: 1
Pedestrians involved in fatal accidents: 0
Fatal accident statistics in 2012:
Fatal accident count: 1
Vehicles involved in fatal accidents: 1
Fatal accidents caused by drunken drivers: 1
Fatalities: 1
Persons involved in fatal accidents: 1
Pedestrians involved in fatal accidents: 0
Home Mortgage Disclosure Act Aggregated Statistics For Year 2009 (Based on 4 partial tracts)
A) FHA, FSA/RHS & VA Home Purchase Loans
B) Conventional Home Purchase Loans
C) Refinancings
D) Home Improvement Loans
E) Loans on Dwellings For 5+ Families
F) Non-occupant Loans on < 5 Family Dwellings (A B C & D)
G) Loans On Manufactured Home Dwelling (A B C & D)
Number
Average Value
Number
Average Value
Number
Average Value
Number
Average Value
Number
Average Value
Number
Average Value
Number
Average Value
LOANS ORIGINATED
18
$104,043
13
$66,511
27
$75,727
30
$15,401
1
$757,170
3
$71,647
7
$44,786
APPLICATIONS APPROVED, NOT ACCEPTED
4
$56,422
4
$45,588
11
$64,093
5
$21,494
0
$0
0
$0
7
$52,810
APPLICATIONS DENIED
3
$80,113
13
$60,579
55
$61,180
50
$23,817
0
$0
1
$66,900
9
$49,596
APPLICATIONS WITHDRAWN
4
$88,662
1
$99,840
15
$62,408
2
$47,390
1
$3,224,100
2
$49,825
0
$0
FILES CLOSED FOR INCOMPLETENESS
0
$0
2
$60,085
3
$66,110
0
$0
0
$0
0
$0
2
$24,915
Aggregated Statistics For Year 2008 (Based on 4 partial tracts)
A) FHA, FSA/RHS & VA Home Purchase Loans
B) Conventional Home Purchase Loans
C) Refinancings
D) Home Improvement Loans
F) Non-occupant Loans on < 5 Family Dwellings (A B C & D)
G) Loans On Manufactured Home Dwelling (A B C & D)
Number
Average Value
Number
Average Value
Number
Average Value
Number
Average Value
Number
Average Value
Number
Average Value
LOANS ORIGINATED
21
$111,838
12
$59,139
46
$62,887
39
$18,793
3
$59,597
6
$55,258
APPLICATIONS APPROVED, NOT ACCEPTED
0
$0
8
$68,565
14
$40,756
11
$41,545
1
$48,850
6
$55,897
APPLICATIONS DENIED
10
$93,499
17
$60,037
103
$60,749
78
$32,921
2
$40,940
12
$74,864
APPLICATIONS WITHDRAWN
1
$166,090
2
$56,595
32
$62,030
11
$34,148
3
$41,493
2
$20,315
FILES CLOSED FOR INCOMPLETENESS
0
$0
1
$93,120
3
$37,887
2
$30,025
0
$0
1
$66,440
Aggregated Statistics For Year 2007 (Based on 4 partial tracts)
A) FHA, FSA/RHS & VA Home Purchase Loans
B) Conventional Home Purchase Loans
C) Refinancings
D) Home Improvement Loans
F) Non-occupant Loans on < 5 Family Dwellings (A B C & D)
G) Loans On Manufactured Home Dwelling (A B C & D)
Number
Average Value
Number
Average Value
Number
Average Value
Number
Average Value
Number
Average Value
Number
Average Value
LOANS ORIGINATED
5
$95,242
30
$72,417
45
$61,642
36
$28,382
6
$57,147
12
$35,051
APPLICATIONS APPROVED, NOT ACCEPTED
0
$0
14
$61,180
15
$65,608
9
$19,873
1
$77,970
7
$39,833
APPLICATIONS DENIED
3
$84,347
40
$69,125
123
$62,176
96
$37,659
22
$57,950
21
$40,415
APPLICATIONS WITHDRAWN
0
$0
13
$55,881
37
$63,478
15
$45,997
7
$42,430
4
$42,182
FILES CLOSED FOR INCOMPLETENESS
1
$83,050
1
$92,870
11
$85,930
6
$55,303
0
$0
1
$19,540
Aggregated Statistics For Year 2006 (Based on 4 partial tracts)
A) FHA, FSA/RHS & VA Home Purchase Loans
B) Conventional Home Purchase Loans
C) Refinancings
D) Home Improvement Loans
F) Non-occupant Loans on < 5 Family Dwellings (A B C & D)
G) Loans On Manufactured Home Dwelling (A B C & D)
Number
Average Value
Number
Average Value
Number
Average Value
Number
Average Value
Number
Average Value
Number
Average Value
LOANS ORIGINATED
0
$0
38
$65,242
51
$64,330
36
$25,816
5
$56,330
10
$41,959
APPLICATIONS APPROVED, NOT ACCEPTED
0
$0
13
$80,673
14
$52,639
10
$14,950
2
$75,720
10
$65,595
APPLICATIONS DENIED
3
$38,430
40
$53,155
94
$56,580
102
$31,213
17
$46,167
24
$40,954
APPLICATIONS WITHDRAWN
0
$0
6
$70,025
51
$59,315
13
$38,708
1
$66,440
2
$42,010
FILES CLOSED FOR INCOMPLETENESS
0
$0
0
$0
4
$52,038
1
$19,540
0
$0
0
$0
Aggregated Statistics For Year 2005 (Based on 4 partial tracts)
A) FHA, FSA/RHS & VA Home Purchase Loans
B) Conventional Home Purchase Loans
C) Refinancings
D) Home Improvement Loans
E) Loans on Dwellings For 5+ Families
F) Non-occupant Loans on < 5 Family Dwellings (A B C & D)
G) Loans On Manufactured Home Dwelling (A B C & D)
Number
Average Value
Number
Average Value
Number
Average Value
Number
Average Value
Number
Average Value
Number
Average Value
Number
Average Value
LOANS ORIGINATED
4
$83,062
16
$66,993
51
$54,237
32
$25,943
0
$0
3
$44,943
6
$49,787
APPLICATIONS APPROVED, NOT ACCEPTED
0
$0
14
$47,999
18
$52,247
9
$29,687
0
$0
0
$0
12
$44,506
APPLICATIONS DENIED
2
$42,010
32
$46,024
137
$50,536
91
$21,957
0
$0
11
$39,646
22
$40,993
APPLICATIONS WITHDRAWN
1
$37,130
6
$87,428
46
$65,673
17
$118,602
1
$991,650
2
$125,115
2
$57,740
FILES CLOSED FOR INCOMPLETENESS
1
$85,000
3
$41,033
5
$63,114
0
$0
0
$0
0
$0
0
$0
Aggregated Statistics For Year 2004 (Based on 4 partial tracts)
A) FHA, FSA/RHS & VA Home Purchase Loans
B) Conventional Home Purchase Loans
C) Refinancings
D) Home Improvement Loans
F) Non-occupant Loans on < 5 Family Dwellings (A B C & D)
G) Loans On Manufactured Home Dwelling (A B C & D)
Number
Average Value
Number
Average Value
Number
Average Value
Number
Average Value
Number
Average Value
Number
Average Value
LOANS ORIGINATED
6
$46,268
21
$43,602
59
$48,878
33
$19,115
6
$36,000
10
$36,219
APPLICATIONS APPROVED, NOT ACCEPTED
1
$101,510
9
$42,462
21
$40,362
6
$24,905
0
$0
10
$36,105
APPLICATIONS DENIED
0
$0
33
$46,671
121
$55,902
57
$16,268
7
$67,776
32
$40,662
APPLICATIONS WITHDRAWN
1
$76,210
2
$50,105
58
$49,008
19
$34,072
0
$0
3
$33,643
FILES CLOSED FOR INCOMPLETENESS
0
$0
1
$114,310
5
$79,926
1
$78,160
0
$0
0
$0
Aggregated Statistics For Year 2003 (Based on 4 partial tracts)
A) FHA, FSA/RHS & VA Home Purchase Loans
B) Conventional Home Purchase Loans
C) Refinancings
D) Home Improvement Loans
F) Non-occupant Loans on < 5 Family Dwellings (A B C & D)
Number
Average Value
Number
Average Value
Number
Average Value
Number
Average Value
Number
Average Value
LOANS ORIGINATED
9
$73,594
21
$41,828
82
$42,928
35
$5,600
6
$45,105
APPLICATIONS APPROVED, NOT ACCEPTED
0
$0
8
$47,546
19
$56,803
6
$12,050
0
$0
APPLICATIONS DENIED
1
$57,640
32
$45,048
94
$47,239
39
$9,959
5
$40,922
APPLICATIONS WITHDRAWN
3
$69,693
6
$62,510
64
$55,471
8
$10,149
2
$120,170
FILES CLOSED FOR INCOMPLETENESS
2
$45,430
0
$0
2
$40,360
0
$0
0
$0
Aggregated Statistics For Year 2002 (Based on 2 partial tracts)
A) FHA, FSA/RHS & VA Home Purchase Loans
B) Conventional Home Purchase Loans
C) Refinancings
D) Home Improvement Loans
F) Non-occupant Loans on < 5 Family Dwellings (A B C & D)
Number
Average Value
Number
Average Value
Number
Average Value
Number
Average Value
Number
Average Value
LOANS ORIGINATED
6
$79,788
19
$60,008
40
$45,626
18
$7,328
3
$105,517
APPLICATIONS APPROVED, NOT ACCEPTED
0
$0
9
$45,377
3
$45,593
5
$7,426
0
$0
APPLICATIONS DENIED
1
$73,270
26
$37,615
63
$40,584
41
$12,630
1
$9,770
APPLICATIONS WITHDRAWN
0
$0
0
$0
47
$40,348
12
$22,634
1
$42,990
FILES CLOSED FOR INCOMPLETENESS
0
$0
0
$0
7
$42,709
1
$6,840
0
$0
Aggregated Statistics For Year 2001 (Based on 2 partial tracts)
A) FHA, FSA/RHS & VA Home Purchase Loans
B) Conventional Home Purchase Loans
C) Refinancings
D) Home Improvement Loans
F) Non-occupant Loans on < 5 Family Dwellings (A B C & D)
Number
Average Value
Number
Average Value
Number
Average Value
Number
Average Value
Number
Average Value
LOANS ORIGINATED
5
$53,344
44
$43,743
29
$41,573
35
$12,171
3
$39,730
APPLICATIONS APPROVED, NOT ACCEPTED
0
$0
19
$39,234
6
$56,828
0
$0
0
$0
APPLICATIONS DENIED
0
$0
70
$41,816
59
$42,375
26
$12,701
0
$0
APPLICATIONS WITHDRAWN
0
$0
4
$37,125
35
$35,842
16
$16,304
0
$0
FILES CLOSED FOR INCOMPLETENESS
0
$0
1
$71,320
11
$39,968
0
$0
0
$0
Aggregated Statistics For Year 2000 (Based on 2 partial tracts)
A) FHA, FSA/RHS & VA Home Purchase Loans
B) Conventional Home Purchase Loans
C) Refinancings
D) Home Improvement Loans
F) Non-occupant Loans on < 5 Family Dwellings (A B C & D)
Number
Average Value
Number
Average Value
Number
Average Value
Number
Average Value
Number
Average Value
LOANS ORIGINATED
5
$48,654
61
$40,009
26
$38,216
12
$10,258
8
$49,094
APPLICATIONS APPROVED, NOT ACCEPTED
6
$36,312
21
$41,127
3
$35,497
2
$21,005
0
$0
APPLICATIONS DENIED
8
$37,249
106
$35,237
29
$36,486
15
$9,640
2
$29,310
APPLICATIONS WITHDRAWN
3
$28,983
6
$40,383
12
$33,218
5
$1,954
0
$0
FILES CLOSED FOR INCOMPLETENESS
0
$0
1
$27,360
12
$34,602
0
$0
0
$0
Aggregated Statistics For Year 1999 (Based on 1 partial tract)
A) FHA, FSA/RHS & VA Home Purchase Loans
B) Conventional Home Purchase Loans
C) Refinancings
D) Home Improvement Loans
F) Non-occupant Loans on < 5 Family Dwellings (A B C & D)
Detailed PMIC statistics for the following Tracts:0104.03
, 0105.01
2003 - 2018 National Fire Incident Reporting System (NFIRS) incidents
According to the data from the years 2003 - 2018 the average number of fires per year is 20. The highest number of reported fire incidents - 57 took place in 2011, and the least - 0 in 2005. The data has a rising trend.
When looking into fire subcategories, the most incidents belonged to: Outside Fires (39.9%), and Structure Fires (34.7%).
Fire incident types reported to NFIRS in Zip Code 79849


 Nearest zip codes: 79836, 79927, 79838, 79928, 79907, 79936.


 According to the data from the years 2003 - 2018 the average number of fires per year is 20. The highest number of reported fire incidents - 57 took place in 2011, and the least - 0 in 2005. The data has a rising trend.
 When looking into fire subcategories, the most incidents belonged to: Outside Fires (39.9%), and Structure Fires (34.7%).